The Orbital Light Curve of Aquila X-1
Abstract
We obtained R– and I–band CCD photometry of the soft X–ray transient/neutron-star binary Aql X-1 in 1998 June while it was at quiescence. We find that its light curve is dominated by ellipsoidal variations, although the ellipsoidal variations are severely distorted and have unequal maxima. After we correct for the contaminating flux from a field star located only 046 away, the peak-to-peak amplitude of the modulation is mag in the R band, which requires the orbital inclination to be greater than . The orbital period we measure is consistent with the 18.95 h period measured by Chevalier & Ilovaisky (1998). During its outbursts the light curve of Aql X-1 becomes single humped. The outburst light curve observed by Garcia et al. (1999) agrees in phase with our quiescent light curve. We show that the single humped variation is caused by a “reflection effect,” that is, by heating of the side of the secondary star facing towards the neutron star.
1 Introduction
Soft X–ray Transients (SXTs, also called X–ray nova) are distinguished from other X–ray binaries by their transient outbursts and soft X–ray spectra (Tanaka & Lewin 1995; Tanaka & Shibazaki 1996; Chen, Schrader & Livio 1997). During the outbursts, which recur irregularly at intervals of 1 to 50 years, their X–ray luminosity increases by a factor of – in a few days and then decays back to minimum on an e-folding time scale of days. There is a concomitant increase in their optical luminosity by a factor of . The leading model for the outbursts is the Disk Instability Model (e.g., Cannizzo et al. 1998). In this model, gas transferred from the normal star in the binary builds up in a disk around the the compact star. As the temperature and optical depth in the disk increase, the viscosity increases, eventually setting off a global instability that increases the mass flow through the disk, releasing accretion energy and causing the X–ray outburst. Between the X–ray outbursts, when the X–ray flux is low, the masses and dimensions of SXTs can be measured with some confidence. A startling result of these measurements has been the discovery that the compact star is a black hole in 75% of the SXTs (e.g. see Charles 1998).
Aql X-1 is a particularly interesting SXT because of its frequent outbursts — the recurrence time is 1 year (Priedhorsky & Terrell 1984; Kitamoto et al. 1993) – and because its X–ray light curve displays richly complex behavior: (1) It shows “type I” X–ray bursts, demonstrating that the compact star is a neutron star (Koyama et al. 1981, Zhang et al. 1998b, Yu et al. 1999); (2) Nearly coherent oscillations at 548 Hz were detected during one type I burst and are likely related to the spin period of the neutron star (Zhang et al. 1998b); (3) kHz QPOs have been discovered with frequencies in the range 670–870 Hz (Zhang et al. 1998b; Yu et al. 1999); (4) A hard power–law tail extending to at least 100 keV has been detected during outbursts (Harmon et al. 1996); and (5) A sudden spectral hardening of the X–rays has been observed during the decline from an outburst and has been interpreted as the onset of a “magnetic propeller” state (Zhang et al. 1998a; Campana et al. 1998). The inferred strength of the magnetic field, – Gauss, is remarkably low for a neutron star. The spectral hardening may also be enhanced by the transition into an ADAF state (Shahbaz et al. 1998b; Zhang et al. 1998a).
The optical counterpart to Aql X-1 is V1333 Aql (Thorstensen, Charles & Bowyer 1978). Two estimates for its orbital period have appeared in the literature, 18.9479 h (Chevalier & Ilovaisky 1991, 1998) and 19.30 h (Shahbaz et al. 1998a). The former was derived from the outburst light curve, which has a single maximum per orbit; the later period was derived from the quiescent light curve, which has two humps per orbit. The single hump seen during outburst has been interpreted as being due to reprocessed X–rays in an asymmetric disk and/or the secondary star. The double hump modulation seen in quiescence is interpreted as ellipsoidal variations from the Roche–lobe filling secondary star. If correct, the difference in periods is puzzling; photometric modulations caused by a non–axisymmetric disk during an outburst tend to have a longer period than the orbital period.
Garcia et al. (1999) obtained V–band photometry of Aql X-1 in outburst and K′ photometry in quiescence. Their outburst data confirm the strong (0.6 mag) single–humped light curve seen by Chevalier & Ilovaisky (1991) and Robinson & Young (1998), though their data were not sufficient to refine the orbital period. The quiescent K′ photometry did not show any clear evidence for a modulation, suggesting a low orbital inclination. They also obtained spectroscopy in quiescence that revealed a weak, low–amplitude modulation of the absorption line radial velocities, also implying a low orbital inclination. While this agrees with the analysis of the quiescent photometric modulations by Shahbaz et al. (1998a), it is again puzzling: the large amplitude modulations seen in the outburst state suggest a high inclination. Furthermore, Garcia et al. (1999) note that the relative phasing of the outburst maxima they observed and the quiescent minima from the Shahbaz et al. study disagree. Clearly, the interpretation of the modulations in the light curves is in a confused state.
Some of this confusion was resolved when Callanan et al. (1999) obtained high-resolution images of Aql X-1 showing that the object previously thought to be Aql X-1 is actually two stars separated by only 046. Chevalier et al. (1999) subsequently showed that the fainter of the two stars is the counterpart of Aql X-1, and that 88% of the V–band light is from the line–of–sight contaminating star. The presence of a large amount of contaminating light has two immediate consequences: (1) The fractional amplitude of any photometric variations have been substantially underestimated; this leads to an underestimate of the inclination based on the amplitude of the ellipsoidal variations; and (2) previous determinations of the spectral type of the secondary star (K0 by Thorstensen et al 1978; K1 by Shahbaz et al. 1997) are incorrect. Based on its photometric colors, the spectral type of the secondary star is K6–M0 (Chevalier et al. 1999).
In this paper we present new optical photometry of Aql X-1 obtained during quiescence, and use these data to revise the orbital period and constrain the inclination of the binary system. In §2 we describe the data acquisition and calibration. In §3 we derive a revised orbital period from the light curve modulations, and compare it with previous published values. Using the estimates of Chevalier et al. (1999), we then correct the light curves for the contaminating light from the nearby field star. In §4, the contamination–corrected quiescent light curves are modeled as ellipsoidal variations and an estimate for the binary system inclination is derived. The outburst light curve of Garcia et al. (1999) is also investigated; we model the outburst photometry with a reflection/heating effect of the companion star. Section 5 summarizes our results.
2 Observations and Data Calibration
We observed Aql X-1 on 1998 June 24 – 28 UTC. Figure 1 shows the X–ray light curve of Aql X-1 in 1998, obtained with the All Sky Monitor on the Rossi X–Ray Timing Explorer 111ASM light curves are publically available at http://space.mit.edu/XTE/ASM_lc.html and at http://heasarc.gsfc.nasa.gov/docs/xte/asm_products.html., with the times of our observations marked by arrows. Aql X-1 erupted in 1998 March but our observations began more than 40 days after the end of the eruption and Aql X-1 was fully in quiescence.
We measured the optical light curve at the Cassegrain focus of the 2.1-m telescope at McDonald Observatory using a Tektronix CCD, which produced an image scale of 0352/pixel. The observing pattern was 10 images in the R band followed by 3 images in the I band, repeated ad paucas noctis. All exposures were two minutes in duration, yielding an integrated S/N of in the R band and in the I band. Observing conditions were generally good, with dark skies and 15 – 20 seeing, although occasional patchy clouds and smoke from nearby forest fires were present. The telescope tracking was, however, poor, and contributed significantly to the image point–spread function. Frames with poor image quality (208) proved to be unusable because of contamination from nearby field stars, resulting in the loss of roughly a third of the data. We obtained a total of 312 usable images in the R band and 85 in the I band.
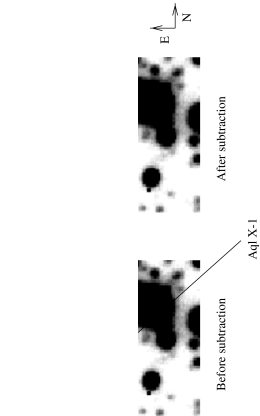
We extracted instrumental magnitudes for Aql X-1 and four local comparison stars using the DAOPHOT routine in IRAF (Stetson 1987, 1990). The local comparison stars did not vary in our data, nor are they listed as variable stars by Reynolds, Thorstensen & Sherman (1999) in their study of 6104 stars near Aql X-1. Aql X-1 lies in a very crowded field and is separated by only 22 and 24 from two nearby field stars (see Figure 2); and since these stars are only two and three magnitudes fainter than Aql X-1, it was essential to extract the flux from Aql X-1 by fitting a point spread function to the images. We used two iterations of the DAOPHOT point spread function fitting routine; a third iteration did not improve the precision of the photometry. The field star separated from Aql X-1 by only 046 is not resolved from Aql X-1 in our data. Our measurements give the sum of the flux from this star and Aql X-1 (called stars e and a by Chevalier et al. [1999]). We calibrated the fluxes by observing Landolt standards (Landolt 1992) and then used the conversions from R and I magnitudes to fluxes given in Lamla (1982). The RMS scatter in the final measured fluxes from the local comparison stars is %.
We emphasize that the use of point spread functions to extract the flux from Aql X-1 was crucial to the success of this project. The amplitude of the variations of the combined flux from Aql X-1 and its 046 companion is small, and ordinary aperture photometry would have allowed significant and variable contamination from the other nearby stars, producing unacceptably large errors in the flux measurements.
3 The Light Curves
3.1 The Orbital Period
The observed R–band light curve varies by about 0.05 mag peak–to–peak. We searched for periodicities in the light curve using an assortment of methods, including the phase–dispersion minimization method, discrete Fourier transforms, Lomb–Scargle periodograms, and “clean” power density spectra.222 The PDM, clean and Lomb–Scargle periodogram algorithms were contained in the software “PERIOD” V4.2 written by V.S. Dhillon and provided by Starlink: http://star-www.rl.ac.uk/cgi-store/storetop. All showed a multiplicity of periods, the strongest being near 0.6, 1.6, 2.3 and 2.6 cycles per day. However, it was obvious that the effects of a 1–day sampling alias dominate the analysis. Figure 3 shows the low–frequency portion of the power spectrum calculated from the R–band light curve. Nearly all features in the power spectrum can be ascribed to aliases of the fundamental frequency and its harmonics. The “tree” diagram in the lower panel of the figure marks the positions of the fundamental, the first harmonic, and their 1–day aliases and demonstrates that we account for every large peak in the power spectrum with just one number: the fundamental frequency.
We used a physically motivated method to extract the period of the fundamental. Assuming that the light curve is dominated by ellipsoidal variations that produce a signal at the orbital period and half the orbital period, we fit the light curve with a model consisting of the sum of two sinusoids whose amplitudes and phases are free, but whose frequencies are locked at and , where is the frequency of the fundamental and is the frequency of the first harmonic. The minimum of the fit gives the orbital period. This 2–sine fit produced a periodogram similar to the classical (1–sine) periodogram and the Fourier transform power spectrum in that it had minima at nearly the same frequencies, but it contained additional minima and the minima were substantially different in relative depth, e.g., the lowest minima in the classical periodogram was near 0.6 c/d, while in the 2–sine fit the minimum was near 1.3 c/d. To test how well our model reproduces the observations, we subtracted the best fit model from the light curve and recomputed the power spectrum. The power spectrum of this “pre–whitened” data is also shown, to scale, in Fig 3. The remarkable reduction of power verifies that nearly all the power is contained in just the fundamental and its first harmonic.
The R–band light curve yielded a fundamental frequency of 1.283 cycles/day, corresponding to an orbital period of 18.71 0.06 h. The upper light curve in Figure 4 shows the R–band light curve folded at this period along with the best fitting 2–sine fit. The (marginally) deeper of the two minima in the folded light curve occured at HJD 2450988.8204, which we define as phase zero. All phases in this paper use this period and definition of phase zero. The reduced of the fit was 1.27 with 306 degrees of freedom. The uncertainties were derived from the period interval encompassing the reduced + 1. To check the robustness of this period measurement, we recomputed the fit giving all data points equal weight, and then again after removing three apparent outliers: The period changed by less than 0.02 h. As a further test, we fit the comparison star light curve with the 2–sine model. When forced to have a frequency near 1.283 c/s (the frequency found in the Aql X-1 light curve), the individual amplitudes of the 2 sines in the model fit were 0.4% and 0.2%; in contrast, the amplitudes for the 2 sines when fit to the Aql X-1 light curve were both 1.3%.
The I–band light curve has fewer and noisier data points, and the of the 2–sine fit was worse . Nevertheless, the period derived from the I–band light curve, 18.85 0.06 h, is not much different from the R–band estimate, and the formal uncertainty is the same because the amplitude of the modulation is larger in the I–band than in the R–band.
3.2 Comparison with Previous Determinations of the Orbital Period
The orbital period determined from our data, 18.710.06 h, is 1.3% shorter than the 18.9479 h period found by Chevalier & Ilovaisky (1998). While this is nearly a 4 difference, we do not consider the difference significant because the quoted uncertainty in our period does not include systematic errors introduced by, for example, intrinsic variability, a non–white power spectrum, or the one-day aliasing.
Chevalier & Ilovaisky (1998) also found that additional photometry taken while Aql X-1 was in quiescence agrees with the orbital period determined from outburst data to within 0.02%. They conclude that the period determined using outburst data is the orbital period. Our result supports this interpretation.
If we use the time of the minimum of the outburst light curve given by Garcia et al. (1999) as the definition of phase zero (inferior conjunction of the secondary star) and the orbital period given by Chevalier & Ilovaisky (1998), we can project their ephemeris onto our observations and compare the relative phasing. Using =2450282.220 0.003 HJD and period 0.7894980.000 010 d, we find that the observed time of minimum in our data, HJD 2450988.8204, is at phase 0.0000.012, in excellent agreement with expectations. This agreement in phasing further supports our conclusion that the orbital period is 18.9479 hours.
The photometric period reported by Shahbaz et al. (1998a), 19.300.05 h, cannot be the orbital period of Aql X-1. Is it a superhump period? Superhumps are quasi–periodic modulations in the outburst light curves, most likely caused by a precessing elliptical accretion disk and excited by a tidal resonance with the secondary star (see Warner 1995). Superhump periods are typically a few percent larger than the orbital period in the SU UMa cataclysmic variable stars. If one naively extrapolates the orbital period–superhump period relation for the SU UMa stars to Aql X-1, the predicted difference between the orbital period and superhump period is 50%, far greater than the observed 1.9% difference. Furthermore, the superhump models require the accretion disk to extend out to the 3:1 tidal resonance, and this is only possible for binaries with extreme mass ratios, . For Aql X-1, we can estimate a value for by assuming the primary is a neutron star with mass 1.4 and the secondary is a K7 V star (Chevalier et al. 1999) with mass 0.6. This gives , far above the upper limit allowed for the tidal resonance that excites superhumps. Even for a mass ratio near =1/3, which we prefer because this is more appropriate for an evolved secondary star that fills its Roche lobe, the mass ratio remains too high for the superhump interpretation. Thus it is unlikely that the period difference can be ascribed to a superhump phenomenon. Given the small amplitude of the variations in the light curve of Aql X-1, the crowded field, and the strong 1-day aliases, we suspect that the 19.3 h period is spurious.
3.3 The Uncontaminated Light Curve
The folded light curve at the top of Figure 4 includes flux from the field star 046 away from Aql X-1. According to Chevalier et al. (1999) the field star contributes 88% of the flux in the V band and 77.5% of the flux in the I band. To correct the I–band light curve for this contamination we simply subtracted 77.5% of the mean flux from the light curve. To correct the R–band light curve we linearly interpolated between the V– and I–band magnitudes of the field star given by Chevalier et al. (1999) and then applied a correction of 0.105 0.015 mag to compensate for the intrinsic color of the field star (estimated to be a late–G to early K type star by Chevalier et al. 1999). We estimate that 83% of the flux in the R–band is contamination from the field star, where the estimated standard deviation comes partly from the estimated measurement error and partly from uncertainty about the orbital phase and therefore the brightness of Aql X-1 at the time of the measurements. The lower light curve in Figure 4 is the R–band light curve after the flux from the field star has been removed. The amplitude of the modulation in the uncorrected R–band light curve is 4.2% peak–to–peak, but after subtracting the contribution from the contaminating star, the modulation amplitude jumps to %.
4 Modeling the Orbital Modulation
4.1 The Quiescent Light Curve
The quiescent light curve shown in Fig. 4 has two humps per orbital period, which we interpret as ellipsoidal variations of the late K star. The ellipsoidal variations are, however, clearly distorted since the two humps have unequal maxima. The source of the distortion is unknown but there are two likely candidates, star spots on the K star and non-axisymmetries in the accretion disk around the neutron star. With few exceptions the dominant effect of both distortions is to increase the amplitude of one ellipsoidal hump with respect to the other. Thus, fitting an ellipsoidal light curve to the larger hump is likely to overestimate the true amplitude of the ellipsoidal variation and will, therefore, yield an upper limit to the orbital inclination. Conversely, fitting an ellipsoidal light curve to the smaller hump will yield a lower limit to the inclination.
We fit the contamination–corrected R–band light curve of Aql X-1 with synthetic light curves calculated from an updated and rewritten version of the light curve synthesis program discussed by Zhang et al. (1986). We adopted a blackbody spectral distribution with a temperature of 4000 K for the late K star, and used a gravity darkening coefficient of and linear limb darkening coefficients of and for the R–band and I–band light curves respectively (Claret 1998). The derived orbital inclinations are relatively insensitive to any of these parameters. Changing the temperature to 5000 K, for example, changed the derived orbital inclinations by only 2 – . The ratio of the masses, , must be less than 1 since we do not observe dynamically unstable mass transfer, and it must be greater than 0.1 because the mass accreting star is a neutron star. If the K star is a stripped giant, the mass ratio should be close to . The abundant evidence for mass transfer demands that the K star fill or nearly fill its Roche Lobe.
Figures 5 and 6 show the fits of synthetic light curves to the R– and I–band light curves for models in which and the K star is the sole contributor to the light curve. The orbital inclinations derived from the R–band light curve are and for the smaller and larger humps respectively, and the inclinations from the I–band light curve are and .
For several reasons we believe that the orbital inclination derived from the fit to the smaller hump in the R–band light curve is the most robust of the inclination measurements, but that it should be interpreted only as a lower limit to the orbital inclination. First, the quality and the quantity of the R–band data are much higher than the I–band data, so we strongly prefer the fits to the R–band light curves. Second, although the inclinations derived from fits to the larger hump depend fairly sensitively on the adopted mass ratio, the inclinations derived from the small hump are relatively insensitive. The inclination derived from the small hump in the R–band light curve ranged only from to over the extreme range of permissible mass ratios. Third, the accretion disk certainly contributes some of the flux from Aql X-1 in the R band, if for no other reason than H emission is observed in the spectrum of Aql X-1. (Note that the true equivalent width of the H emission line becomes almost 6 times greater than the observed equivalent width when flux from the contaminating field star is removed; the equivalent width is boosted from 5.2Å [Shahbaz et al. 1997; 1998b] to 30Å). The effect of ignoring the disk emission is to make the derived orbital inclination too small.
We conclude that the orbital inclination of Aql X-1 is greater than . This inclination is greater than the upper limits of given by Garcia et al. (1999) and 20∘–30∘ (90% confidence interval) given by Shahbaz et al. (1998a). The limits derived in these papers were based on modeling the ellipsoidal variations in the quiescent K′–band and I–band light curves, respectively. Setting aside the fact that the variations were only marginally detected in the light curves, there is a simple explanation for the discrepancy: We have removed the contaminating flux from the field star 046 away from Aql X-1. When the contaminating flux is removed, the amplitude of the ellipsoidal variations increases substantially, and with it the derived inclination.
Garcia et al. (1999) derived an upper limit of for the orbital inclination from their measurement of the upper limit to the amplitude of any radial velocity variations of the secondary star (48 km s-1) and the assumption that Aql X-1 is similar to Cen X-4, a neutron star SXT. This upper limit is much lower than our lower limit on the inclination. We believe this discrepancy is again due to the contaminating flux from the field star: The (presumably) non–varying radial velocity of the contaminating star biases measurements of orbital radial velocity variations towards lower values. Likewise, because the contaminating star is probably a late G–type star (Chevalier et al. 1999), the lines from the contaminating star and the secondary star in Aql X-1 will blend, thus making any measurement of the rotational broadening of the absorption lines highly suspect. Shahbaz et al. (1997) found a rotational broadening of the secondary star’s absorption lines of km s-1. Since the resolution of their spectrograms was 165 km s-1 and since the spectrum is bended, this value must be treated with skepticism. Also, the non–detection of the Li 6707 Å line by Garcia et al. (1999) is not significant — if one boosts their detection threshold of 0.1 Å equivalent width by a factor of 6 to compensate for the contaminating flux, then the equivalent width of lithium in Aql X-1 is consistent with that found for Cen X-4.
Shahbaz et al. (1997) found that the full–width at half–maximum of the H emission line is broader in Aql X-1 than in Cen X–4. The FWHM should not be significantly biased by the presence of the contaminating star, so inclinations based on velocity widths should remain valid. They derived an inclination of 50∘, which is entirely consistent with our measurement. As noted by Shahbaz et al. however, any gas with non–Keplerian motions that contributes to the emission line in Aql X-1 would weaken this argument. Finally, Garcia et al. (1999) estimated that the inclination must be roughly 70∘ to account for the large amplitude of the variations in the outburst light curve of Aql X-1. We conclude that the orbital inclination of Aql X-1 cannot be small and, indeed, must be greater than .
4.2 The Outburst Light Curve
Figure 7 shows the V-band light curve of Aql X-1 obtained by Garcia et al. (1999) in 1996 July during a weak, flat-topped outburst. In contrast to the light curve at minimum light, the outburst light curve has a single maximum (for additional examples, see Robinson & Young 1997 and Chevalier & Ilovaisky 1991). As noted earlier, if we adopt the orbital period of Chevalier et al. (1998), we find that the minimum of the V-band light curve is precisely in phase () with the minimum of our quiescent light curve, which was obtained two years later. This strongly suggests that the outburst light curve is caused by heating of the secondary star by flux from the neutron star and accretion disk.
Because the outburst light curve was obtained over several nights and because it is distorted by flickering, fits of refined models to the light curve are unwarranted. Instead we have calculated a synthetic light curve from a a simple model in which a late K–type star fills its Roche lobe and is heated by flux from the neutron star. The model has an orbital inclination of , a mass ratio of , and a luminosity ratio . We have no information about the scale of the binary system, but if the luminosity of the highly irradiated K star is , the luminosity of the neutron star would be , not an unreasonable luminosity for this outburst.
The fit of the model to the light curve is shown in Figure 7. While the fit is hardly perfect, the model successfully reproduces the shape, amplitude and phasing of the observed light curve. Furthermore, the inclination is consistent with the inclination derived from the ellipsoidal variations, thus solving the puzzle noticed by Garcia et al. (1999): the large amplitude of the variations seen during outburst requires a much higher orbital inclination than was originally inferred from fits to the ellipsoidal variations in the quiescent photometry (though an inclination as large as 70∘ is not necessary). We therefore conclude that the optical light curve of Aql X-1 was dominated by heating of the secondary star during the July 1996 eruption.
5 Summary
We have confirmed the presence of a double–humped orbital modulation in the quiescent light curve of Aql X-1. Our orbital period estimate of 18.71 h is slightly shorter than, but consistent with, the 18.95 h period found by Chevalier & Ilovaisky (1998). A single orbital period, 0.789498 d, fits all the available light curves during both quiescence and outburst.
After subtracting the contaminating flux from a field star 046 away from Aql X-1, the peak-to-peak amplitude of the double–humped modulation is mag. The modulation is caused by ellipsoidal variations of the K star in the system. The ellipsoidal variations are distorted but do, nevertheless, yield a lower limit to the orbital inclination of Aql X-1. We find that the inclination must be greater than .
In outburst, the orbital light curve contains a single, large–amplitude hump. A synthetic light curve produced by an irradiated, late–K star provides a good match to the outburst light curve observed by Garcia et al. (1999). Further support for the heated secondary star model comes from the excellent phase agreement between the outburst and quiescence photometric variations. During outbursts, the optical light is most likely dominated by the heating of the K–type secondary star.
References
- Callanan et al. (1999) Callanan, P., Filippenko, A. V., & Garcia, M. R. 1999, IAU Circ. 7086
- Campana et al. (1998) Campana, S., Stella, L., Mereghetti, S., Colpi, M., Tavani, M., Ricci, D., Dal Fiume, D. & Belloni, T. 1998, ApJ, 499, L65
- Cannizzo et al. (1998) Cannizzo, J. K., Chen, W., & Livio, M. 1998, ApJ, 454, 880
- Charles (1998) Charles, P. A. 1998, in Theory of Black Hole Accretion Disks ed. by. M. A. Abramowicz, G. Björnsson, & J. E. Pringle (Cambridge: Cambridge Univ. Press), 1
- Chen, Shrader & Livio (1997) Chen, W., Shrader, C.R. & Livio, M. 1997, ApJ, 491, 312
- Chevalier & Iloviasky (1991) Chevalier, C. & Iloviasky, S.A. 1991, A&A, 251, L11
- Chevalier & Iloviasky (1998) Chevalier, C., & Ilovaisky, S. A. 1998, IAU Circ. 6806
- Chevalier et al. (1999) Chevalier, C., Ilovaisky, S. A., Leisy, P., & Patat, F. 1999, A&A, 347, L51
- Claret (1998) Claret, A. 1998, A&A, 335, 647
- Garcia et al. (1999) Garcia, M. R., Callanan, P. J., McCarthy, J., Eriksen, K., & Hjellming, R. M. 1999, ApJ, 518, 422
- Harmon et al. (1996) Harmon, B.A. et al. 1996, AA Suppl. Ser. 120, 197
- Kitamota et al. (1993) Kitamoto, S., Tsunemi, H., Miyamoto, S. & Roussel–Dupre, D. 1993, ApJ, 403, 315
- Koyama et al. (1981) Koyama, K., et al. 1981, ApJ, 247, L27
- (14) Lamla, E. 1982, in Landolt–Börnstein: Numerical Data and Functional Relationships in Science and Technology: New Series, K.–H. Hellwege, editor–in–chief, Group IV, Vol 2, Subvolume b, §4.2, ed. K. Schaifers and H.H. Voigt, (Berlin: Springer–Verlag), 35
- Landolt (1992) Landolt, A. U. 1992, AJ, 104, 340
- Priedhorsky & Terrell (1984) Priedhorsky, W.C. & Terrell, J. 1984, ApJ, 280, 661
- Reynolds, Thorstensen & Sherman (1999) Reynolds, T.J., Thorstensen, J.R. & Sherman, N.D. 1999, IBVS 4715
- Robinson & Young (1999) Robinson, E. L., & Young, P. 1997, ApJ, 491, L89
- Shahbaz et al. (1998a) Shahbaz, T., Thorstensen, J. R., Charles, P. A., & Sherman, N. D. 1998a, MNRAS, 296, 1004
- Shahbaz et al. (1998b) Shahbaz, T., et al. 1998b, MNRAS, 300, 1035
- Shahbaz et al. (1997) Shahbaz, T., Casares, J., & Charles, P. A., 1997, A&A, 326, L5
- Stetson (1987) Stetson, P. B. 1987, PASP, 99, 191
- Stetson (1990) Stetson, P. B. 1990, PASP, 102, 932.
- Tanaka & Lewin (1995) Tanaka, Y. & Lewin, W.H.G. 1995, in X–Ray Binaries, ed. W.H.G. Lewin, J. van Paradijs and E.P.J. van den Heuvel (Cambridge, Cambridge Univ. Press), 126
- Tanaka & Shibazaki (1996) Tanaka, Y. & Shibazaki, N. 1996, ARAA, 34, 607
- Thorstensen et al. (1978) Thorstensen, J., Charles, P, & Bowyer, S. 1978, ApJ, 220, L131
- Warner (1995) Warner, B. 1995, Cataclysmic Variable Stars (Cambridge: Cambridge Univ. Press), 198
- Yu et al. (1999) Yu, W., Li, T.P., Zhang, W. & Zhang, S.N. 1999, ApJ, 512, L35
- Zhang, et al. (1986) Zhang, E.-H., Robinson, E. L., & Nather, R. E. 1986, ApJ, 305, 740
- Zhang, et al. (1998b) Zhang W., Jahoda, J., Kelley, R.L., Stroyhmayer, T.E., Swank, J.H. & Zhang, S.N. 1998a, ApJ, 495, L9
- Zhang, et al. (1998a) Zhang, S.N., Yu, W. & Zhang W. 1998b, ApJ, 494, L71