HST/NICMOS Observations of IZw18 – revealing a population of old AGB stars111Based on observations with the NASA/ESA Hubble Space Telescope, obtained at the Space Telescope Science Institute, which is operated by the association of Universities for Research in Astronomy, Inc., under NASA contract NAS5-26555.
Abstract
I present the first results from a HST/NICMOS imaging study of the most metal-poor blue compact dwarf galaxy IZw18. The near infrared color–magnitude diagram (CMD) is dominated by two populations, one 10-20 Myr population of red super giants and one 0.5-5 Gyr population of asymptotic giant branch stars. Stars older than 1 Gyr are required to explain the observed CMD at the adopted distance of 12.6 Mpc, showing that IZw18 is not a young galaxy. The results hold also if the distance to IZw18 is significantly larger. This rules out the possibility that IZw18 is a truly young galaxy formed recently in the local universe.
Subject headings:
galaxies: dwarf, galaxies: compact, galaxies: stellar content, stars: AGB and post-AGB, infrared: galaxies, galaxies: individual (IZw18)1. Introduction
The blue compact galaxy (BCG) IZw18 (also known as Markarian 116) was first described by Zwicky in 1966. In a seminal paper Searle and Sargent (ss (1972)) showed that IZw18 had a very low oxygen abundance, and they concluded that the galaxy either must be young or form stars in short bursts intervened by long quiescent epochs (cf. Searle et al. ssb (1973)). This has been followed by many studies of the chemical properties of IZw18 and BCGs in general. Alloin et al. (alloin (1978)) derived an oxygen abundance of 12+log(O/H)=7.2 (2% solar) for IZw18 in agreement with more recent values, e.g. Izotov and Thuan (it (1999)). In spite of many searches for more metal-poor galaxies, IZw18 remains the most metal-poor one (when nebular oxygen abundances are considered) and is often regarded as the prototypical BCG (see Kunth and Östlin ko (2000) for a review).
If IZw18 was a genuinely young galaxy, that would imply that galaxies can form still at the present cosmic epoch and considerable effort has therefore been devoted to examine the ages of BCGs. Although it is now clear that most BCGs are old (see Kunth and Östlin ko (2000)), IZw18 has remained among a small number of galaxies which show no clear signs for the presence of an old stellar population. Kunth and Sargent (ks (1986)) argued that IZw18 could be young and that the low, but non-zero, metallicity could be due to self-pollution by massive stars. Recently an extensive study of chemical abundances of BCGs was published by Izotov and Thuan (it (1999)). They found that for very low oxygen abundances (less than 5% solar) the N/O and C/O ratios stay constant and have very little scatter. Their interpretation is that N and C are produced entirely by massive () stars and that this implies that these galaxies must be younger than 40 Myr. While other interpretations are possible (Kunth and Östlin ko (2000)), this an interesting idea that deserves to be tested. With its record low oxygen abundance, IZw18 provides the critical test case.
The chemical abundances of IZw18 have been used to infer both a high and a low age (Kunth and Östlin ko (2000)), and it is clear that chemistry alone has limited value in constraining the age and star formation history given the many uncertain physical parameters involved (winds, yields, infall, initial mass function, etc.). Stronger constraints would be obtained by direct observations of the resolved stellar population. Hunter and Thronson (hunter:thronson (1995)) used deep HST/WFPC2 imaging to investigate the stellar population of IZw18, and found a population of young massive stars. No evidence for old stars was found, but neither any against. Similar results were obtained by Dufour et al. (dufour (1996)) from an independent WFPC2 data set. Lately, these two WFPC2 data sets have been carefully reanalyzed by Aloisi, Tosi and Greggio (aloisi (1999)), who discovered a population of red stars. Their results indicate that IZw18 is at least 0.5 Gyr old. This was however disputed by Izotov et al. (izotov (1999)) who claim that the distance to IZw18 has been underestimated, and that hence the age has been overestimated.
In this paper I report on the first results from a near infrared imaging study of IZw18 using NICMOS on board the HST. The goal was to search for an old stellar population, by identifying luminous red giants and asymptotic giant branch (AGB) stars. The data is however also valuable for studying the young massive stars, e.g. red super giants (RSGs) in the near infrared (NIR). A follow up program designed at investigating the presence of carbon stars by targeting molecular features were performed during Cycle 7-NICMOS. The results of this investigation will be presented in a forthcoming paper.
2. Observations and Reductions
I Zw 18 was observed for 3 orbits during Cycle 7 with NICMOS in the F110W and F160W passbands (roughly corresponding to J and H) under GO program 7461. The instrument and its performance are described in Thompson et al. (thompson (1997)) and the NICMOS instrument handbook (MacKenty et al. mackenty (1997)). The NIC2 camera was chosen to give good pixel sampling (0.075 /pixel) and an acceptable field of view (). All science exposures were obtained with the MULTIACCUM mode which employs consecutive non-destructive readouts of the detector. This enables e.g. an efficient cosmic-ray removal. For the F110W filter, two MIF1024 sequences were acquired, separated by an offset of 10 integer pixels in the Y direction. In addition, one MIF512 sequence was obtained with a 0.5 pixel offset in both the X and Y directions with respect to the first MIF1024 sequence. The use of a non-integer pixel offset was adopted since the NIC2 pixel scale slightly undersamples the point spread function (PSF) in F110W. For the F160W filter, two sets of images, consisting of one MIF512 and two MIF1024 sequences, were acquired at the same positions as the two MIF1024 sequences in F110W. The total exposure times are thus 2560 and 5120 seconds in the F110W and F160W filters respectively.
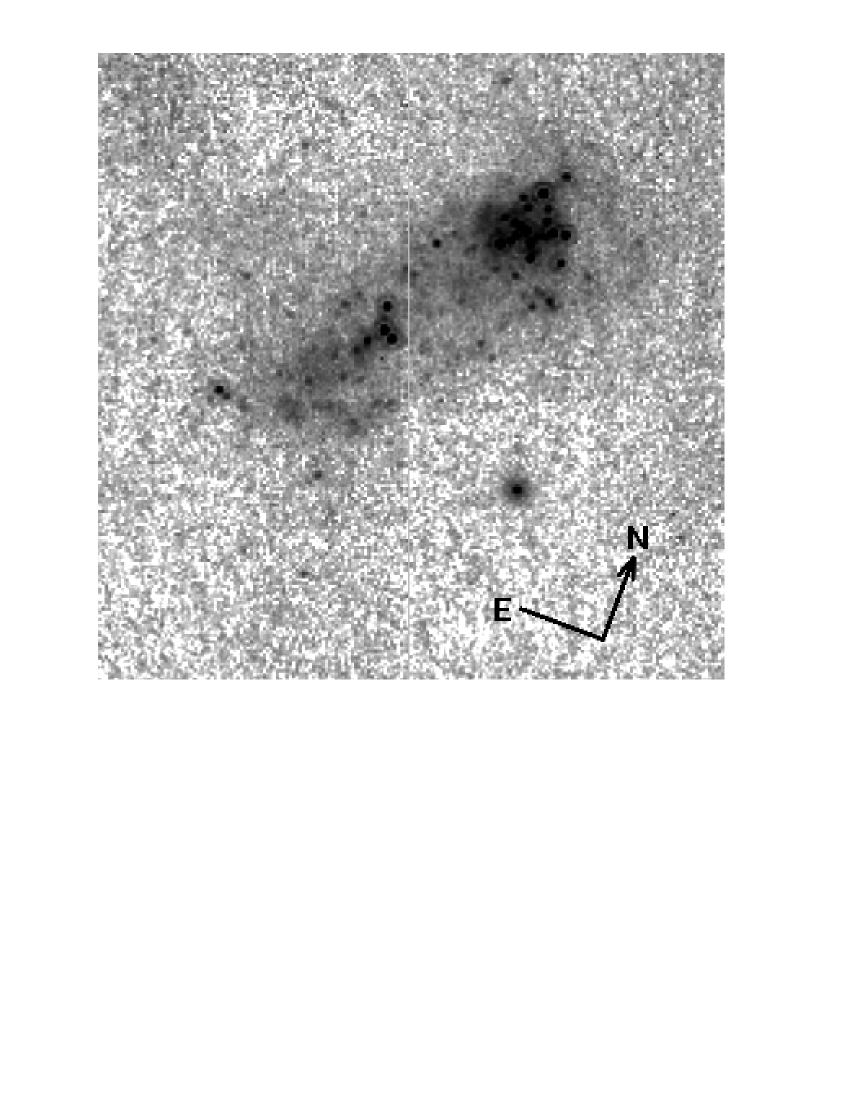
Inspection of the pipeline processed images revealed that these suffered from the so called “pedestal” effect, a residual bias not removed by the pipeline. To subtract the pedestal, the Pedestal Estimation and Quadrant Equalization Software developed by R.P. van der Marel was successfully utilized. After the pedestal had been removed, the images in each pass band were combined using the Drizzle package (Fruchter and Hook fruchter (1998)). The resulting F160W image is shown in Fig. 1.
Photometry of point sources was performed with the daophot package (Stetson et al. stetson (1990)). Unfortunately, the images contain few suitable stars for modeling the point spread function (PSF), since the bright stars are found in crowded regions. One bright source 4″ south-west (SW) of the main body turned out to be spatially extended and is probably a background galaxy. To assure that the wings of the PSF were not contaminated by neighboring stars, photometry was also performed using a synthetic PSF, which was constructed using the TinyTim software (version 4.4, Krist and Hook krist (1997)). The resulting photometry using real and synthetic PSF stars were nearly identical, except for a systematic difference of the order of 0.05 magnitudes in the F160W filter; the use of synthetic PSF stars yielded redder stars. Comparison with a control sample consisting of the eight best isolated stars showed that the synthetic PSF photometry did not suffer from any systematic offset compared to the aperture photometry, whereas the use of a natural PSF showed a small systematic offset but smaller scatter than the synthetic PSF photometry. Thus, the natural PSF photometry is probably more accurate but subject to a small systematic offset. No systematic difference was seen in the F110W data. The natural PSF photometry was finally adopted after correcting for the small offset in F160W. After the photometric reduction, stars that resulted too sharp or too extended in at least one filter were rejected. The photometries in the two filters were then combined by considering a matching radius of 0.5 pixels in X and Y for the stellar centers in the F110W and F160W images. All objects were carefully analyzed by eye and dubious sources rejected.
The DAOPHOT magnitudes refer to an aperture with radius 0.1875″. The aperture corrections in going from this to an 0.5″ aperture were determined using synthetic PSF and amount to 0.24 and 0.48 magnitudes for F110W and F160W respectively. To obtain total magnitudes an aperture correction of magnitudes for both filters were added to the the 0.5″ aperture magnitudes, and finally, the zeropoints of and were added in order to have the final calibrated magnitudes in the HST Vegamag system (see NICMOS WWW pages). I will use the designations and to express the magnitudes in F110W and F160W respectively, and for the color. The resulting color–magnitude diagrams (CMDs) and the magnitude–error relations are shown in Fig. 2. The detected stars span a similar range in color and brightness as those detected with HST/NICMOS in VIIZw403 (Schulte-Ladbeck et al. schulte (1999)).
The photometric completeness was investigated by using the addstar task. Artificial stars were added in half magnitude bins at random locations in two separate regions: “SE” covering the mildly crowded south-east region; and “NW” which is the severely crowded north-west region. Then, repeated tests were made of how many test stars within each half magnitude bin that were successfully recovered by daophot. More than 100 stars were added for each bin. The 75 and 50 % completeness levels are summarized in Table 1. In the NW region there are still bright unresolved sources left after the repeated daophot runs.
3. The distance of IZw18
Usually a distance of 10 Mpc is assumed for IZw18, based on a radial velocity of 750 km/s and a Hubble constant of km/s/Mpc. Recently Izotov et al. (izotov (1999)) have claimed that the distance to IZw18 has been severely underestimated, and if Virgo-centric flow is taken into account a distance of 15-20 Mpc is obtained. They present also other circumstantial evidence (the presence of Wolf-Rayet stars and the ionization state of IZw18) for a distance Mpc. It is true that Virgo-centric motion will slightly increase the distance, but the distance proposed by Izotov et al. (izotov (1999)) refer to old values of the distance of the Virgo cluster (21.7 Mpc). A lot of recent progress has been made on the distance to Virgo (e.g. Macri et al. macri (1999)) showing that its distance is Mpc. The Virgo-centric flow models express the distance of a galaxy as , relative to the Virgo cluster, i.e. . Applying the linear model by Schechter (schechter (1980)) gives while the non-linear models by Kraan-Korteweg (kraan (1986)) give , corresponding to 11 and 13 Mpc respectively. Hereafter I will adopt Mpc for IZw18, which corresponds to a distance modulus of . The distance should not be much larger (maximum 14.5 Mpc given the Virgocentric flow models and the uncertainty in ) than this, but may be as low as Mpc. The distances suggested by Izotov et al. (izotov (1999)) would require IZw18 to be more distant than the Virgo cluster, in spite of a much lower radial velocity.
4. Analysis and Discussion
Internal extinction has only a moderate influence on the F110W-F160W colors and in general , which has been estimated with the Synphot software. All optical investigations have found a low internal extinction in IZw18. I have adopted throughout the galaxy, and this correction has been applied to the data-points in Fig. 3.
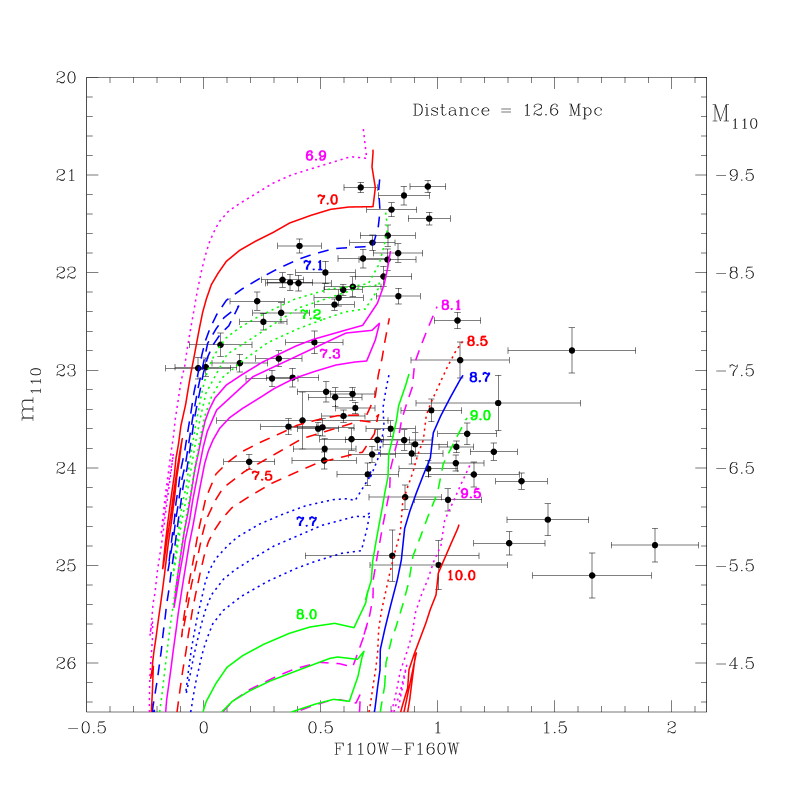
The obtained color magnitude diagram (CMD) clearly presents two distinct features. One population of red luminous stars and one with fainter () red stars. This suggests that stars with at least two different ages are present. To interpret the observed CMD I have mainly used the Padua stellar models for a metallicity (Fagotto et al. fagotto (1994), Bertelli et al. bertelli (1994)), i.e. identical to the gas metallicity of IZw18. In general, the Bertelli et al. (bertelli (1994)) isochrones are more useful than the Fagotto et al. (fagotto (1994)) tracks since the former contains later evolutionary stages, as the thermally pulsating AGB phase, which is very important for the present study.
Before interpreting the CMD, the effective temperature () and luminosity () of the stellar models have to be related to colors and absolute magnitudes in the observed system. To translate into F110W-F160W colors, and into for a given surface gravity, the BCP models by Origlia and Leitherer (ol (2000)) were used for a metallicity of .
In figure 3 the Bertelli et al. (bertelli (1994)) isochrones are over-plotted on the CMD. For a distance modulus of it is obvious that stars of ages 11-20 Myr are required to reproduce the luminous upper branch in the CMD (). These ages equals the lifetime of stars with initial masses of 20 to 13 . The upper branch is dominated with stars Myr old when the current star formation event appears to have peaked. For comparison, distances of 10 and 15 Mpc would give ages of 18 and 12 Myr respectively. Comparison with the Fagotto et al. (fagotto (1994)) stellar evolutionary tracks yield the same conclusion that the most luminous red stars are the evolved descendants of stars with initial masses 15-20 , and the same results are obtained when using “Geneva” tracks for the same metallicity (Schaerer 1999, private communication; cf. de Mello et al. demello (1998)).
For low mass stars (initial mass , age Myr) only the isochrones (Bertelli et al. bertelli (1994)) have been considered, since the tracks do not include the thermally pulsating AGB phase. The most interesting result is that to reproduce the faint red part of the CMD (), an age of 1 Gyr is required at the distance of 12.6 Mpc. Even if the distance would be as high as 15 Mpc, stars older than 0.5 Gyr would be required, and Mpc would lead to a much higher age than 1 Gyr. Not even at 20 Mpc can the faint red stars be made younger than 300 Myr. For Mpc the red faint population can be nicely explained as the upper part of AGB stars with a range of ages from 0.3 to 5 Gyr. This corresponds to the lifetime of stars with initial masses 2.5 to 1.1 . A single 0.5 Gyr old AGB population does not suffice since that would not produce enough faint () red stars, only when extending to ages in excess of 1 Gyr can the CMD of faint stars be satisfactory explained. This indicates that IZw18 has experienced more or less continuous star formation for at least 1 Gyr prior to the present burst.
The distribution of stars in the CMD is broadened by the observational error function, and it has to be assured that it cannot be reproduced by young stars plus photometric errors. If one assumes that no star is older than 100 Myr, what distribution would one expect? An isochrone of that age has a color at . The one sigma photometric errors at are , but let’s be very conservative and adopt . The one sigma range around , then contain 14 stars. For a normal distribution, 68% of the stars should be contained within this range, and one would thus expect to find only stars (i.e. 16%) with , wheras one finds more than a dozen. Thus the observed distribution of red stars cannot be reproduced by 0.1 Gyr old stars plus photometric errors. Even if rejecting the reddest stars (), an age of 1 Gyr is required to be consistent with the error distribution. Since this was a conservative estimate, we can conclude that IZw18 has an age of at least 1 Gyr. This result on the near-infrared CMD analysis is confirmed when using the synthetic CMD technique (cf. Tosi et al. (tosi (1991)); Aloisi et al. aloisi (1999)): stars older than 1 Gyr are required in order to reproduce the observed CMD, the best fit being obtained by including stars as old as 5 Gyr (Östlin 2000, in preparation).
An analysis of the spatial distribution of stars of different age show that young red super giants occupy preferentially the NW region, while the old AGB stars are more evenly distributed. Further constraints on the age of the stellar population may be obtained from the color of the underlying galaxy after the found stars have been subtracted. For a single stellar population, the integrated F110W-F160W color increases with age, from at 10 Myr up to at 125 Myr when the AGB stars start to dominate, and stays roughly constant thereafter. This has been calculated using the PEGASE spectral synthesis code (Fioc & Rocca-Volmerange 1999) and the NICMOS F110W and F160W response curves. The integrated colors in pixels boxes are typically to in the NW and in the SE region. This indicates that in the NW region, the light is dominated by an unresolved population of stars with ages 20 to 100 Myr, while in the SW region, the underlying population is dominated by stars older than 125 Myr.
The result of an age of 1 Gyr or larger for the underlying population in IZw18 is confirmed also by deep optical/ near-IR surface photometry (Östlin 2000, in preparation; Kunth & Östlin ko (2000)) and is in good agreement with the results of Aloisi et al. (aloisi (1999)) for the optical CMDs. We can thus conclude that all these different studies on independent sets of data in various spectral regions give the same answer: that IZw18 is an old galaxy.
5. Summary and Conclusions
I have analyzed the near infrared color-magnitude diagram from HST/NICMOS images of IZw18, the most metal-poor galaxy known. Assuming a distance of 12.6 Mpc, I find support for the presence of AGB stars at least 1 Gyr old. The results presented in this letter hold qualitatively even if the distance to IZw18 is significantly different. The latest star formation event appears to have peaked 14 Myr ago. My results are in good agreement with Aloisi et al. (aloisi (1999)) who from a careful reanalysis of HST/WFPC2 archival data concluded that IZw18 must be at least 0.5 Gyr old at their adopted distance of 10 Mpc. Thus, there is no need for galaxies with oxygen abundance less than 5 % of the solar value to be young as was claimed by Izotov and Thuan (it (1999)). This closes the question whether IZw18 is a genuinely young galaxy, still in the process of formation: the answer is – No!
References
- (1) Alloin, D., Bergeron, J., & Pelat, D. 1978, A&A 70, 141
- (2) Aloisi, A., Tosi, M., & Greggio, L. 1999, AJ 118, 302
- (3) Bertelli, G., Bressan, A., Chiosi, C., Fagotto, F., & Nasi, E. 1994, A&AS 106, 275
- (4) De Mello D.F., Schaerer D., Heldmann J., Leitherer C. 1998, ApJ, 507,199
- (5) Dufour, R.J., Garnett, D.R., Skillman, E.D., & Shields, G.A. 1996, in ASP Conf. Ser. 98, From Stars to Galaxies: The Impact of Stellar Physics on Galaxy Evolution, ed. C. Leitherer, U. Fritze-von-Alvensleben, & J. Huchra (San Francisco: ASP), 358
- (6) Hunter, D.A., & Thronson, H.A. Jr. 1995, ApJ 452, 238
- (7) Fagotto, F., Bressan, A., Bertelli, G., & Chiosi, C. 1994, A&AS 104, 365
- (8) Fioc, M., & Rocca-Volmerange, B. 1999, astro-ph/9912179
- (9) Fruchter, A.S., & Hook, R.N. 1998, PASP, submitted (astro-ph/9808087)
- (10) Izotov, Y.I., & Thuan, T.X. 1999, ApJ 511, 639
- (11) Izotov, Y.I., Papaderos, P., Thuan, T.X., Fricke, K.J., Foltz, C.B., & Guseva, N.G. 1999, A&A submitted, astro-ph/9907082
- (12) Kraan-Korteweg, R.C. 1986, A&AS 66, 255
- (13) Krist, J., & Hook, R. 1997, the Tiny Tim users guide v4.4
- (14) Kunth, D., & Östlin, G. 2000, A&AR in press (astro-ph/9911094)
- (15) Kunth, D., & Sargent, W.L.W. 1986, ApJ 300, 496
- (16) MacKenty, J.W., et al. 1997, NICMOS Instrument Handbook, Version 2.0, (Baltimore: STScI).
- (17) Macri, L.M., et al., 1999, ApJ 521, 155
- (18) Origlia, L., & Leitherer, C. 2000, AJ submitted (astro-ph/0001408)
- (19) Schechter, P.L. 1980, ApJ 85, 801
- (20) Schulte-Ladbeck, R.E., Hopp, U., Greggio, L., & Crone, M.M. 1999, AJ 118, 2705
- (21) Searle, L., & Sargent, W.L.W. 1972, ApJ 173, 25
- (22) Searle, L., Sargent, W.L.W., & Bagnuolo, W.G. 1973, ApJ 179, 427
- (23) Stetson, P.B., Davis, L.E., & Crabtree, D.R. 1990, in ASP Conf. Ser. 8, CCDs in Astronomy, ed. G.H. Jacoby (San Francisco: ASP), 289
- (24) Thompson, R.I., Rieke, M., Schneider, G., Hines, D.C., & Corbin, M.R. 1998, ApJ 492, L95
- (25) Tosi, M., Greggio, L., Marconi, G., & Focardi, P. 1991, AJ 102, 951
- (26) Zwicky, F. 1966, ApJ 143, 192

| completeness | F110W | F160W | |||
|---|---|---|---|---|---|
| level | SE | NW | SE | NW | |
| 75% | 23.6 | 22.8 | 22.6 | 22.0 | |
| 50% | 24.0 | 23.5 | 23.4 | 22.7 | |