A Self-Occulting Accretion Disk in the SW Sex Star DW UMa 111Based on observations with the NASA/ESA Hubble Space Telescope, obtained at the Space Telescope Science Institute, which is operated by the Association of Universities for Research in Astronomy, Inc. under NASA contract No. NAS5-26555.
Abstract
We present the ultraviolet spectrum of the SW Sex star and nova-like variable DW UMa in an optical low state, as observed with the Space Telescope Imaging Spectrograph on board the Hubble Space Telescope (HST). The data are well described by a synthetic white dwarf (WD) spectrum with K, , km s-1 and . For this combination of and , WD models predict M⊙ and cm. Combining the radius estimate with the normalization of the spectral fit, we obtain a distance estimate of pc.
During our observations, DW UMa was approximately 3 magnitudes fainter in V than in the high state. A comparison of our low-state HST spectrum to a high-state spectrum obtained with the International Ultraviolet Explorer shows that the former is much bluer and has a higher continuum level shortward of 1450 Å. Since DW UMa is an eclipsing system, this suggests that an optically thick accretion disk rim blocks our view of the WD primary in the high state. If self-occulting accretion disks are common among the SW Sex stars, we can account for (i) the preference for high-inclination systems within the class and (ii) their V-shaped continuum eclipses. Moreover, even though the emission lines produced by a self-obscured disk are generally still double-peaked, they are weaker and narrower than those produced by an unobscured disk. This may allow a secondary line emission mechanism to dominate and produce the single-peaked, optical lines that are a distinguishing characteristic of the SW Sex stars.
keywords:
accretion, accretion disks — binaries: close — novae, cataclysmic variables — stars: individual: DW UMa1 Introduction
The SW Sex stars are a sub-class of nova-like cataclysmic variables (NLCVs). Like all NLCVs, they are semi-detached, close binary systems, in which a late-type main sequence secondary star loses mass to a WD primary via Roche-lobe overflow onto an optically thick accretion disk. However, they also exhibit a number of peculiar characteristics that are not shared by “ordinary” NLCVs (e.g. Thorstensen et al. 1991; Dhillon, Jones & Marsh 1994; Rutten, van Paradijs & Tinbergen 1992): (i) 7 of the 10 current members of the class are eclipsing systems (for an up-to-date list with references, see Hoard, Thorstensen & Szkody 2000); (ii) their continuum eclipses appear to be more V-shaped (as opposed to U-shaped) than those of other NLCVs; (iii) their optical emission lines are single-peaked (instead of double-peaked, as expected for lines formed in a rotating accretion disk); (iv) their low-excitation optical emission lines are only weakly eclipsed at primary minimum, but appear to undergo absorption events at the opposite orbital phase; (v) the radial velocity curves derived from their optical emission lines exhibit significant phase shifts relative to photometric minimum. The V-shaped eclipses noted in (ii) are often interpreted as evidence for flatter-than-expected radial temperature distributions and non-stationary accretion in SW Sex star disks (e.g. Rutten et al. 1992; Horne 1999).
At least four different models have been proposed to explain the SW Sex stars’ “mysterious, but consistent behavior” (Thorstensen et al. 1991). The physical mechanisms invoked in these models are: (i) a WD-anchored magnetic field that dominates the geometry of the accretion flow (Williams 1989; Dhillon, Marsh & Jones 1991); (ii) an accretion disk wind that alters the radiative transfer of the optical emission lines and the energy budget of the accretion disk (Honeycutt, Schlegel & Kaitchuck 1986; Murray & Chiang 1996; Dhillon & Rutten 1995); (iii) an accretion stream from the secondary star that overflows the outer disk edge (Hellier & Robinson 1994), possibly in combination with either non-axisymmetric, vertical disk structure (Hoard 1998; Hoard et al. 2000) or a flared, but not self-occulting disk (Hellier 1998); (iv) a disk-anchored magnetic field that acts as a propeller and ejects a significant amount of material out of the system (Horne 1999).
No real consensus has emerged to date regarding which, if any, of these models is correct. In our view, this is partly because the models have been tested almost exclusively against the known, optical characteristics of the SW Sex stars – which they were designed to reproduce in the first place. A promising, complementary approach is to compare the models to observation in a qualitatively different observational regime. With this idea in mind, we have obtained high time- and medium spectral resolution ultraviolet (UV) spectroscopy of the SW Sex star DW UMa with the Space Telescope Imaging Spectrograph (STIS) on board the HST. Much to our initial disappointment, our observations found DW UMa in a deep (V 17.6) low state (in the high state, V 14.5). However, a comparison of our HST data to International Ultraviolet Explorer (IUE) observations of DW UMa in its “normal”, high state reveals a surprising result: DW UMa’s far-UV continuum (shortward of 1450 Å) is higher in the low state than in the high state. As we will discuss, the simplest interpretation of this result is that the WD in DW UMa is geometrically occulted by the rim of the accretion disk in the high state.
2 Observations and Analysis
The HST/STIS observations of DW UMa took place on January 25 of 1999 (UT) and covered just over two complete cycles of DW UMa’s 3.28 hr orbital period. Near-simultaneous optical photometry obtained from the MDM observatory puts DW UMa at about around the time of the HST observations. The instrumental set-up consisted of the 52″ 0.2″ slit, the FUV-MAMA detectors and the G140L grating, yielding a wavelength coverage of 1150 Å - 1720 Å at a resolution of 1 Å (FWHM). TIME-TAG mode was used throughout, i.e. individual photon arrival times were recorded at a sampling rate of 125s. The data were split into suitable “sub-exposures” with the IRAF task INTTAG within STSDAS/CALSTIS. These sub-exposures were then calibrated via the standard CALSTIS pipeline, using the reference files available in December 1999. The absolute flux scale of the flux-calibrated spectra is accurate to about 4%.
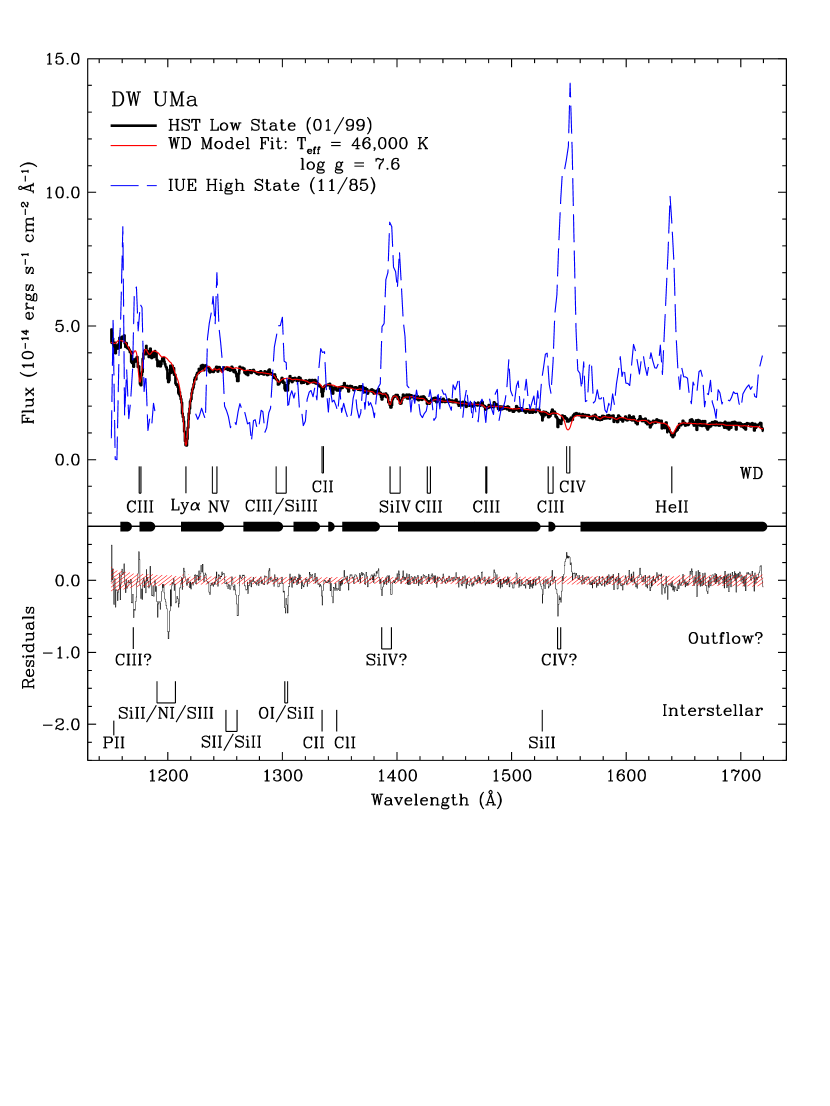
In Figure 1, we show the out-of-eclipse UV spectrum of DW UMa between HJD 2451204.122 – 2451204.168, a time interval during which the flux from the target was particularly stable. The corresponding orbital phase range is 0.32 – 0.65. The spectrum is quite blue and dominated by absorption lines, as expected for a hot WD. The thick line in Figure 1 is the best-fitting synthetic WD spectrum, which was obtained by interpolation from a grid of LTE model spectra calculated with TLUSTY/SYNSPEC (Hubeny, Lanz & Jeffery 1994 Hubeny 1988; Hubeny & Lanz 1995). The model spectrum is characterized by seven free parameters: (i) the effective temperature (); (ii) the surface gravity (); (iii) the projected rotational velocity (); (iv) the metal abundance (); (v) the interstellar reddening (); (vi) the interstellar neutral hydrogen column (); (vii) the normalization (). The Helium abundance was kept fixed at its solar value to match the depth of the He ii 1640 Å feature.
Obvious/suspected interstellar lines were masked out in the fit, except for the interstellar contribution to Ly , which was modeled as a fully damped absorption profile. We also masked out three additional features, which we tentatively identify as blue-shifted components of C iii 1175 Å, Si iv 1397 Å and C iv 1549 Å (see bottom panel of Figure 1). All of these features lie at km s-1 from the rest wavelengths of their parent lines and are therefore probably formed in an outflow from the system. This identification is also supported by (i) the P-Cygni character of the fit residuals in the vicinity of the two Carbon lines (especially C iv 1549 Å), and (ii) the presence of two features in the residuals shortward of 1400 Å, whose spacing is consistent with the two components of the Si iv 1397 Å doublet.
The fit shown in Figure 1 gives a of 1079 for 712 degrees of freedom (). The corresponding model parameters are listed in Table 1. The low reddening and small Hydrogen column we derive are consistent with each other, with a previous reddening determination (Szkody 1987) and with the total galactic value of in the direction of DW UMa (Dickey & Lockman 1990). Table 1 also contains estimates of the mass and radius of DW UMa’s WD, which are based on the carbon-core WD models of Panei, Althaus & Benvenuto (2000) for our best-fit values for and . The distance estimate in Table 1 is based on the normalization of the spectral fit and the WD radius estimate. The relatively large value of pc is consistent with the lower limit of pc (depending on the spectral type of the secondary) obtained by Marsh & Dhillon (1997). Potential sources of systematic error on our parameters include: (i) the possible contribution of other components to the spectrum (e.g. the outflow or a residual disk); (ii) the choice of masking windows in the spectral fit; (iii) the application of a mass-radius relation for isolated WDs to an accretion-heated WD in a NLCV; (iv) our assumption that the WD is entirely unobscured.
3 Discussion
For comparison with our low state HST observations, we also show in Figure 1 a high state, out-of-eclipse spectrum of DW UMa obtained approximately 13 years earlier with IUE (SWP27097; Szkody 1987). The IUE spectrum is much redder than the HST one, and, unlike the latter, contains strong emission lines. Most importantly, however, the UV continuum shortward of 1450 Å is actually higher in the low state HST spectrum than in the high state IUE one. Thus if we are correct in attributing the low-state UV light to the WD primary, our view of this system component must be blocked in the high state. 333The only alternative we can think of is that the WD is much cooler in the high state than in the low state. We discard this as physically implausible, since the temperature of the WD is expected to increase with increasing accretion rate (Sion 1999). We have also inspected the five other (2 SWP and 3 LWP) UV spectra of DW UMa that were taken by IUE. All of them share the flat UV continuum slope of the high-state IUE spectrum shown in Figure 1, and none exhibits a significantly higher UV flux level. Since the combined IUE observations cover the entire orbital cycle (Szkody 1987), the WD in DW UMa appears to be obscured at most or all binary phases during the high state.
The simplest interpretation of these findings is that, in the high state, our view of the WD is blocked by the rim of a flaring, optically thick accretion disk. 444A flat, geometrically thin, optically thick disk can occult no more than half of the projected area of the WD. The presence of such a disk can therefore reduce the high state WD flux by at most a factor of two. The maximum discrepancy between low-state and high-state continua is larger than this. Moreover, the hot, inner regions of a geometrically thin disk would themselves contribute substantially to the far-UV flux, offsetting the effect of the WD occultation. For a disk with semi-opening angle (measured at its outer edge), this requires that . In a deeply eclipsing system like DW UMa, this condition may well be met (see below). Our results can then be explained as follows. In the high state, the inner disk, the WD and the front of the disk are all hidden from view by the disk’s front rim. The only elements that remain visible are the cool, outer regions on the back of the disk, as well as the occulting disk rim itself. The observed UV flux in the high state is therefore much lower (and the UV spectrum much redder) than if the hot, inner disk, and the WD at its center, were visible. In the low state, the mass transfer rate from the secondary star is severely reduced or completely shut off. The accretion disk then becomes optically thin (or disappears completely), and the WD emerges. In order to be consistent with the observations, this picture requires that the hot, compact WD should match or exceed the far-UV – but not the optical – output of the much cooler, visible regions of the high-state accretion disk. This is plausible, given the differences in effective temperature and projected area associated with these system components. For example, for two blackbodies at temperatures K and K, the ratio is approximately 92 at Å but only about 6 at Å. So if the visible portions of the high state disk have a characteristic temperature near and present a projected area around 100 times that of the WD, the UV flux in the low state will be similar to that in the high state, whereas the optical flux will be 3 magnitudes (15) lower, as is observed.
Thus the simple hypothesis that DW UMa in the high state harbors a self-occulting accretion disk can account for: (i) the red UV colors in the high state; (ii) the blue UV colors in the low state; (iii) the approximate equality of the high- and low-state UV flux levels; (iv) the lack of such an equality in the optical waveband. Given this success, it is interesting to explore the impact of the self-occultation scenario more generally, i.e. beyond its specific application to our HST observations of DW UMa. First, it is obvious that the preference for eclipsing systems in the SW Sex class is explained quite naturally if at least some aspects of the SW Sex syndrome are related to the presence of a self-occulting accretion disk. Second, Smak (1994) has pointed out that a flared accretion disk will produce increasingly V-shaped continuum eclipse light curves as it is viewed increasingly edge-on. This effect is due to the increasing relative contribution of the facing disk rim to the total light. But an additional effect is at work in a self-occulting disk: since the hot disk center is permanently hidden from view, even the top of the disk produces a more V-shaped eclipse in this case (Rutten 1998). Third, the line profiles produced by a self-obscured, flared disk will be significantly different from those produced by a fully visible disk. This may have a bearing on the peculiar optical emission line behaviour characteristics of the SW Sex stars.
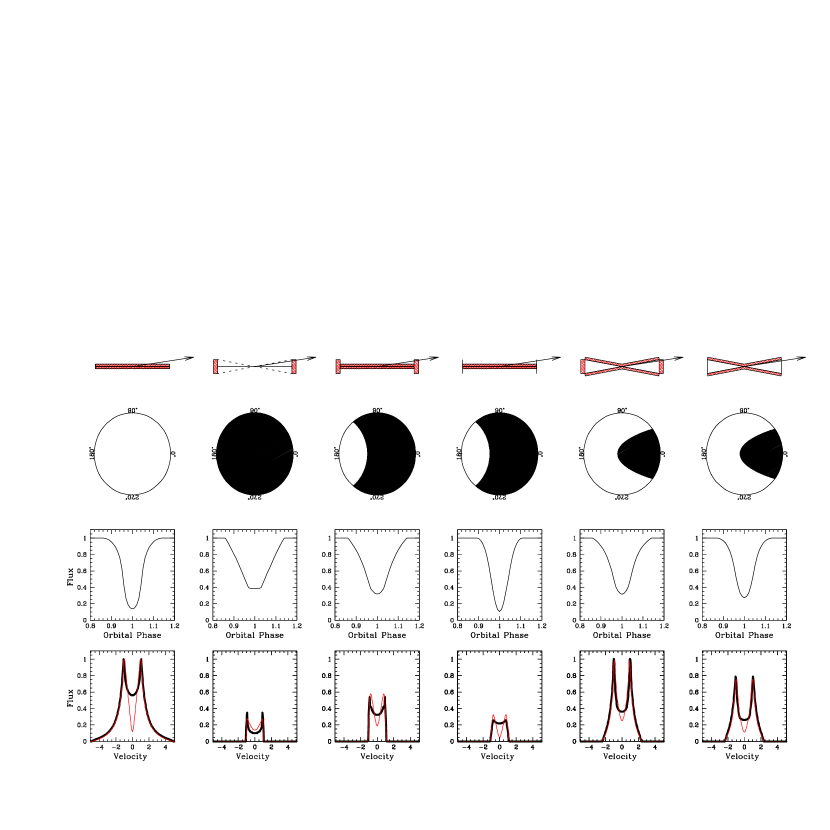
To illustrate and explore the last two points, we show in Figure 2 some synthetic eclipse light curves and line profiles. In calculating these models, the following parameters were adopted: (i) primary mass: ; (ii) mass ratio and inclination: and ; (iii) secondary radius: ; (iv) accretion disk radius: ; (v) radial surface brightness distribution: . The combination of and in (ii) gives an eclipse width roughly consistent with that of DW UMa (Dhillon et al. 1994). is based on Smith & Dhillon’s (1998) mass-radius relation for CV secondaries, taking . is the distance from the WD to the inner Lagrangian point, and is based on DW UMa’s total eclipse width in the high state (Dhillon et al. 1994). The radial surface brightness distribution in (v) is applied to both lines and continuum. To explore the effect of the shape of the disk on line profiles and continuum light curves, we have calculated two types of models. In one, the disk is described as flat, but with a raised rim at its outer edge; in the other, the disk is taken to have a constant aspect ratio H/R. These two shapes are the limiting cases of concave disks. In both cases, we have set . We have also considered two limiting cases for emission from the facing rim: for each disk shape, we present models with and without rim emission. In the former, the surface brightness of the rim is the same as at the top edge of the disk. All model line profiles were calculated in both optically thin and thick limits. For the latter, we generalized slightly the treatment given in Horne & Marsh 1986 to account for the flare of the disk.
The third row of panels in Figure 2 shows that self-obscured disks do indeed produce much more V-shaped continuum eclipses than a flat disk, regardless of the precise disk shape. As expected, the effect is particularly pronounced when the rim contributes significantly to the emission. Thus self-occultation can easily account for the V-shaped continuum eclipses of the SW Sex stars and for the correspondingly flat T(R) distributions obtained in eclipse mapping studies of SW Sex stars (Rutten et al. 1992). The bottom row of panels in Figure 2 shows that the line profiles produced by self-obscured disks are weaker and narrower than those produced by a flat disk. This is because the bright, quickly rotating inner disk regions are no longer visible in a self-occulted disk. However, the line profiles are generally still double peaked. Thus self-occultation alone can probably not account for the single-peaked profiles of the optical lines in the SW Sex stars. Self-occultation may nevertheless be key to the production of single-peaked line profiles in some of these systems. In particular, the weakness of lines produced by a self-obscured disk may allow a secondary, normally negligible, line emission mechanism to dominate. This mechanism could actually be at work in all NLCVs, but may only be observable in the SW Sex stars.
We are grateful to Joe Patterson, Jonathan Kemp, John Thorstensen and Cindy Taylor for their contributions to this project and to Leandro Althaus for providing his WD mass-radius relations in electronic form. Support for this work was provided by NASA through grant number GO-7362 from the Space Telescope Science Institute (STScI), which is operated by AURA, Inc.,under NASA contract NAS5-26555. Additional support for CK was provided by NASA through Hubble Fellowship grant HF01109.0198A, also awarded by STScI.
References
- (1) Brown, T. M., Ferguson, H. C. & Davidsen, A. F. 1996, ApJ, 472, 327
- (2) Dhillon, V. S., Marsh, T. R. & Jones, D. H. P. 1991, MNRAS 252, 342
- (3) Dhillon, V. S., Jones, D. H. P. & Marsh, T. R. 1994, MNRAS, 266, 859
- (4) Dhillon, V. S. & Rutten, R. G. M. 1995, MNRAS, 277, 777
- (5) Dickey, J. M. & Lockman F. J. 1990, ARA&A, 28, 215 ( tabulation available at http://heasarc.gsfc.nasa.gov/cgi-bin/Tools/w3nh/w3nh.pl)
- (6) Hellier, C. 1998, PASP, 110, 420
- (7) Hellier, C. & Robinson, E. L. 1994, ApJ, 431, L107
- (8) Hoard, D. W. 1998, PhD Thesis, University of Washington (available at http://www.ctio.noao.edu/hoard)
- (9) Hoard, D. W., Thorstensen & Szkody, P. 2000, ApJ, in press
- (10) Honeycutt, R. K., Schlegel, E. M. & Kaitchuck, R. H. 1986, ApJ, 302, 388
- (11) Horne, K. & Marsh, T. R. 1986, MNRAS, 218, 761
- (12) Horne, K. 1999, in Annapolis Workshop on Magnetic Cataclysmic Variables, Hellier, C. & Mukai, K. (eds.), ASP Conference Series, Vol. 157, 349
- (13) Hubeny I. 1988, Comp. Phys. Comm. 52, 103
- (14) Hubeny I., Lanz T. & Jeffery C. S., 1994, in Newsletter on Analysis of Astronomical Spectra, Jeffery C. S. (ed.), Vol. 20, 30
- (15) Hubeny I. & Lanz T., 1995, ApJ 439, 875
- (16) Knigge, C., Long, K. S., Blair, W. P. & Wade, R. A. 1997, ApJ, 476, 291
- (17) Marsh, T. R. & Dhillon, V. S. 1997, MNRAS, 292, 385
- (18) Murray, N. & Chiang, J. 1996, Nature, 382, 789
- (19) Panei, J. A., Althaus, L. G. & Benvenuto, O. G. 2000, A&A, 353, 970
- (20) Rutten, R. G. M., van Paradijs, J. & Tinbergen, J. 1992, A&A, 260, 213
- (21) Rutten, R. G. M. 1998, A&AS, 127, 581
- (22) Sion, E. M. 1999, PASP, 111, 532
- (23) Smak, J. 1994, AcA, 44, 265
- (24) Szkody, P. 1987, AJ, 94, 1055
- (25) Thorstensen, J. R. et al. 1991, AJ, 102, 272
- (26) Williams, R. E. 1989, AJ, 97, 1752
| Parameter | ValueaaUncertainties on the fit parameters correspond to 1- confidence intervals for all parameters considered jointly after scaling the errors on the data by . |
|---|---|
| [K] | 46,000 1,000 |
| [cm s-2] | 7.60 0.15 |
| [km s-1] | 370 100 |
| [] | 0.47 0.15 |
| [10-24] | 3.08 0.15bbThis is the formal error of the fit. There is also a 4% uncertainty in the absolute flux calibration of the spectrum and an uncertainty of up to 20% in the normalization of the models (c.f. Brown, Ferguson & Davidsen 1996; Knigge et al. 1997) |
| [mag] | 0.005 0.005 |
| [cm-2] | 19.4 0.1 |
| [] | 0.48 0.06 |
| [ cm] | 1.27 0.18 |
| d [pc] | 830 150ccThe quoted uncertainty accounts for the formal errors on and , as well as for the uncertainties in flux calibration and model normalization. |