Morphology-Density Relation for Simulated Clusters of Galaxies in Cold Dark Matter Dominated Universes
Abstract
We present a model to investigate the formation and evolution of cluster galaxies using cosmological high-resolution -body simulations. The -body simulations are used to construct merging history trees of dark halos. Gas cooling, star formation, supernova feedback and mergers of galaxies within dark halos are included by using simple prescriptions taken from semi-analytic models of galaxy formation. In this paper, we examine the merger-driven bulge formation model and represent the morphology-density relation of cluster galaxies at . We find that this morphological evolution model can explain the distribution of elliptical galaxies in the clusters well and cannot reproduce the distribution of S0 galaxies. This result suggests that the elliptical galaxies are mainly formed by the major mergers, while, in the S0 formation, the processes other than major mergers play important role.
1 INTRODUCTION
It is well established that galaxy populations vary with the density of neighbouring galaxies in clusters of galaxies (Dressler, 1980). This morphology-density relation (hereafter MDR) indicates that dynamical processes that depend on environment of each galaxy mainly affect the final configuration of the stellar component. This impression seems to be supported by the Hubble Space Telescope images of clusters at intermediate redshifts, which show an abnormally high proportion of spiral and irregular types at and increase of S0 fraction toward the present time (Couch et al., 1994; Dressler et al., 1997).
Some mechanisms that may transform one morphological type into another have been proposed, for example, ram-pressure stripping of interstellar medium of spirals by a intracluster medium (Gunn & Gott, 1972; Fujita & Nagashima, 1999), galaxy harassment by cumulative tidal interactions in clusters (Moore et al. 1996, 1998), and galaxy mergers (Toomre, 1977). -body simulations have confirmed that merging disk galaxies produce galaxies resembling ellipticals as merger remnants (e.g. Barnes 1996), so that the galaxy merger is a favorite explanation for the predominance of ellipticals and S0s in rich clusters (Kauffmann et al., 1993; Kauffmann, 1996; Baugh et al., 1996).
The purpose of our study is to check this merger hypotheses by investigating the MDR for the simulated clusters in the cosmological context. For this purpose, it is difficult in the present situation to use numerical simulations including both gravity and gas dynamics (e.g. Katz et al. 1992; Evrard et al. 1994), because such simulations are expensive in CPU time and so only a limited range of parameter space can be explored with an insufficient spatial resolution.
Semi-analytic modeling of galaxy formation has already proved to be a powerful technique (e.g. Kauffmann et al. 1993; Cole et al. 1994). However, we cannot identify the position of galaxies by such approaches, because these models follow the collapse and merging histories of dark halos by using a probabilistic method on the mass distribution based upon an extension of the Press-Schechter formalism (Press & Schechter, 1972; Bond et al., 1991; Bower, 1991; Lacey & Cole, 1993).
One approach to identify the position and velocity of each galaxy is to track the merging histories of dark halos by using -body simulations and to combine them with the simple prescriptions of the semi-analytic models Roukema et al. (1997); Kauffmann et al. (1999); Benson et al. (2000). Their schemes, however, do not deal with the substructures within dark halos. Since the dynamics within clusters may strongly affects the evolution of cluster galaxies (Okamoto & Habe 1999, 2000), we should use a new galaxy tracing method.
In this paper, we adopt the galaxy tracing method provided by Okamoto & Habe (1999, 2000), which enables us to trace the individual galactic dark halos within dense environments using high-resolution -body simulations, that is, we can obtain the three-dimensional distribution of the galaxies within clusters. Our formula of modeling gas cooling, star formation, supernova feedback, and galaxy mergers is directly taken from the previous semi-analytic work. We also adopt a merger-driven scheme for the production of galactic bulges and the way of the morphological classification based on bulge-to-disk ratios as earlier studies Kauffmann et al. (1993); Baugh et al. (1996).
In §2, we describe a brief outline of the galaxy formation model used here. We show the results about the morphology of the galaxies in §3. These results are discussed in §4.
2 MODEL
We exam the evolution of cluster galaxies in the standard cold dark matter (SCDM) universe (km s-1 Mpc) and the open CDM (OCDM) universe (). The baryon density is set to and for SCDM and OCDM, respectively.
The outline of the procedures of galaxy formation is as follows. At first, the merging path of galactic halos are realized by the cosmological high-resolution -body simulations. Next, in each merging path, evolution of the baryonic component, namely, gas cooling, star formation, and supernova feedback, are calculated based on Kauffmann et al. (1993) and Cole et al. (1994). We refer a system consisting of the stars and cooled gas as a galaxy. When two or more dark halos merge together, we estimate the merging time-scale based on the dynamical friction time-scale. When the merging of galaxies occurs, we change the morphology of the merger remnant by the type of the merger. Finally, we calculate the luminosity and color of each galaxy. Through the above procedures, we obtain the morphological distribution of cluster galaxies.
2.1 -Body Calculation and Merging of Dark Halos
The merging histories of galactic dark halos are realized using the same method and simulation data by Okamoto & Habe (2000). Note that they trace halo-stripped galaxies as well as the galactic halos because halo disruption is probably due to lack of dissipative processes which are not included in the -body simulations (Summers et al., 1995). The merging histories are constructed with a 0.5 Gyr time step in their paper, while here we adopt half of the time step for high redshifts () at which the galactic halos form and merge violently (Okamoto & Habe, 2000). This improvement, however, hardly changes our results.
2.2 Model of Galaxy Formation
The following prescriptions are almost the same as the previous ordinary semi-analytic models.
For simplicity, a dark halo is modeled as an isothermal sphere whose mass and radius are taken from -body data. The source of the diffuse gas in a halo is hot gas contained in its progenitor halos and in the accreting matter. The baryon fraction of the accreting matter is defined as . We assume that the hot gas has the distribution that parallels to that of the dark matter with the virial temperature of the halo. When a galactic halo is tidally stripped, the hot gas in the halo is also stripped proportional to the amount of the stripped dark matter.
The cooling time-scale, , is obtained as a function of the radius from the hot gas density profile, the temperature of the gas, and the cooling function as follows,
| (1) |
where is the mean molecular weight, is the electron number density at the radius , and is the Boltzmann constant. Using the zero-metallicity and solar-metallicity cooling functions given by Sutherland & Dopita (1991), the cooling efficiency depending on the metallicity of the gas are calculated by interpolation and extrapolation.
When a halo mass becomes more than double of the mass at the forming time, the diffuse hot gas contained in the halo is reheated by shock to the virial temperature of the halo (Somerville & Primack, 1999). We refer this epoch as the reheating time of the halo. The cooling radius, , is defined as a radius at which the cooling time-scale, , equals to the elapsed time from the last reheating time of the halo, . The hot gas that distributes between and is cooled and added to the cold gas reservoir of the galaxy during the time-step, .
The star formation in disks is described by the following simple law,
| (2) |
| (3) |
where eq.(2) denotes the rate of stars newly formed, is the star formation time-scale of the galaxies which forms at , is the dynamical time-scale of the galaxies, and indicates the dynamical time-scale of a halo which forms at . Here, we assume that the star formation time-scale is proportional to the dynamical time-scale. We calculate according to the virial theorem and the spherical collapse model. The star formation time-scale at , , is a free parameter and we set to 5 Gyr in this paper. We have confirmed that this parameter does not affect strongly on the morphology of the cluster galaxies.
The feedback process by supernovae of massive stars has many uncertainties actually, therefore we adopt a simple description (Cole et al., 1994),
| (4) |
where and are free parameters. When adopting , eq.(4) corresponds to the formula in Kauffmann et al. (1993), and Cole et al. (1994) used in their fiducial model.
When two or more halos merge together, we identify a galaxy contained in the largest progenitor as the central galaxy of the new common halo. Other galaxies are identified as satellites. These satellites merge with the central galaxy when the elapsed time from the last reheating time exceeds the dynamical friction time-scale (Binney & Tremaine, 1987),
| (5) |
where and are the radius and circular velocity of the new common halo, respectively, is the total mass of a halo to which the satellite belonged as a central galaxy or the mass of stars and cold gas in the case that the satellite was a halo-stripped galaxy, and is the Coulomb logarithm, which is approximated as (Somerville & Primack, 1999). When the mass growth of the common halo satisfies the reheating condition, the elapsed time from the last reheating time is recalculated because orbits of satellites may be violently disturbed in such a case.
When a satellite galaxy merges with a central galaxy and the mass ratio of the galaxy with smaller mass to that with larger mass is larger than , all stars of the satellite and disk stars of the central galaxy are incorporated with the bulge of the central galaxy. Then cold gases of both galaxies turns to stars in the bulge by starburst. We adopt for SCDM according to the numerical simulations (Barnes, 1996). Since early formation of the cluster prevent galaxy mergers in OCDM, we use for OCDM in order to reproduce the observed E+S0 fraction roughly (see §3).
| Model | (km/s) | |
|---|---|---|
| A | 280 | 2 |
| B | 140 | 2 |
| C | 200 | 5.5 |
Chemical evolution is treated in almost the same way as described in Kauffmann & Charlot (1998). The instantaneous recycling approximation is adopted. The amount of metals ejected from supernovae is characterized by , which is heavy element yield for each generation of stars. The fraction of the ejecta is ejected directly into the hot gas, and the rest is incorporated with the cold gas. We adopt and , which are the same values as the strong feedback model in Kauffmann & Charlot (1999). The gas fraction returned by evolved stars, , is 0.25 in this paper. Simultaneously, the supernovae heat up the surrounding cold gas, then metals contained in the cold gas are also returned to the hot gas. The chemical evolution mainly affects on the colors of the galaxies. Therefore, the value of the yield is not important in this paper. The colors of the cluster galaxies will be discussed in our next paper.
In order to compare our results with observations directly, stellar population synthesis model must be considered. We use the model by Kodama & Arimoto (1997) with the Salpeter’s IMF having a slope of 1.35 and mass range between and . The range of stellar metallicity of simple stellar populations is . The luminosity of disks and bulges is given by this model in each band according to the metalicities and ages of stars.

2.3 Identification of morphology
Morphology of each galaxy is determined by the -band bulge-to-disk luminosity ratio(). In this paper, galaxies with are identified as ellipticals, as S0s, and as spirals, according to the results of Simien & de Vaucouleurs (1986). It has been shown that this method for classification reproduces observations well by Kauffmann et al. (1993) and Baugh et al. (1996).
2.4 Parameter Sets
The feedback is key process which determines the feature of galaxies (e.g. Kauffmann & Charlot 1998). Therefore, we use three type of feedback models in this paper (Table LABEL:model). The model A is a strong feedback model and B is a normal feedback model. In these two models is set to 2. In the model C, we adopt which is used in the fiducial model of Cole et al. (1994), while is equal to 200 km s-1 that is large compared to them.
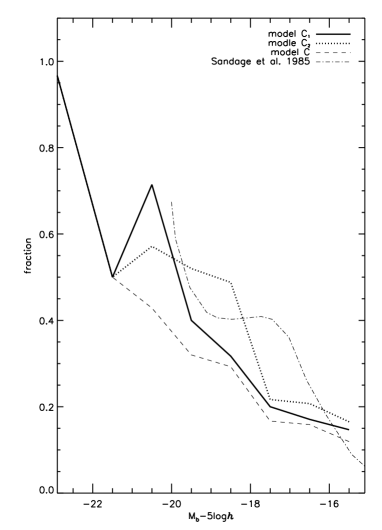
In Fig. 1, we show the -band luminosity functions of model galaxies. The thick solid, dotted, and dashed lines indicate the luminosity functions given by the models A, B, and C, respectively, and the thin dot-dashed line indicates the observed luminosity function of the Virgo cluster (Sandage et al., 1985). The model C reproduces the observed luminosity function well by flattening the faint-end slope of the luminosity function. This is caused by strong feedback to galaxies with low circular velocities compared to the models A and B due to .

3 Morphology of the Cluster Galaxies
3.1 Morphological Fraction
In Fig. 2, the E+S0 fractions of our cluster galaxies are shown as a function of absolute B-band magnitude. The observed curve for the Virgo cluster galaxies is taken from Sandage et al. (1985). All our models show the observational trend. It is, thus, found that the merger-induced bulge formation naturally increases the fraction of bulge-dominated galaxies toward a bright end. In the model C, the clusters do not have early type galaxies sufficiently. This is probably caused by the lack of S0 galaxies as we show below.
3.2 Morphology-Density Relation
The MDRs for the simulated clusters are represented in Fig. 3 using the same luminosity cutoff and definition of the local projected density as Dressler (1980), i.e. the local projected density is defined by nearest 10 neighbours having the luminostiy . The projected density is calculated in –, –, and – projections for each model. The morphological fractions of our models and Dressler’s (1980) are represented by thick and thin lines, respectively. We attach the 1 error bars to the elliptical fractions according to the number of the galaxies in each density bin.
In all models, the E fractions increase toward the high-density regions, and this is consistent with the observed trend. The S0 fractions, however, are much smaller than the observed fraction and do not represent the observed trend of the moderate increase toward the high-density regions. We then examine whether such deficiency of S0 galaxies within the simulated clusters can be solved by adjusting the and the classification in the next subsection.

3.3 Dependence on Model Parameters
Since there is considerable scatter in the relationship between the bulge-to-disk ratio and Hubble T-type (Baugh et al. 1996), we should examine the case in which we adopt different values of for the classification of the galaxies. We also investigate how the parameter, , affects on the MDRs.

To study the influence of the choice of these parameters, we use the model C in OCDM. By this model, the luminosity function and the distribution of the elliptical galaxies are in good agreement with the observations, the E+S0 fraction, however, is insufficient.
First, we adapt the new classification, that is, galaxies with are identified as ellipticals, as S0s, and as spirals. We call this model the model C1. In Fig. 4, we plot the E+S0 fraction of this model (solid line). The fraction is slightly increased, however, still below the observation. The MDR of this model is presented in Fig. 5. Although the S0 fraction is increased by adopting wider range for S0s, the fraction is too small, especially in the high-density regions. Koopmann & Kenney (1998) indicated that galaxies with low central concentration (i.e. low ), with which they should be classified into spiral galaxies such as Sa galaxies in field environment, were often identified as S0 galaxies due to their low star formation rates. They suggested that misleading classification of the low central-concentration galaxies as S0s might account for a part of domination of S0 galaxies in cluster environment. Our result shows that the distribution of the S0s is not reproduced by the merger-driven bulge formation even when we identify the galaxies with low as S0s.
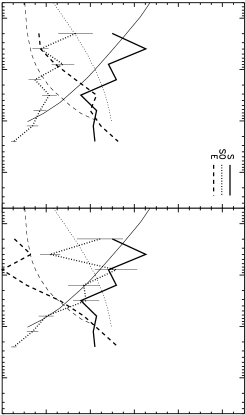
Next, we set to 0.1 in order to increase the E+S0 fraction. Note that this value of is extremely low. Indeed, a merger with the mass ratio of 0.1 should be considered as a minor merger (Walker et al., 1996). We call this model the model C2. The E+S0 fraction of model C2 with the classification in §2.3 is shown in Fig. 4. The fraction is fairly increased than the model C and show better agreement with the observation. In the left panel of the Fig. 6, we show the MDR of this model. It is found that both of E and S0 fraction are increased, the shortage of S0s is, however, still significant. We then examine the case in which we change the threshold value of the between E and S0 in order to increase the S0 fraction. We identify the galaxies with as Es, and then the galaxies with as S0s. The MDR in this case is indicated in the right panel of Fig. 6. The S0 fraction becomes comparable with the observation in the low-density regions, whether it hardly changes in the high-density regions. It means that the galaxies in very high-density regions mainly separate into two types, i.e. bulge dominated and disk dominated galaxies, under the merger hypothesis.
4 DISCUSSION
In this paper, we represent a new method that combines high-resolution -body simulations with a semi-analytic galaxy formation model for cluster galaxies. The high-resolution simulations enable us to identify and trace galactic halos within clusters directly. Therefore, we can obtain the three-dimensional distribution of the cluster galaxies and also we can incorporate the dynamical processes, for example merging and tidal stripping of the galactic halos in the clusters, into our modeling of galaxy formation. For the first study of the cluster galaxies using this method, we have shown the MDRs for the simulated clusters of galaxies with two cosmological models based on the merger-driven bulge formation scenario.
The model which reproduce the observed luminosity function well (model C) is successful in explaining the observed elliptical fraction as a function of the local density. However, any models cannot reproduce the observed trend in the distribution of the cluster S0s. In all models, the S0 fractions are too small, especially in the high density regions.
We also examine the case in which the S0 galaxies in the cluster environment have the different range from the S0 galaxies in the field, because Koopmann & Kenney (1998) found that the galaxies with low central concentration, which should be identified as spiral galaxies in the field, were often classified into the S0 type in clusters. We have confirmed that the S0 fraction are increased only in the low density regions even if we adopt lower threshold value of between S and S0.
We then investigate how the parameter, , affects on the MDR. When we choose smaller , the early-type fraction is increased. In this case, however, the elliptical fraction is mainly increased, the shortage of S0s is then still significant. Even if we classify the low ellipticals as S0s in the model with small , this change increases the S0 fraction only in the low density regions again.
Above results imply that, under the merger-driven bulge formation model, the galaxies separate into two types, i.e. almost pure bulge and pure disk systems, in the high density regions independent on the choice of the parameters and cosmologies.
The reason is probably considered as follows. In the model adopted here, a S0 galaxy is only formed by the disk formation after the last major merger. The efficiency of merging is, however, high before cluster formation, and then it rapidly decreases due to the large internal velocity dispersions of the clusters and the reduction of the size of tidally truncated halos as the mass of clusters grows. The accretion onto the galactic halos is also prevented by the strong tidal field after beginning of the cluster formation (Okamoto & Habe, 1999). Hence, the cluster ellipticals formed by the mergers at high redshifts hardly change their morphologies into S0s by minor mergers or gas accretion, which form additional stellar disks.
Our results suggest that the merger hypothesis can give a good explanation of the distribution of cluster ellipticals. On the other hand, to reproduce the observed S0 fraction, the environmental effects that change the morphology of spiral galaxies into S0 galaxies directly should be considered, for example the ram-pressure stripping (Gunn & Gott, 1972; Fujita & Nagashima, 1999), the galaxy harassment (Moore et al. 1996, 1998), and the minor mergers (Walker et al., 1996).
The morphological classification based on is the simplest way. There are various ways of classification other than the classification. For instance, Caon & Einasto (1995) found another type of morphological segregation of early-type galaxies in the Virgo cluster, based on the configurations of their isophotes. Comparing local projected densities, galaxies with boxy isophotes are located in local density enhancements, while galaxies with disky isophotes lie in regions of lower local densities, independently of their classification as elliptical or lenticular. Although, it is interesting to investigate what physical processes are responsible for this segregation, more numerical studies are needed to include such morphological classification in our model because we need to understand the dynamical states of the internal structures of galaxies to modeling it, and it is then left for further studies.
In the next paper, we will investigate whole properties of cluster galaxies in detail, i.e. colors, metalicities, velocities, and so on, using the method presented in this paper. We will also discuss some environmental effects.
References
- Barnes (1996) Barnes, J. E.1996, in ASP Conference Series 92, Formation of the Galactic Halo—Inside and Out, ed. H. L. Morrison & A. Salajedini (San Francisco: ASP), 415
- Baugh et al. (1996) Baugh, C. M., Cole, S., & Frenk, C. S. 1996, MNRAS, 283, 1361
- Binney & Tremaine (1987) Binney, J., & Tremaine, S. 1987, Galactic Dynamics, (Princeton: Princeton Univ. Press)
- Benson et al. (2000) Benson, A. J., Cole, S., Frenk, C. S., Baugh, C. M., & Lacey, C. G. 2000, MNRAS, 311, 793
- Bond et al. (1991) Bond, J. R., Cole, S., Efstathiou, G., & Kaiser, N. 1991, ApJ, 379, 440
- Bower (1991) Bower, R. G. 1991, MNRAS, 248, 332
- Caon & Einasto (1995) Caon, N., & Einasto, M. 1995, MNRAS, 273, 913
- Cole et al. (1994) Cole, S., Aragón-Salamanca, A., Frenk, C. S., Navarro, J. F., & Zepf, S. E. 1994, MNRAS, 271, 781
- Couch et al. (1994) Couch, W. J., Ellis R. S., Sharples, R. M., & Smail, I. 1994, ApJ, 430, 121
- Dressler (1980) Dressler A. 1980, ApJ, 236, 351
- Dressler et al. (1997) Dressler A. et al. 1997, ApJ, 490, 577
- Evrard et al. (1994) Evrard, A. E., Summers, F. J., & Davis, M. 1994, ApJ, 422, 11
- Fujita & Nagashima (1999) Fujita, Y., & Nagashima, M., 1999, ApJ, 516, 619
- Gunn & Gott (1972) Gunn, J. E., & Gott, J. R. 1972, ApJ, 176, 1
- Katz et al. (1992) Katz, N., Hernquist, L., & Weinberg, D. H. 1992, ApJ, 399, L109
- Kauffmann (1996) Kauffmann, G. 1996, MNRAS, 281, 487
- Kauffmann & Charlot (1998) Kauffmann, G., & Charlot, S. 1998, MNRAS, 294, 705
- Kauffmann et al. (1999) Kauffmann, G., Colberg, J. M., Diaferio, A., & White, S. D. M. 1999, MNRAS, 397, 529
- Kauffmann et al. (1993) Kauffmann, G., White, S. D. M., & Guiderdoni, B. 1993, MNRAS, 264, 201
- Kodama & Arimoto (1997) Kodama, T., & Arimoto, N. 1997, A&A, 320, 41
- Koopmann & Kenney (1998) Koopmann, R. A., & Kenney, J. D. P. 1998, ApJ, 497, L75
- Lacey & Cole (1993) Lacey, C., & Cole, S. 1993, MNRAS, 262, 627
- Moore et al. (1996) Moore, B., Katz, N., Lake, G., Dressler, A., & Oemler, A., 1996, Nature, 379, 613
- Moore et al. (1998) Moore, G., Lake, G., & Katz, N. 1998, ApJ, 495, 139
- Okamoto & Habe (1999) Okamoto, T., & Habe, A. 1999, ApJ, 516, 591
- Okamoto & Habe (2000) Okamoto, T., & Habe, A. 2000, PASJ, 52, 457
- Press & Schechter (1972) Press, W. H., & Schechter, P. L. 1974, ApJ, 187, 425
- Roukema et al. (1997) Roukema, B. F., Peterson, B. A., Quinn, P. J., & Rocca-Volmerrange, B. 1997, MNRAS, 292, 835
- Salpeter (1955) Salpeter, E. E. 1955, ApJ, 121, 161
- Sandage et al. (1985) Sandage, A., Binggeli, B., & Tammann, G. A. 1985, AJ, 90, 1759
- (31) Simien, F., & de Vaucouleurs, G. 1986, ApJ, 302, 564.
- Somerville & Primack (1999) Somerville, R. S., & Primack, J. R. 1999, MNRAS, 310, 1087
- Summers et al. (1995) Summers, F. J., Davis, M., & Evrard, A. 1995, ApJ, 454, 1
- Sutherland & Dopita (1993) Sutherland, R., & Dopita, M. A. 1993, ApJS, 88, 253
- Toomre (1977) Toomre, A., 1977, in The Evolution of Galaxies and Stellar Populations, ed. B. M. Tinsley & R. B. Larson (New Haven: Yale Univ. Press), 401
- Walker et al. (1996) Walker, I. R., Mihos, J. C., & Hernquist, L. 1996, ApJ, 460, 121