Creating Spectral Templates from Multicolor Redshift Surveys11affiliation: Based on observations with the NASA/ESA Hubble Space Telescope, obtained at the Space Telescope Science Institute, which is operated by the Association of Universities for Research in Astronomy, Inc., under NASA contract NAS5-26555.
Abstract
Understanding how the physical properties of galaxies (e.g. their spectral type or age) evolve as a function of redshift relies on having an accurate representation of galaxy spectral energy distributions. While it has been known for some time that galaxy spectra can be reconstructed from a handful of orthogonal basis templates, the underlying basis is poorly constrained. The limiting factor has been the lack of large samples of galaxies (covering a wide range in spectral type) with high signal-to-noise spectrophotometric observations. To alleviate this problem we introduce here a new technique for reconstructing galaxy spectral energy distributions directly from samples of galaxies with broadband photometric data and spectroscopic redshifts. Exploiting the statistical approach of the Karhunen-Loève expansion, our iterative training procedure increasingly improves the eigenbasis, so that it provides better agreement with the photometry. We demonstrate the utility of this approach by applying these improved spectral energy distributions to the estimation of photometric redshifts for the HDF sample of galaxies. We find that in a small number of iterations the dispersion in the photometric redshifts estimator (a comparison between predicted and measured redshifts) can decrease by up to a factor of 2.
1 Introduction
With the introduction of large-format CCDs, the study of galaxy evolution is undergoing a renaissance. Statistically significant volumes of the Universe can now be surveyed at high and low redshift with relatively small amounts of observing time. In fact the rate at which we can undertake deep, multicolor photometric surveys is now over 2 orders of magnitude larger than the rate at which we can followup these observations spectroscopically. As an example, the Sloan Digital Sky Survey will spend 85% of its five year mission measuring the redshifts of one million objects with a unique, multi-fiber spectrograph, while in the remaining 15% of the time it will gather 5 color photometry for 100 million objects.
This rapid growth in multicolor surveys has led to the development of techniques for exploiting the information contained within the photometric data themselves (without relying on followup spectroscopy). One of the most successful of these techniques has been the estimation of galaxy redshifts directly from multicolor data (photometric redshifts) (Baum, 1962). (For an overview of recent work in this field, see Weymann et al. (1999).) These techniques can be broken down into two basic classes. One class of methods use a training set of galaxies with known photometry and spectroscopic redshifts to derive an empirical relation between the colors of galaxies and their redshifts (Connolly et al., 1995a; Wang, Bahcall & Turner, 1998). After calibration, the redshift estimator can predict redshifts for objects with only photometric observations. The advantage of this method lies in its empirical nature; all the effects of dust and galaxy evolution that are present in the training set are implicit within the derived correlation. The drawback is that it can only robustly predict redshifts for objects that are similar to those in the original training set. In other words the estimator is good for interpolation, but not for extrapolation to galaxies that have redshifts or spectral types far from the range covered by the training set.
The second class of techniques, template based photometric redshift estimators (or spectral energy distribution fitting), use model or empirical galaxy spectral energy distributions (Koo, 1985; Connolly et al., 1995b; Gwyn & Hartwick, 1996; Fernández-Soto et al., 1999; Benítez, 1999). By minimizing the difference between the observed and synthetic colors one can find the most likely type and redshift of the galaxy. This method is simple to implement, does not require a training set, and has no extrapolation problems. Its main limitation is that the underlying spectral energy distributions (SEDs) of galaxies within the sample must be well known. Comparisons of the colors of galaxies with spectral synthesis models (Bruzual & Charlot, 1993) have shown that the modeling of the ultraviolet spectral interval for galaxies is uncertain. Whether this is due to uncertainties in the modeling of the stars or due to the effects of dust is as yet unclear. Consequently, photometric-redshift estimates are most accurate when we apply empirical spectral energy distributions derived from observations of local galaxies, e.g. Sawicki et al. (1997). These empirical relations are, however, constructed from a small number of local galaxies that have been observed in detail and there is no guarantee that they represent the full distribution of galaxy types (particularly when we include the effects of evolution with redshift).
In this paper we derive a method that combines the advantages of the above techniques without their drawbacks. We use a training set, not for deriving a direct relationship between colors and redshifts but instead to build an optimal set of spectral templates. We optimize for the shape of the spectral templates to give the best match between the predicted galaxy colors (calculated using the spectroscopic redshifts) and the observed colors. As a result we derive a set of spectral templates that are a better match to the SEDs of the galaxies in the training set than the initial model/empirical templates. Our tests show that these improved templates give a tighter photometric redshift relation than do the original SEDs.
In section 2 we revisit different photometric redshift estimator techniques and we address the question of how to recover information beyond just redshift from photometric observations and how to interpret these results. We introduce an interpolation scheme for optimal spectral type determination. In section 3 we describe our novel technique for creating eigenspectra in an iterative way, and in section 4 we show a test application to the HDF-N/NICMOS catalog, where there are around 150 spectroscopic redshifts available. We present the comparison of photometric redshift estimates based on the most commonly used Coleman, Wu & Weedman (1980) spectra (hereafter CWW) and our empirically developed templates.
2 Photometric redshifts
Estimating the redshift of a galaxy from broadband photometry relies on a comparison between the colors of the galaxy and those predicted from either a set of spectral energy distributions (SEDs) or an empirically derived relation between color and redshift. The accuracy of the resulting relation relies critically on having a well calibrated relation (e.g. the spectral templates must cover the full range of galaxy types). In this paper we describe a new technique for developing a set of spectral templates that are optimized to the data in hand. Initially, we outline a variant on the standard template fitting technique that uses an orthogonal basis to compactly describe the broad range of galaxy spectral types.
2.1 Data
Unique photometric measurements in four bands (U300, B450, V606, I814) have been available from the Hubble Space Telescope’s Wide Field Planetary Camera 2 (WFPC2) since 1996, when a slice of the very distant Universe became visible in the Hubble Deep Field (HDF-N)(Williams et al., 1996). This data set has been the testbed of photometric redshift estimators from the beginning. Recently the HDF-N field gained two more high signal-to-noise infrared bands (J110, H160) when the Near Infrared Camera and Multi Object Spectrometer (NICMOS) targeted the same area (Dickinson et al., 2000). The joint photometric catalog of the observations was extracted by the SExtractor package (Bertin & Arnouts, 1996) using a weighted sum of the J and H NICMOS images for object detection. In the larger view of the NICMOS instrument, 1681 objects were detected, and out of these, 1291 objects were extracted with complete photometric information in all six bands. In addition to the HST data, we have used –band photometry derived from images taken at the KPNO 4m telescope (Dickinson, 1998). We have used a method similar to that of Fernández-Soto et al. (1999) for reliably extracting fluxes and errors for every object detected in the NICMOS+WFPC2 images (Papovich et al., 2000). This ensures photometric completeness at and eliminates uncertainties concerning aperture corrections between the HST and ground–based data sets. Detection in both optical and infrared enables photometric redshift estimators to identify very high redshift objects out to about , because of the continuum blanketing from Lyman- forest (Madau, 1995).
The number of spectroscopic redshifts in HDF-N/NICMOS field is also very promising for various astrophysical projects. Currently there are about 150 spectroscopic redshifts available for the central HDF (Cohen et al., 1996; Steidel et al., 1996; Lowenthal et al., 1997; Dickinson, 1998; Hogg et al., 1998; Weymann et al., 1998; Spinrad et al., 1998; Stern & Spinrad, 1999). These spectroscopic measurements can be used as a training set in empirical photometric redshift estimations or as a test of the accuracy and reliability of template fitting algorithms.
2.2 Using eigenspectra
Traditional SED fitting methods provide a simple mechanism for estimating the redshift and spectral type (or metallicity, age etc) of a galaxy. One can compare the measured and the template based colors as a function of redshift and select the redshift and the template where the match is the best. The limitation of this method is that it does not allow a true estimate of the uncertainties on these measures of age etc., nor does it facilitate the propagation of these errors to subsequent analyses of the galaxy distributions. The reason for this is that the multidimensional space of parameters that describe a galaxy are only sampled over a few discrete points (i.e. the number of template spectra).
Instead of using a discrete set of SED templates one can create from them a continuous manifold. We can imagine SED templates as vectors in a multi-dimensional vector space; the dimension of this space () is the number of the wavelength bins of the SEDs. With an orthogonal basis within this vector space one can expand any SED, , in terms of this basis,
| (1) |
where is the th basis spectrum and are the linear expansion coefficients.
One ends up with coefficients to define a SED instead of a single discrete spectral type parameter that selects the template in the traditional way. In practice, the SEDs do not have arbitrary shapes: they occupy only a small a subspace of the possible -dimensional vector space. With the help of the the Karhunen-Loève (KL hereafter) transformation (Karhunen, 1947; Loève, 1948; Connolly et al., 1995b; Csabai et al., 2000), a variant of the principal component analysis, we can systematically define a small number of basis vectors (), which can reproduce all real spectra to a high (and quantifiable) degree of accuracy. Using only eigentemplates the approximated spectrum can be expressed in the form of
| (2) |
where the value of is typically to . We call this an eigenbasis, and its vectors are the eigenspectra. In this way the number of free parameters for which we have to optimize remains small, but we have the freedom of having a continuous distribution of template spectra. Photometric redshift estimation follows the same approach of comparing the derived and actual colors but the coefficients of the eigenspectra are saved as well as the redshift.
Truncating the original basis introduces an uncertainty as a function of wavelength into the linear combination (see equation 2), which can expressed in terms of the remaining eigenspectra as
| (3) |
where is the eigenvalue of the th eigenspectra.
Traditionally the eigentemplates are derived from empirical (Coleman, Wu & Weedman, 1980; Kinney et al., 1996) or synthetic (Bruzual & Charlot, 1993) spectra. Unfortunately both methods have limitations when it comes to applications to real data. Empirical spectra are typically derived from observations of a small number of local galaxies. The derived basis may not, therefore, be tenable for high redshift galaxies. A second problem is that the there is only a small range in wavelength where good signal-to-noise data can be obtained; e.g. UV observations or IR spectrophotometry of local galaxies are extremely limited. In contrast, synthetic spectra are available over a wide wavelength range and can be derived for galaxies with a wide variety of ages and past star formation histories, yet many previous studies, e.g. Sawicki et al. (1997); Yee (1998); Benítez (1999), have found that they do not yield photometric redshift estimates as reliable as those derived from empirical templates. Reliable templates could greatly enhance the range where photometric redshift estimation techniques can be applied with acceptable errors.
The eigenbasis approach is more sophisticated in several ways than the traditional discrete template fitting version. As described previously, a small number of continuous parameters are used to determine the rest-frame spectrum, allowing proper error propagation. These parameters are the linear coefficients of the eigenspectra and their combination can be related not only to a single spectral type parameter (as in the traditional version) but also, in principle, to other physical parameters such as reddening, age of the galaxy etc.
While there remains no standard mechanism for defining the spectral type of a galaxy from the eigentemplates, it has been shown that two or three eigentemplates can yield reasonably accurate approximations to most normal galaxy spectra (Connolly et al., 1995b). Both the luminosity of a galaxy and its spectral type are encoded within these coefficients. In this study we use three eigenspectra. Extracting the apparent luminosity from the linear coefficients is straight forward (e.g. the length of the coefficient vector). The normalized Cartesian coordinates can then be converted to a polar system where the spectral type is defined by two mixing angles. The solid line in figure 1 shows these mixing angles as defined from the CWW spectral energy distributions. The galaxy spectral types are found to lie on a one parameter sequence within this two dimensional space.
The points in figure 1 show the mixing angles as defined from the HDF-N WFPC2 and NICMOS data. The ellipses are indicative of the errors associated with the derived mixing angles. Many of the galaxies within the HDF-N data set are seen to follow the locus defined by the CWW templates. There are however a number of outlier data points (with correspondingly large error ellipses). These outliers are typically high redshift objects with reasonably accurate predicted redshifts but with poorly estimated spectra. What happened? The rest-frame spectrum of a high redshift object is only sampled at short wavelengths, thus the cost function in the optimization measuring the deviation of the actual and template based colors is not sensitive to the longer wavelength end. In other words the cost function is “flat” in the expansion coefficient subspace, so tiny deviations drive the resulting spectral type, while the cost vs. redshift has a normal minimum. This observation enables us to introduce a method to avoid negative spectra, while also reducing the number of fitted parameters.
2.3 Optimal subspace filtering
We propose a physical interpolation scheme to resolve the type degeneracy of high redshift objects and to insure plausible spectra for any galaxy. We derive a one-dimensional type parameter. As a starting point we use the empirical CWW spectra, extrapolated in the ultraviolet and infrared using empirical templates from Kinney et al. (1996) and models from Bruzual & Charlot (1993), respectively, and with the addition of a model SED (Bruzual & Charlot, 1993) representing a very blue star forming galaxy. We then use these to derive our initial eigenbasis, truncated to a 3-dimensional subspace. The KL expansion of a spectrum on this eigenbasis gives coefficients that represent a galaxy spectrum. We found that the normalized coefficients of the CWW spectra are in a region close to a small circle on the unit sphere. This region defines a one-dimensional sequence, that can be mapped to the interval, where the value roughly corresponds to “Ellipticals” and represents the bluest galaxies. Deriving the above type parameter consists of the following steps. In the 3D coefficient space, fitting a plane to the normalized coefficient vectors computed for the reference (CWW) spectra gives the equation of a cone, which can be parameterized with one variable. This periodic variable is restricted to the physically sensible interval where the non-negative spectra are. Choosing “0” for the best fit ellipticals and “1” for the bluest galaxies yields an easy interpretation of the estimated type.
Exploiting the above definition of a scalar type parameter, we develop an improved redshift and type estimator (Connolly et al., 1999). In this application there are three continuous fitting parameters: redshift, type and luminosity. In figure 1 open circles represent the mixing angles of the CWW spectra and the solid line shows the projected trajectory from one CWW type to the next. The points in figure 1 show the mixing angles for the HDF sample and the ellipses illustrate the corresponding errors on the derived angles. The type and redshift errors are computed from the shape of the cost function around the minimum, and the formal covariance matrix is obtained from the coefficients of a fitted paraboloid. Looking at figure 1, one can see that the error ellipses on the mixing angles are larger as we move farther from the CWW locus and that the position angles of these error ellipses point in a direction that is almost orthogonal to the CWW curve.
The effect of the optimal subspace filtering is to force the mixing angles to reside on the CWW trajectory. In figure 1 thin lines connect sample objects with error ellipses to the corresponding constrained mixing angles lying on the CWW locus. This physically motivated model—smoothly interpolating between the CWW SEDs—provides sensible spectral types for higher redshift galaxies by suppressing the effect of noise on the derived expansion coefficients. Simply using only the discrete set of four CWW templates would clearly result in unrealistic estimated types for most of the galaxies, eventuating false photometric redshifts.
3 Template reconstruction algorithm
We have seen previously that a small number of basis spectra can be used to approximate any spectrum reasonably well. The limitation at this point is the quality of the libraries that the eigentemplates are built from. In order to improve the accuracy of the photometric redshifts and spectral typing we need to build better eigenspectra. The first step was Csabai et al. (2000) using a direct technique to optimize for the shape of the eigenspectra simultaneously with the coefficients. Here we follow a different statistical approach allowing a higher wavelength resolution even for the currently available small data sets (Budavári et al., 1999).
3.1 The idea: spectra from broadband photometry
How can we obtain spectra from broadband photometry? We observe galaxies at different redshifts, which means the filters sample the rest-frame light at different wavelengths. If we have large multicolor redshift surveys, then the wavelength regions sampled by the filters (in the rest-frame) overlap. Figure 2 illustrates how the HDF/NICMOS photometric bands (projected back to the rest-frame) overlap for a set of spectroscopic redshifts taken from the catalog. Looking at a particular wavelength, we can actually see which bands set up constraints on the value of the eigenspectra. This oversampling of the eigenspectra allows us to develop applications to extract higher resolution information. Developing such a reconstruction process is not trivial, though. Several problems emerge because of the non-uniform redshift distribution and the photometric uncertainties within the data. Obviously none of the standard de-convolution applications can be used to solve the problem. We have, therefore, developed an iterative procedure for correcting eigenspectra, which repairs the eigenspectra only where sufficient information exists and where the magnitude of the modification is determined statistically.
Our iterative procedure starts from an initial set of eigentemplates and creates increasingly better eigenbases by improving the match between the measured colors and those derived from the templates. The algorithm is quite simple. Given a catalog of galaxies with broadband photometry and spectroscopic redshifts, we first expand each galaxy over our initial set of templates, transformed to the galaxy’s redshift, by solving for the linear expansion coefficients.
If the initial templates do not accurately reproduce the ensemble of galaxies the spectrum of every galaxy will have systematic errors due to the choice of templates. This corresponds to a subspace in the space of all possible spectra. A better representation of the photometry may require moving out of this subspace. We can achieve this by an iterative repair of the estimated spectrum of each galaxy, by considering what is the minimal change in its shape that would improve the photometry. We compute this “repair” by minimizing a cost-function over the shape of the spectrum, penalizing both large deviations from the photometry and from the template expansion. Since the template expansion was already an optimal representation given the subspace defined by the templates, this repair enables the spectra to move out of the original subspace.
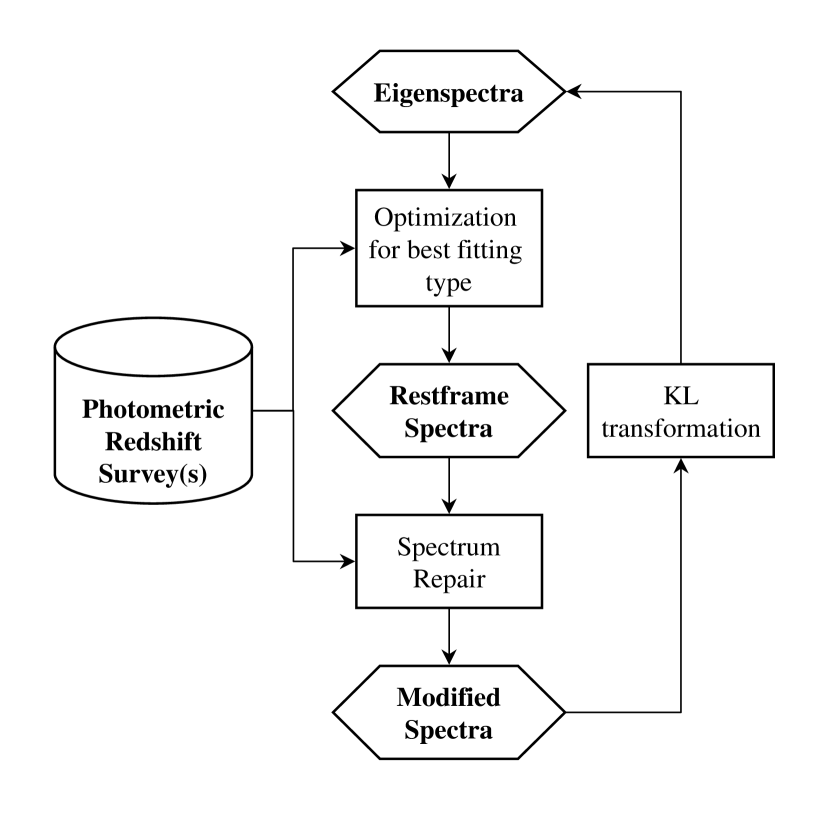
Building a new eigenbasis over the set of repaired spectra will allow changes on the templates which improve the fit population-wide, but reject individual fluctuations. Performing this process multiple times in an iterative fashion (Everson & Sirovich, 1995), the overall fit to the photometry improves substantially. The flowchart of the algorithm is shown in figure 3.
3.2 Repairing spectra
The key step to the template reconstruction algorithm is the spectrum repairing method. The spectrum we are about to repair is an approximation of the real spectrum based on the photometric data. This best fitting spectrum can be found within the subspace spanned by the current eigenspectra by varying the coefficients directly. To obtain a physically sensible spectrum the optimal subspace filtering method (see section 2.3) should be used. Having a set of eigentemplates and the calculated best fitting type the corresponding rest-frame spectrum of a galaxy can be easily computed. The best fitting type is calculated by minimizing the cost function,
| (4) |
where , are the measured flux and error in the th passband. In fact, the type parameter determines the values of the coefficients of the eigenspectra and the linear combination gives the best fitting spectrum. Using number of eigentemplates the approximated spectrum can be expressed in the form of
| (5) |
where is the th eigenspectrum and are the linear coefficients defined by the type and the brightness.
The basic idea is to modify this spectrum to match the observed colors better. This is another minimization problem, where we try to adjust the spectrum based on a cost function built up by two different terms. On one hand, we have the deviation of the actual photometry from the fluxes computed from the spectrum itself, . On the other hand we have the deviation of the spectrum from the template expansion . The repair process has to be able to deal properly with different types of errors such as the photometric errors and the uncertainties within the eigenspectra.
Let represent the response function of the th filter, normalized and corrected for the detector and telescope throughput function. The derived flux in the th passband can be written as an integral or approximated with the sum over the discrete representation of the functions.
| (6) |
where and are the discrete representation of the spectrum and the filter and refers to a certain wavelength, . The discrete version of is given by the linear combination of and , the new representation of the th eigenspectrum .
The discrete problem translates into a multidimensional minimization of the cost function as a function of the unknown spectral shape .
| (7) |
where describes the ability of the eigenspectra to be changed at a certain wavelength. The primary source of error in the expansion is the truncation error due to the restricted subspace; see equation 3 and its discrete form,
| (8) |
The cost function of the problem can be transformed into a simpler form by introducing the difference spectrum () and some constant terms ().
| (9) | |||||
| (10) |
| (11) |
The cost function is quadratic in its variables, . The minimum can be analytically derived, since the partial derivatives vanish at the minimum. This yields a system of linear equations, which can be solved for .
| (12) |
where
| (13) |
and is the usual Kronecker symbol. The repaired spectrum can be computed from the difference vector by simply adding it to the template based spectrum, . A few typical example repaired spectra can be seen in figure 4 for objects with different spectral type parameters. The steps we take are small because the role of these tiny deviations from the template based spectra is to point the eigenspectra into the right direction in a statistical sense.
Once the spectrum repairing procedure is applied to each galaxy in the training catalog, the Karhunen-Loève transformation can be applied to obtain a new set of eigenspectra. Repeating the above steps yields a statistically robust training algorithm to develop empirical eigenspectra from photometry. If there were no modifications to the linear combinations of the eigenspectra then we would get exactly the same spectrum subspace at the end. Simply adding some uncorrelated noise to the spectra would retain the subspace as well. Corrections in the eigenspectra can only occur due to changes correlated with galaxy type.
4 Application to the HDF/NICMOS data
4.1 Building the templates
Our algorithm is constructed in such a way that the iteration can be initialized with any eigentemplates and started from imported spectra. In our study for deriving the initial set of eigentemplates we used the extended CWW spectra, which emerged as the most commonly used set of templates by several other groups.
The actual implementation was somewhat different. Logarithmically resampled templates were used in order to speed up the computation, since a logarithmically rebinned spectrum can be redshifted by simply offsetting the indices of the vectors. The result of this is that the integral measure changes, which requires some trivial modifications in the above equations. Having more bins in the blue than the red ranges (up to 25000Å) allows higher resolution in the optical bands.
Repairing the eigentemplates improved the rest-frame colors rapidly. Global features changed significantly over the initial iterations. After just a few steps changes to the continuum of the eigenspectra converge. Figure 5 illustrates the continuum changes of the basis after just two iterations. Subsequent iterations change the higher frequency components within the eigenspectra. Figure 6 and table 1 containing the actual numeric values of the estimates help us to understand the effects of these iterations on the estimated spectra. Changes in the eigenbasis result in a new fit, the expansion coefficients differ and thus the actual estimated SEDs can differ substantially more than one might expect from figure 5. Consistent with our expectations about the uncertainties present within the empirical SEDs, most modifications occur in the ultraviolet and the infra red, where the initial templates are poorly constrained. The bluest starburst SEDs tend to be changed least.
Each iteration requires approximately 2 minutes on a workstation with the CPU time scaling linearly with the number of objects (as most of the time was spent in the spectrum correction phase solving the linear equations for the modified spectrum). The KL expansion took an insignificant amount of time on such a small data set. However, even the principal component analysis can be done iteratively, which enables us to apply this technique to much bigger surveys, such as the Sloan Digital Sky Survey. Our training algorithm is applicable to data sets composed of catalogs in different photometric systems. Theoretically there is nothing to prevent us from including all observed galaxies which have photometry and redshifts available.
The stability of our technique had been tested with randomly chosen subsets of the entire training set. The iterated eigenbases were compared to the original and the difference of their projections onto the same subspace has been analyzed. Calculating the mean and its standard deviation of thirty resulting templates in all the wavelength bins shows us that these changes are significant. Figure 7 show the mean difference of the resulting and CWW eigentemplates with solid lines and the scatter with dotted lines. The first eigencomponent changes less but it is the most significant.
4.2 Applying to photometric redshifts
In our analysis the spectroscopic redshifts have only been used to shift the templates to a common rest-frame for the training set. The template repairing algorithm does not yield photometric redshifts nor is it directly related to the estimation at all. It reconstructs the (continuum) rest-frame shape of galaxy SEDs. These eigenspectra can be utilized in many different ways; to use them as templates in photometric redshift estimation is just one possibility.
Figure 8 shows how the redshift prediction improves as the eigenspectra evolve. The estimates are approaching the ideal line as the SEDs converge to the best possible representation of reality. Figure 8 is a comparison of the photometric redshift prediction based on the resulting KL (bottom) and CWW (top) eigentemplates. The systematic errors disappear and the scatter reduces. Beyond the standard root mean square error () the relative deviation of was also computed () for comparison with estimates found by other authors.
| (14) |
| (15) |
Table 2 compares the overall redshift errors computed for both the CWW and the trained (KL) eigenspectra. It shows significant improvements on any redshift range. The final KL eigenbasis gains about a factor of two in the average regardless of which statistics are preferred. The rms error changes from 0.23 to 0.12 for estimates up to redshift of 6.
An important feature of this approach is the rather rigorous handling of error propagation. The available photometric errors were incorporated in both the template repair and photometric redshift estimation routines. The photometric inversion should predict not only the physical parameters but also their errors (that are usually correlated). Since it is hard to find the global minimum of a function in more dimensions, we evaluate the cost function on a grid to speed up the processing and to ensure the optimization does not end up in a local minimum. Searching the grid on the type-redshift plane provides a good estimate of the global minimum, however the results can be revised using the continuous cost function again. Fitting a second order surface around the minimum allows us to refine the estimation by choosing the fitted minimum and to compute the formal covariance matrix from the coefficients of the fitting formula. Figure 9 shows the correlated type and redshift errors for the training set. Consistent with expectations, most of the ellipses show that higher redshifts than those estimated are possible if we choose an incorrect (bluer) template. This illustrates the need to fully and finely sample the distribution of template spectra. The bluer SEDs also tend to have larger errors on the type and redshift than the ellipticals due to the less significant continuum features in their spectra.
5 Discussion
Our technique has been shown to be able to derive rest-frame templates from photometry in an iterative way, improving step-by-step the correlation of the template based colors to the actual measurements. The statistical approach of the KL expansion provides a robust determination of the systematic changes in the SEDs. After just the initial 2-3 iterations, the overall continuum shapes of the SEDs are adjusted to reproduce the photometry. Higher resolution detailed features emerge in later iterations. Consistent with our expectations, significant continuum changes occur both in the ultraviolet and infrared, where the original templates are poorly constrained. The estimated SEDs based on the trained eigenbases tend to be redder in general. The UV part of the spectra get fainter and the flux increases in the IR for the early type galaxies (which change the most). The blue galaxies have gone through less dramatic modulation. Clearly, the color spread of galaxies is larger than one might anticipate from the CWW spectra.
The limitation on our current application is the relatively small number of objects with accurate multicolor photometry and spectroscopic redshifts in the Hubble Deep Field. Combining several observations into one training set is one way to improve the robustness of our results. Our technique is constructed to be able to deal with many multicolor observations at the same time. Data of various surveys can be incorporated regardless of photometric systems they use, meaning not just broad but also narrow or intermediate band imaging. This flexibility of the algorithm allows us to simply merge data sets coming from several instruments, where the data set up constraints on the SEDs at different wavelengths. With time we will be able to improve other parts of the SEDs. New upcoming instruments will provide high signal-to-noise ratio data in different spectral ranges, e.g. the Galaxy Evolution Explorer (GALEX) probing the far and near ultraviolet (1300-3000Å) or the Space Infrared Telescope Facility (SIRTF) and the Next Generation Space Telescope (NGST) looking at the infrared ranges. In fact, the algorithm is even more generic. Eventually, spectrophotometric observations can be naturally incorporated in the training mechanism.
There remains one class of galaxy for which this technique is not optimal; high redshift galaxies for which we cannot easily obtain spectroscopic redshifts can not be optimized by our procedure (i.e. we lack the relevant training set). As our technique can seamlessly incorporate theoretical and empirical data (weighting the samples appropriately) if we have a reasonable understanding of the stellar populations we can account for missing galaxy populations. Objects of extremely unusual colors will not be well matched by any template fitting procedure but the goodness of fit to these data will enable us to identify these anomalous objects.
In this paper we have presented a new method to reconstruct the rest-frame continuum spectra of galaxies directly from a catalog of broadband multicolor photometric observations and spectroscopic redshifts. In addition to an improved photometric redshift estimation the application of eigenspectra to this problem enables the classification of galaxy spectra to move from a series of discrete (and somewhat ad hoc) classification types to a continuous parameterization. With the help of the optimal subspace filtering, non-physical spectral energy distributions could be avoided. As a result of the repair algorithm, the eigenbasis improved the capability to represent the observed photometric properties. This improvement cannot be tested directly, since we do not know the real, photometrically calibrated spectra for the objects in our training catalog, but the photometric redshift estimation test with the repaired spectra gave substantially better results than the estimation using model/empirical templates ( vs. ). New photometric and spectroscopic surveys will extend the size of the training catalog, making possible to improve further the spectral templates and enrich them with finer details.
References
- Baum (1962) Baum, W.A., 1962, IAU Symposium No. 15, 390
- Benítez (1999) Benítez, N., 1999, ApJ, in press, astro-ph/9811189
- Bertin & Arnouts (1996) Bertin, E. & Arnouts, S., 1996, A&AS, 117, 393
- Budavári et al. (1999) Budavári, T., Szalay, A.S., Connolly, A.J., Csabai, I. & Dickinson, M.E., 1999, in Photometric Redshifts and High Redshift Galaxies, eds. R.J. Weymann, L.J. Storrie–Lombardi, M. Sawicki, & R. Brunner, (San Francisco: ASP), 19
- Brunner et al. (1999) Brunner, R.J., Connolly, A.J., Szalay, A.S., 1999, ApJ, 516, 563
- Bruzual & Charlot (1993) Bruzual, A.G., & Charlot, S., 1993, ApJ, 405, 538
- Cohen et al. (1996) Cohen, J.G., Cowie, L.L., Hogg, D.W., Songaila, A., Blandford, R., Hu, E.M., & Shopbell, P. 1996, ApJ, 471, L5
- Coleman, Wu & Weedman (1980) Coleman, G.D., Wu., C.-C., & Weedman, D.W., 1980, ApJS, 43, 393
- Connolly et al. (1995a) Connolly, A.J., Csabai, I., Szalay, A.S., Koo, D.C., Kron, R.G., & Munn, J.A., 1995a, AJ 110, 2655
- Connolly et al. (1995b) Connolly, A.J., Szalay, A.S., Bershady, M.A., Kinney, A.L., & Calzetti, D., 1995b, AJ, 110, 1071
- Connolly et al. (1999) Connolly, A.J., Budavári, T., Szalay, A.S., Csabai, I., & Brunner, R.J., 1999, in Photometric Redshifts and High Redshift Galaxies, eds. R.J. Weymann, L.J. Storrie–Lombardi, M. Sawicki, & R. Brunner, (San Francisco: ASP), 13
- Csabai et al. (2000) Csabai, I., Connolly, A.J., Szalay, A.S., & Budavári, T., 2000, AJ, 119, 69
- Dickinson (1998) Dickinson, M., 1998, in The Hubble Deep Field, eds. M. Livio, S.M. Fall, & P. Madau (Cambridge Univ. Press), 219
- Dickinson (1999) Dickinson, M., 1999, in After the Dark Ages: When Galaxies Were Young, eds. S. Holt and E. Smith, (AIP: Woodbury NY), 122
- Dickinson et al. (2000) Dickinson, M.E., et al., 2000, in preparation
- Everson & Sirovich (1995) Everson, R., & Sirovich, L., 1995, J. Opt. Soc. Am. A 12, 8
- Fernández-Soto et al. (1999) Fernández-Soto, A., Lanzetta, K.M., & Yahil, A., 1999, ApJ, 513, 34
- Gwyn & Hartwick (1996) Gwyn, S.D.J., & Hartwick, F.D.A., 1996, ApJ, 468, L77
- Hogg et al. (1998) Hogg, D.W, et al., 1998, ApJ, 499, 555
- Karhunen (1947) Karhunen, H., 1947, Ann. Acad. Science Fenn, Ser. A.I. 37
- Kinney et al. (1996) Kinney, A.L, Calzetti, D., Bohlin, R.C., McQuade, K., Storchi-Bergman, T., & Schmitt, H.R., 1996, ApJ, 467, 38
- Koo (1985) Koo, D.C., 1985, AJ, 90, 148
- Loève (1948) Loève, M., 1948, Processus Stochastiques et Mouvement Brownien, Hermann, Paris, France
- Lowenthal et al. (1997) Lowenthal, J.D., et al., 1997, ApJ, 481, 673
- Madau (1995) Madau, P., 1995, ApJ, 441, 18
- Papovich et al. (2000) Papovich, C., et al., 2000, in preparation
- Sawicki et al. (1997) Sawicki, M.J., Lin, H., & Yee, H.K.C, 1997, AJ, 113, 1
- Spinrad et al. (1998) Spinrad, H., Stern, D., Bunker, A., Dey, A., Lanzetta, K.M., Yahil, A., Pascarelle, S., & Fernández–Soto, A. 1998, AJ, 116, 2617
- Steidel et al. (1996) Steidel, C.C., Giavalisco, M., Dickinson, M., & Adelberger, K.L., 1996, AJ, 112, 352
- Stern & Spinrad (1999) Stern, D., & Spinrad, H., 1999, PASP, 111, 1475
- Wang, Bahcall & Turner (1998) Wang, Y., Bahcall, N., & Turner, E.L., 1998, AJ, 116, 2081
- Weymann et al. (1998) Weymann, R.J., Stern, D., Bunker, A., Spinrad, H., Chaffee, F.H., Thompson, R.I., & Storrie–Lombardi, L.J. 1998, ApJ, 505, L95
- Weymann et al. (1999) Weymann, R.J., Storrie–Lombardi, L.J., Sawicki, M., & Brunner, R., (editors), 1999, Photometric Redshifts and High–Redshift Galaxies (San Francisco: ASP)
- Williams et al. (1996) Williams, R.E., et al., 1996, AJ, 112, 1335
- Yee (1998) Yee, H.K.C., 1998, in the proceedings of the Xth Recontres de Blois, astro-ph/9809347
| HDF | NICMOS | CWW | KL[2] | ||||
|---|---|---|---|---|---|---|---|
| Id | Id | ||||||
| 1-34.1 | 605 | 0.485 | 0.66 | 0.16 | 0.50 | 0.05 | |
| 4-173.0 | 1023 | 0.959 | 0.91 | 0.38 | 0.95 | 0.35 | |
| 4-888.0 | 1076 | 1.010 | 0.87 | 0.68 | 0.96 | 0.64 | |
| 2-824.0 | 561 | 2.419 | 2.54 | 0.84 | 2.48 | 0.84 | |
| Redshift | |||||||
|---|---|---|---|---|---|---|---|
| range | CWW | KL[2] | KL[30] | CWW | KL[2] | KL[30] | |
| 0.096 | 0.073 | 0.070 | 0.060 | 0.041 | 0.038 | ||
| 0.391 | 0.293 | 0.197 | 0.111 | 0.081 | 0.052 | ||
| 0.227 | 0.169 | 0.121 | 0.079 | 0.056 | 0.043 | ||