Vertical motions in the disk of NGC 5668 as seen with optical Fabry-Perot spectroscopy††thanks: Based on observations made with the William Herschel Telescope operated on the island of La Palma by the Isaac Newton Group in the Spanish Observatorio del Roque de los Muchachos of the Instituto de Astrofísica de Canarias
Abstract
We have observed the nearly face-on spiral galaxy NGC 5668 with the TAURUS II Fabry-Perot interferometer at the William Herschel Telescope using the line to study the kinematics of the ionized gas. From the extracted data cube we construct intensity, velocity and velocity dispersion maps. We calculate the rotation curve in the innermost 2 arcmin and we use the residual velocity field to look for regions with important vertical motions. By comparing the geometry of these regions in the residual velocity field with the geometry in the intensity and velocity dispersion maps we are able to select some regions which are very likely to be shells or chimneys in the disk. The geometry and size of these regions are very similar to the shells or chimneys detected in other galaxies by different means. Moreover, it is worth noting than this galaxy has been reported to have a population of neutral hydrogen high velocity clouds (Schulman et al. 1996) which, according to these observations, could have been originated by chimneys similar to those reported in this paper.
Key Words.:
Interstellar medium: kinematics and dynamics – Galaxies: individual: NGC 5668 – Galaxies: ISM – Galaxies: kinematics and dynamics – Galaxies: spiral1 Introduction
There is now great observational evidence that disk-halo interactions in galaxies as well as the structure of the interstellar medium (ISM) is closely related to star formation processes in the disks of spiral galaxies (see the review by Dahlem 1997). Big shells develop around the brightest star forming regions, induced by the energy input of supernovae and the strong stellar winds produced by high-mass stars. These shells can grow enough to be able to break the disk, allowing large amounts of gas to blow out from the disk along these big chimneys (Norman & Ikeuchi 1989). The very hot gas going out through these chimneys cools as it rises until it eventually recombines and condenses to form clouds of neutral gas that fall back to the plane (Shapiro & Field 1976, Bregman 1980). This fountain model then provides an explanation for the origin of high velocity clouds (HVC’s) that have been observed in our galaxy and a in few external galaxies (with the galaxy studied in this paper being one of those few (Schulman et al. 1996, hereafter S96)), although alternative explanations have been proposed as well (Blitz et al. 1999). Good reviews on this topic can be found in Wakker & van Woerden (1997) and van der Hulst (1996, 1997). On the other side, the expanding shells can induce new star formation (sequential star formation (SSF)) at their edges. This effect has already been observed in some galaxies (see for example Thilker et al. 1998, hereafter T98) and it is also observed to take place in the case of NGC 5668 in our observations.
According to the chimney model, the structure of the ISM, and in particular whether the chimney phenomenon takes place or not, is controlled by the amount of star formation. The study of the properties of these phenomena in a sample of nearby galaxies can greatly help to understand the structure of the ISM and the nature of disk-halo interactions. Observations of the neutral gas and narrow band imaging of the ionized gas have already been extensively used to study these phenomena (see the review by Dahlem 1997). Scanning long-slit spectroscopy has also been used to study these phenomena (Saito et al., 1992; Tomita et al., 1993, 1994). In this work we make a first attempt to use optical Fabry-Perot spectroscopy in a nearly face-on spiral galaxy to directly study these vertical motions. Therefore we have chosen the spiral galaxy NGC 5668 which is already known to have HVC’s and an important rate of star formation. These facts make it a perfect candidate for us to detect important vertical motions in its disk.
In Sect. 2 we describe the general properties of the galaxy NGC 5668, with particular emphasis on the observation of the HVC’s. Sect. 3 deals with the observations and data reduction (including calculation of intensity, velocity and velocity dispersion maps). Sect. 4 is devoted to the calculation of the rotation model for the galaxy from the observed velocity field. Sect. 5 describes how the residual velocity field is used to look for systematic deviations of circular rotation and how comparison of the geometry of the residual velocity field with that of the intensity and velocity dispersion in some regions can be used to detect real shells and/or chimneys. Finally, in Sect. 6 we report the shell candidates found in NGC 5668 and some of their properties.
2 NGC 5668: General properties
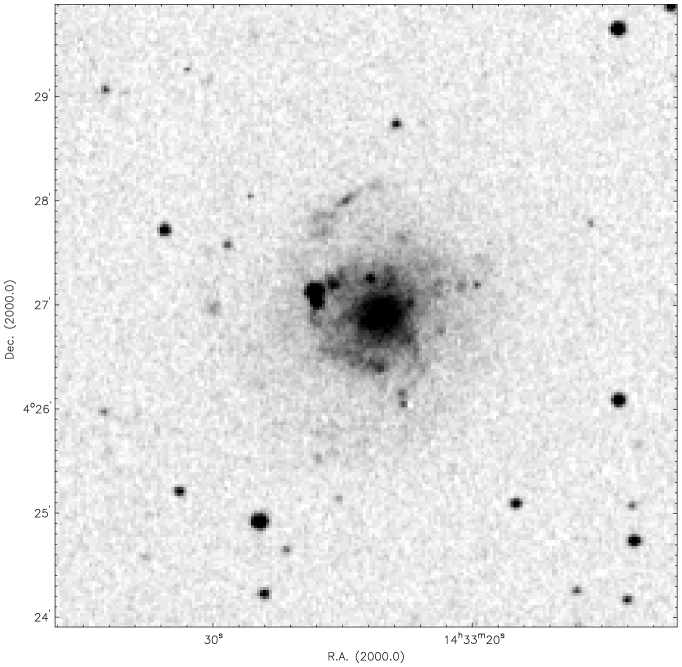
NGC 5668 is a nearly face-on (inclination ) late type spiral galaxy (Sc(s) II-III). A wide band optical image of the galaxy can be seen in Fig. 1111 Based on photographic data of the National Geographic Society – Palomar Observatory Sky Survey (NGS-POSS) obtained using the Oschin Telescope on Palomar Mountain. The NGS-POSS was funded by a grant from the National Geographic Society to the California Institute of Technology. The plates were processed into the present compressed digital form with their permission. The Digitized Sky Survey was produced at the Space Telescope Science Institute under US Government grant NAG W-2166.. We will adopt a distance of 22.6 Mpc, consistent with . Its size (the blue isophote at 25 mag/arcsec is 3.3 arcmin in diameter) makes it an ideal target for observation with TAURUS II (which has a FOV of about 5 arcmin)). The measured radial scale length for NGC 5668 is 27.3 arcsec, which means that our observations reach up to around 4.4 scale lengths. The FIR and luminosities of NGC 5668 (S96) show that it has an important amount of star formation. A summary of its main properties is shown in Table 1.
| Name | NGC 5668 |
|---|---|
| Type | Sc(s) II-III |
| R.A.(2000) | |
| Dec (2000) | |
| B Magnitude | 12.2 |
| (RC3) | 1583 km/s |
| Distance | 22.6 Mpc |
| Inclination | |
| P.A. |
NGC 5668 was observed in the HI line by means of the Arecibo telescope by Schulman et al. (1994). They detected high velocity wings in the line shape, which were attributed to HVC’s in the galaxy. As the Arecibo observations did not contain information on the spatial distribution of gas, subsequent observations were taken with the VLA telescope by S96. These observations confirmed the existence of the HVC’s. They found that the amount of mass on neutral hydrogen in HVC’s is about . Their observations lacked sufficient spatial resolution (the FWHM of the synthesized beam was ) to detect the shells or chimneys in the disk that could be the origin of this large amount of gas in high velocity components. The main purpose of this paper is to try to detect such features by means of Fabry-Perot spectroscopy.
3 Observations and data reduction
The observations were taken on March 19, 1997, at the William Herschel Telescope using the TAURUS II Fabry-Perot interferometer at the Cassegrain focus, with the f/2 camera and the 500 etalon. The detector used was a TEK CCD. With this configuration the pixel size is 0.56 arcsec. We rebinned 2x2 the CCD reading, resulting in a pixel size of 1.12 arcsec (which for an adopted distance to NGC 5668 of 22.6 Mpc results in 123 pc/pixel). The observing conditions were not photometric (therefore we were not able to make photometric calibrations and we will use arbitrary units for intensity throughout this paper). The measured seeing in the final images was 3 arcsec which is still a very good spatial resolution when compared with the previously mentioned kinematical data available for this galaxy. We used the line to trace the distribution and kinematics of the ionized gas. According to the observed velocity of the galaxy (see Table 1) the wavelength for the redshifted line is 6597.5 . Therefore we used the 6601/15 filter for order sorting. We scanned the free spectral range (FSR) in 55 steps with an exposure time of 120 seconds per frame. This gave a spectral resolution of 3.61 km/s/pixel. Calibration datacubes illuminating the instrument with a CuNe lamp were taken at the beginning and at the end of the night. Moreover a ring calibration frame was taken before and after the datacube exposure to make the RVT correction. The instrumental width (measured after phase correcting the calibration datacube) was 7.7 km/s. The main properties of the observational setup are summarized in Table 2.
| Date of observation | 19/03/1997 |
|---|---|
| Telescope | WHT |
| Focus | Cassegrain |
| Instrument | TAURUS II |
| Etalon | |
| Filter | 6601/15 |
| Detector | TEK CCD |
| Steps | 55 |
| Exposure time per step | 120 sec |
| Free Spectral Range | 194.1 km/sec |
| Instrumental width | 7.7 km/s |
| Spectral resolution | 3.61 km/sec/pixel |
| Pixel size | 1.12 arcsec |
| Seeing | 3 arcsec |
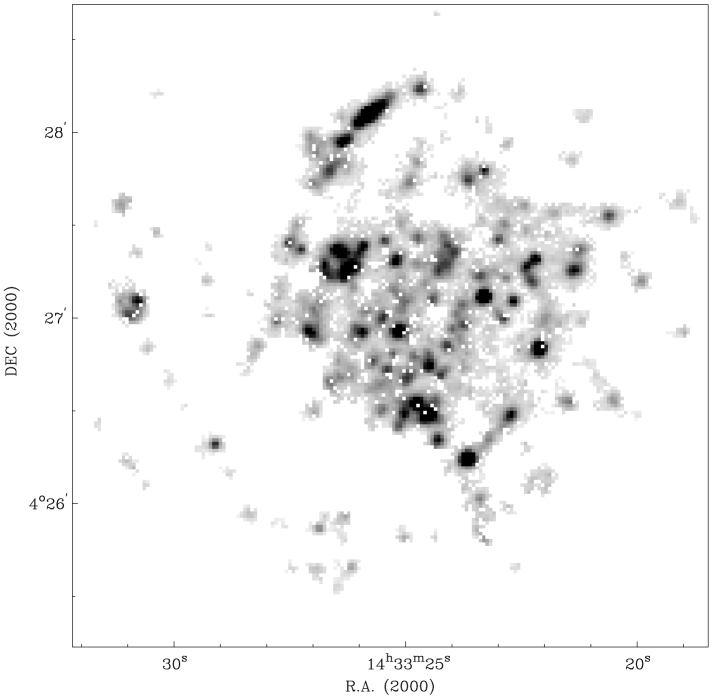
After phase and wavelength calibration the datacube was bias subtracted. The continuum level was calculated by fitting a first order polynomial to the channels where there is no line emission from the galaxy, and the continuum map was then subtracted from the datacube. From the continuum free datacube we calculated the intensity, velocity and velocity dispersion maps. We calculated the maps by two different methods: a moments procedure and a gaussian fitting. The intensity and velocity maps are very similar in both cases and we use the ones calculated by the gaussian fitting procedure. The velocity dispersion maps are substantially different and we use the one calculated by the fitting procedure as well, in order to avoid systematic bias as pointed out by van der Kruit & Shostak (1982). The calculated maps are very noisy. To clean these maps we imposed certain conditions to flag out bad data points. We therefore kept only those pixels which had a velocity dispersion between 7.7 km/s (the instrumental width) and 50 km/s (data points above this level are clearly not valid). We also required the points to have a peak intensity at least 2 times larger than the noise dispersion. Finally some clearly bad data points were excluded interactively by inspection of the resulting maps. As we are interested in the non-thermal velocity dispersion, we corrected the calculated dispersion for the natural width of the line (3 km/s), the insrtumental width (7.7 km/s) and the thermal width (9.1 km/s assuming a temperature of K for the ionized gas). The corrected average velocity dispersion calculated for this galaxy is around 16.5 km/s independent of radius. This value is somewhat higher than that measured for other galaxies, which is usually around 10 km/s (see for example Jiménez-Vicente et al. 1999), showing that the ISM of NGC 5668 is more turbulent. The intensity map for NGC 5668 is shown in Fig. 2.
4 The velocity field and the rotation curve
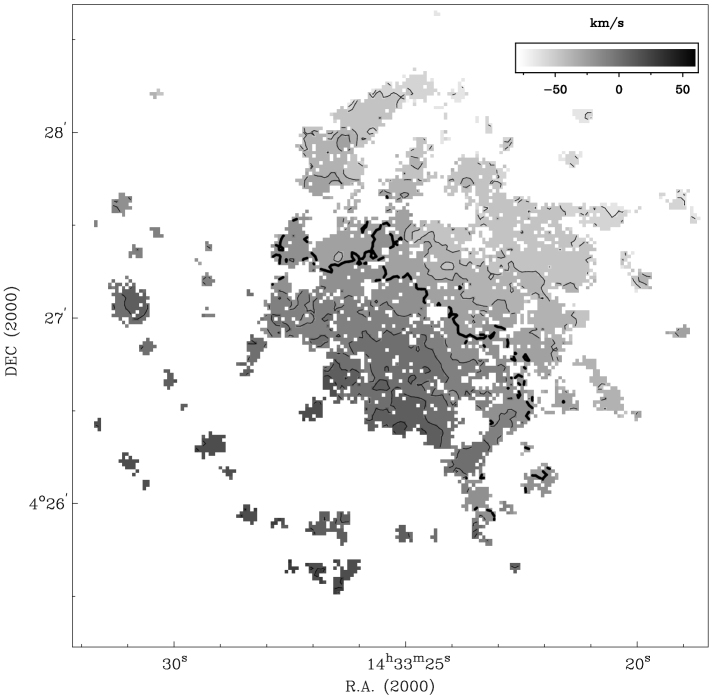

The observed velocity field is shown in Fig. 3. The velocity field is well mapped out to 1.5 arcmin from the centre. Outside this radius only a few H II regions are visible and therefore the extracted kinematic information for this region is less reliable. In order to calculate a rotation model for the galaxy, we used the standard procedure of fitting a tilted rings model (see Begeman 1989) to the observed velocity field. In order to minimize the number of free parameters and to simplify the fitting process we used known information from previous observations. Therefore we fixed the position of the kinematic centre at the same position than the optical centre. We fixed the inclination and position angles at and respectively, according to the values reported by S96, which allow us to make a better comparison with their results. These authors have shown that both angles remain constant in the inner 2 arcmin, which is the region for which we have data, and we therefore know that our results are not affected by this assumption. The systemic velocity for the galaxy was also taken from S96 to be 1582 km/s. We have checked that small variations of these parameters do not substantially change the model velocity field. The only free parameter left per ring, namely the rotational velocity, is fitted to the observed velocity field. Finally, to take into account that we have fewer data points in the outer part of the galaxy, we make the rings wider in this region to ensure that a minimum number of data points is included in a ring. This results in the outer rings being 4 times wider than the inner ones. The resulting rotation curve is shown in Fig. 4. It rises continuously out to about 100 arcsec from the centre, where it seems to become flat at a velocity of about 150 km/s. This value is somewhat higher than the rotational velocity reported by S96 of 130 km/s. In fact, the rotation velocities determined at every radius are always higher than those previously reported by S96 by around 20 km/s. It is worth noting than the last two data points in this curve are not fully reliable, as we remarked above that we only have a few H II regions lying outside 1.5 arcmin from the centre (most of them in the receding part of the galaxy) from which kinematical information can be obtained. If a value of 130 km/s is adopted for the rotational velocity in the outer part of the galaxy to match the observations in HI, then all the outermost regions, which trace one of the spiral arms, would have quite high residual velocities. Although this is not unlikely, we have no way to confirm that this is what is happening, and we therefore prefer to use the best fit to our data to calculate the residual velocity field and thus we use the rotation curve shown in Fig. 4. In the inner 1.5 arcmin, where our determination of the rotation curve is reliable, this is the best determination of the rotation curve (in both spatial and spectral resolution) for NGC 5668 up to date.
5 The residual velocity field and the shell/chimney candidates (HRVR’s)
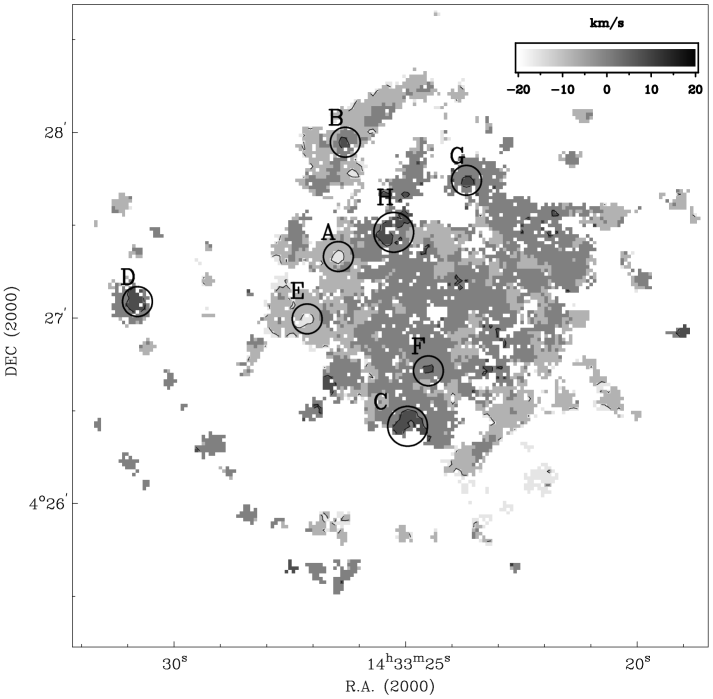
The residual velocity field is calculated by subtracting the rotation model from the observed velocity field. Fig. 5 shows the resulting map. Although the map is quite noisy, a close inspection allows us to detect some regions which have a systematic deviation from rotational velocity greater than 10 km/s (which is 1.5 times the dispersion of the residual velocity map). We call these regions high residual velocity regions (HRVR’s). In order to distinguish between HRVR’s with real important vertical motions from regions whose residual could be an effect of noise or random motions in the disk, we also use the size and shape of the region. We therefore label as a HRVR only to those regions with a clear symmetry in the shape and with a mean diameter between 3 (which is our spatial resolution) and 13 arcsec (which corresponds to about 1.5 kpc). The regions have been marked with a circle and named with a letter in Fig. 5. The shape of the HRVR’s (which is in many cases nearly circular) makes it very unlikely that those regions are related to streaming motions. It then seems logical to interpret the residuals as true vertical motions in the disk. This interpretation is strongly reinforced if we look at the intensity map in the locations where the HRVR’s are found. We can see that the regions are clearly associated with regions of star formation which fall in their centres or immediate surroundings. In most cases the structure of the velocity dispersion map in the HRVR’s is also strongly correlated with both intensity and residual velocity (reaching values up to 34 km/s in the centre of the HRVR), which supports the idea of regions of great activity (high temperature or violent motions). These facts strongly support the hypothesis that the HRVR’s are regions with real vertical motions of the ionized gas which are related to star forming processes in the disk. The most straightforward interpretation of these features (although certainly not the only one) is that they are shells or chimneys (depending on their size and age and on whether they have been able to break the disk and to blow gas out of it) formed around highly active star-forming regions by the strong stellar winds or correlated SN explosions of the multiple massive young stars found whithin those regions. This scenario perfectly matches the chimney model proposed by Norman and Ikeuchi (1989) for the ISM and is also supported by observations in other galaxies (see for example T98). The fact that NGC 5668 has a great amount of star formation and that HVC’s of neutral hydrogen have been detected in it (S96) makes the whole scenario fully coherent.
6 Some shell/chimney properties
| ID | R (pc) | (km/s) | (km/s) | Type |
|---|---|---|---|---|
| A | 500 | -17 | 18.5 | R |
| B | 200 | 13 | 17.7 | C |
| C | 600 | 13 | 19.5 | R |
| D | 300 | 15 | 19.6 | C |
| E | 400 | -18 | 22.4 | U |
| F | 600 | 12 | 17.0 | R |
| G | 250 | 13 | 16.0 | C |
| H | 450 | 15 | 17.1 | U |
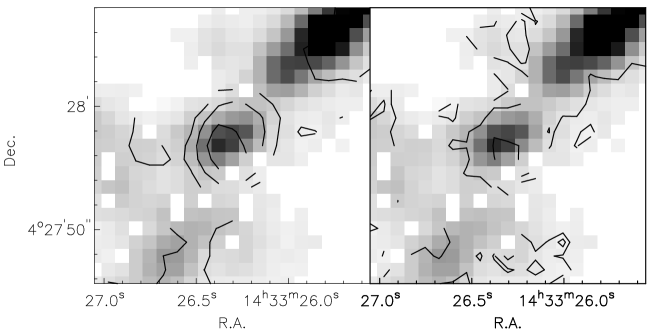
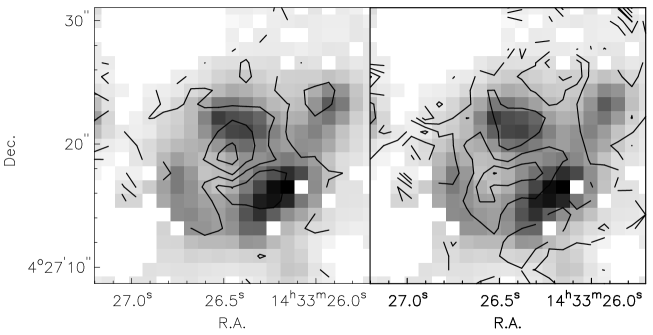
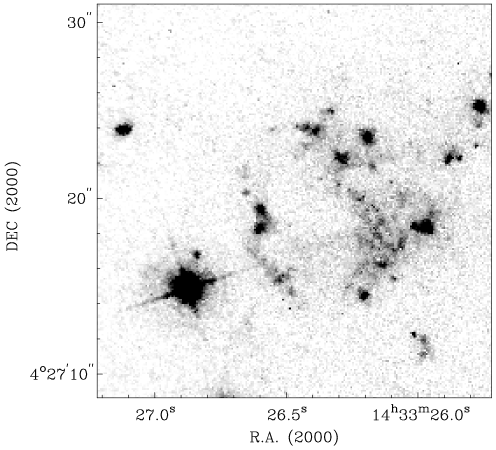
We were able to find eight HRVR’s in NGC 5668. When we look at the positions of the HRVR’s in the intensity and velocity dispersion map, we find that they are always related to regions of active star formation. Whether the star formation regions lie in the centre or the surroundings of the HRVR’s can probably be explained as an age effect. The youngest, yet small expanding shells show the star-forming regions at their centre and are therefore roughly circular in the intensity map. Fig. 6 shows an example of this type. The more evolved stalled chimneys are surrounded by a more or less complete ring-like structure of star-forming regions which are probably formed by sequential star formation (see T98). Fig. 7 shows one of these cases. Both Figs. show clearly that there is a strong correlation between residual velocity, intensity and velocity dispersion in the HRVR’s. In the case of region B (Fig. 6) the peak in the residual velocity perfectly matches the position of a bright HII region and of a minimum in the velocity dispersion. In the case of region A (Fig. 7) the residual velocity peaks roughly at the centre of a ring-like structure formed by HII regions, and the velocity dispersion peaks right in the centre of this ring-like structure in the low intensity part. The structure of the emission around region A can be seen better in fig. 8 where this region, extracted from the image of NGC 5668 taken with the WFPC/2 of the HST222Based on observations made with the NASA/ESA Hubble Space Telescope, obtained from the data archive at the Space Telescope Science Institute. STScI is operated by the Association of Universities for Research in Astronomy, Inc. under NASA contract NAS 5-26555 using the F658N filter is shown. This filter perfectly matches the wavelength of the line for NGC 5668, and although it also contains the NII line and continuum emision, it mostly traces the ionized gas. Fig. 8 shows that there are not only compact HII regions, but also a large amount of diffuse gas emission around this region. This can also be seen in most of the other HRVR’s detected in NGC 5668 which are visible in the HST image. Although the structure of most of the HRVR’s do not show this aspect (for example many of the ring-like structures are not as complete as the shown example, but show just half a ring or even less), there is always a clear correlation between the structure of residual velocity, intensity and velocity dispersion. Moreover the HST image shows that around these HRVR’s (seven of the eight detected are visible in the HST image) there are not only numerous HII regions, but also a large amount of difuse ionized gas. Table 3 gives some of the properties of the shell/chimneys detected in NGC 5668. It is worth noting that all the HRVR’s (except region G) have an average velocity dispersion above the average of the galaxy (which is around 16.5 km/s throughout the whole disk as shown in Fig. 9). As we noted previously, the HRVR’s are always in or surrounded by regions of high velocity dispersion.

Although it is difficult to make an estimation for the ages of the shells, previous studies (T98) show that they range from a few Myr for the small expanding shells up to some tens of Myr for the largest stalled chimneys.
7 Conclusions
We have carefully analyzed the data obtained for NGC 5668 with the Fabry-Perot interferometer TAURUS II at the WHT in order seek a connection between the star formation processes and vertical motions in spiral galaxies. We have found that there is a clear correlation between the morphology of the regions with a high residual velocity (HRVR’s) and the intensity of the emission, showing that the HRVR’s are indeed regions with important vertical motions associated with star formation processes. Although we are not able to calculate the ages and energetics of these features, comparison with observations in other galaxies strongly supports the hypothesis that the structures detected present a wide age range, from young expanding shells in a bright HII region, to evolved chimneys blowing out hot gas to the halo, surrounded by several bright HII regions. The formation of these regions was probably induced by the pressure exerted by the expanding shell/chimney on the ambient gas. An alternative explanation to these features is that they are produced by infall/collision of gas clouds with the disk (e.g. Saito et al., 1992) followed by induced active star formation. Although this scenario explains in a very natural and simple way the fact that the velocity offsets are one-sided, this is also quite normal in expanding shells. If they are formed not exactly in the equator but slightly off-plane, they will grow up mostly in the low density side, therefore showing only one-sided offsets in the velocity structure. In fact, with the present data there is no way to decide whether the HRVR’s are moving into or out of the disk. On the other hand, the different structures found in the HRVR’s (from compact HII regions to rings of HII regions) are fully compatible with an evolutionary pattern in the chimney model. Therefore, although we can not rule out the infalling hipotheses with the present observations, we find the chimney scenario followed by sequential star formation in the shell borders to be a more likely explanation for what is happening in NGC 5668. These observations provide in any case a clear link between the star formation processes in the disk with other observed phenomena in NGC 5668 like high HVC’s of neutral hydrogen. Observations of this kind have been made for other galaxies with a lower star formation rate and without HVC’s, and the residual velocity field is not reported to show these features (see for example Jiménez-Vicente et al. 1999, for a similar study of NGC 3938). This fact seems to suggest that these features and the existence of HVC’s in the disk are closely related. High resolution HI observations of NGC 5668 would be desirable to confirm the connection between those phenomena.
References
- (1) Begeman, K., 1989, A&A 223, 47
- (2) Blitz, L. Spergel, D. N., Teuben, P. J., Hartmann, D., Burton, W. B., 1999, ApJ 514, 818
- (3) Bregman, J. N., 1980, ApJ 236, 577
- (4) Dahlem, M., 1997, PASP 109, 1298
- (5) van der Hulst, J. M., 1996, in The Minnesota lectures on extragalactic neutral hydrogen, ed by E. D. Skillman, PASPC v. 106, p 47
- (6) van der Hulst, J. M., 1997, in The Physics of Galactic Halos, Proceedings of the 156th WE-Heraeus Seminar Bad Honnef, Germany, Feb 11-14 1996, ed by H. Lesch, R-J. Dettmar, U. Mebold and R. Schlickeiser, p 41
- (7) Jiménez-Vicente, J., Battaner, E., Rozas, M., Castañeda, H., Porcel, C., 1999, A&A 342, 417
- (8) van der Kruit, P.C., Shostak, G.S., 1982, A&A 105, 351
- (9) Norman, C.A., Ikeuchi, S., 1989, ApJ 345, 372
- (10) Saito, M., Sasaki, M., Ohta, K. and Yamada, T., 1992, PASJ 44, 593
- (11) Schulman, E., Bregman, J.N. and Roberts, M.S., 1994, ApJ 423, 180
- (12) Schulman, E., Bregman, J.N., Brinks, E. and Roberts, M.S., 1996, AJ 112, 960
- (13) Shapiro, P.R., Field, G.B., 1976, ApJ 205, 762
- (14) Thilker, D.A., Braun, R. and Walterbos, R.A.M., 1998, A&A 332, 429
- (15) Tomita, A., Ohta, K, Saito, M., 1993, PASJ 45, 693
- (16) Tomita, A., Ohta, K, Saito, M., 1994, PASJ 46, 335
- (17) Wakker, B.P., van Woerden, H., 1997, ARA&A 35, 217