A radio-microlensing caustic crossing in B1600+434?
Abstract
First, we review the current status of the detection of strong ‘external’ variability in the CLASS gravitational B1600+434, focusing on the 1998 VLA 8.5–GHz and 1998/9 WSRT multi-frequency observations. We show that this data can best be explained in terms of radio-microlensing. We then proceed to show some preliminary results from our new multi-frequency VLA monitoring program, in particular the detection of a strong feature (30%) in the light curve of the lensed image which passes predominantly through the dark-matter halo of the lens galaxy. We tentatively interpret this event, which lasted for several weeks, as a radio-microlensing caustic crossing, i.e. the superluminal motion of a as-scale jet-component in the lensed source over a single caustic in the magnification pattern, that has been created by massive compact objects along the line-of-sight to the lensed image.
1. Introduction
Optical microlensing has unambiguously been detected both in our own Galaxy (e.g. the EROS, MACHO and OGLE collaborations; see these proceedings), as well as in external galaxies (e.g. Q2237+0305; Irwin et al. 1989). However, no convincing detections of microlensing in other wavebands have been claimed thus far. In our Galaxy this is mostly due to the very low surface number density of bright sources, other than stars, that are compact enough (i.e. few mas) to be significantly microlensed. For cosmological microlensing there are similar arguments. Because the angular Einstein radius of a point-mass scales approximately as , where is the distance to the lens, the lensed source must be few as in angular size to by microlensed by compact stellar-mass lenses at cosmological distances (few Gpc). It was thought until recently that only the optical to -ray emitting regions of quasars and AGNs had these extremely small angular scales and would still be observable over cosmological distances.
In this proceeding we will show, however, that ‘radio-microlensing’ has most likely been detected in the CLASS gravitational lens B1600+434 (Jackson et al. 1995) and that it promises to be a new and exciting technique for the study of massive compact objects in galaxies at intermediate redshifts.
2. Macro & microlensing of flat-spectrum radio sources
The JVAS/CLASS gravitational-lens survey (e.g. Browne et al. 1997) has discovered at least 17 radio-bright gravitational lens systems. All systems were selected to have a flat spectrum (0.5 with ) between 5 and 1.4 GHz. This ensures that most of these sources are dominated by a compact radio-bright core. These sources are often variable on short time scales and in many cases show superluminal motion (e.g. Vermeulen & Cohen 1994).
Strong variability seems to imply that these radio sources are very compact. Based on a simple light-travel-time argument, one expects a source at a cosmological distance (few Gpc) to have an angular scale of only a few as if it varies significantly on a time scale of say one month. However, superluminal motion with a high Doppler-boosting factor () complicates this argument, because the intrinsic variability time scale is reduced by a factor , whereas the intrinsic angular scale of the source is reduced by only (e.g. Lähteenmäki, Valtaoja & Wiik 1999). Based on variability arguments, the angular size of the source could therefore be severely underestimated if . Furthermore, based on Rayleigh–Jean’s law and a typical surface brightness temperature of K (e.g. Lähteenmäki et al. 1999), one expects an angular size as much as several tens of as for those sources that have been observed in the JVAS/CLASS survey. This is much larger than the typical Einstein radius of a solar-mass object. Overall, it appears that microlensing of these sources is at most marginal, especially for the brighter sources (tens of mJy).
However, matters are not as bad as they seem! First of all, lensed sources are often magnified by the lensing potential. Their intrinsic flux-density is therefore less than the observed flux-density and, because surface brightness (temperature) is conserved in lensing, also their intrinsic angular source size is smaller. Second, flat-spectrum sources at high redshifts often exhibit jet-structures with superluminal motion (e.g. Vermeulen & Cohen 1994). If these jets contain many distinct ‘bullets’ or shock-fronts, their angular sizes can be very small, especially if they are significantly Doppler-boosted (). We expect this to be the case near the core of these flat-spectrum sources, although components further along the jet might grow in size and have lower velocities. Hence, even though the integrated flux-density of the source might be large, suggesting a large angular size, in reality the likely presence of compact substructure with high Doppler-boostings makes this argument significantly weaker. The expected angular size of these flat-spectrum subcomponents is
where is the surface brightness temperature of the component in units of K, is the magnification by the lens and is the source redshift. For subcomponent flux-densities () of a few mJy, an angular size of a few as can be expected. This is small enough to be appreciably microlensed!
Below we will illustrate this by the CLASS gravitational lens system B1600+434, in which believe to have detected radio-microlensing of precisely this type of as-scale jet-components (Koopmans & de Bruyn 2000; KdB00 hereafter).
3. CLASS B1600+434
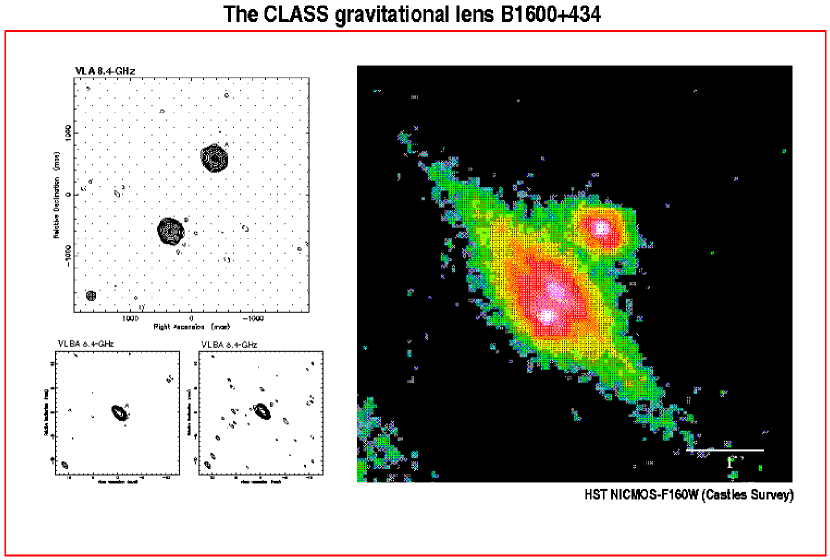
The CLASS gravitational lens B1600+434 consists of two compact radio components separated by 1.4 arcsec (Fig.1). The lens galaxy is an edge-on spiral at a redshift of 0.41, whereas the source has a redshift of 1.59 (Koopmans, de Bruyn & Jackson 1998). Image A passes predominantly through the dark-matter halo of the lens galaxy (6 kpc above the plane of the galaxy), whereas image B passes through its stellar component (i.e. disk/bulge). The extended optical emission around image A is thought to be associated with its host galaxy at =1.59. Both radio components are compact (1 mas) and have a flat radio spectrum. The source is highly variable at frequencies between 1.4 and 8.5 GHz (Koopmans et al. 1998).
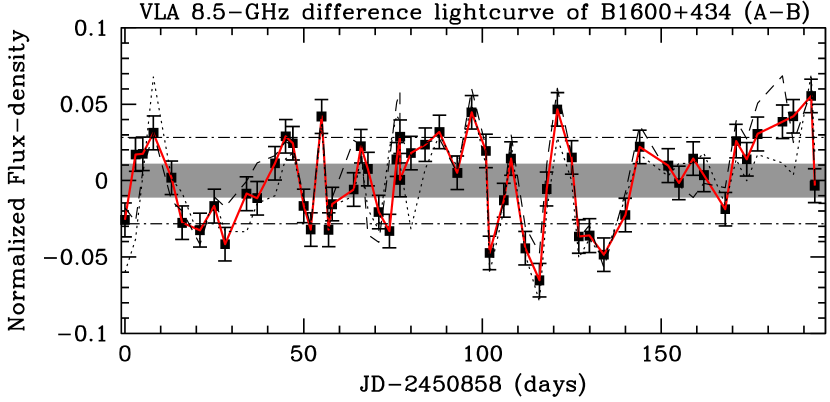
To determine the time delay between the lensed images, we monitored B1600+434 with the VLA in A- and B-arrays at 8.5 GHz, during a period of about 8 months in 1998 (Koopmans et al. 2000). From these light curves we determined a time delay of 47 days (68%), using the minimum-dispersion method from Pelt et al. (1996). The PRH method (Press, Rybicki & Hewitt 1992) gives the same time delay within the error range. Shifting the light curve of image B back in time over this time-delay and subsequently subtracting it from the light curve of image A, taking the proper flux-density ratio in to account, results in the difference light curve shown in Fig.2. The rms variability of the difference light curve (2.8%) is significantly larger than the expected rms variability due to noise only (1.1%). The difference light curve is consistent with the presence of non-intrinsic variability (i.e. ‘external’ variability) at the 14.6– confidence level (KdB00). Because the time delay was determined using a minimum-dispersion method, time delays other than 47 days would yield an even larger rms variability in the difference light curve.
4. ‘External’ variability in B1600+434
What can be the origin of the presence of ‘external’ variability in the image light curves? There are several plausible causes:
-
•
Scintillation by the Galactic ionized interstellar medium.
-
•
Microlensing of the background source by massive compact objects in the lens galaxy.
Before proceeding, however, let us first summarize the results on B1600+434 from our VLA & WSRT monitoring data (until late 1999), that might be relevant in uncovering the true nature of the observed external variability (see KdB00):
-
1.
The short-term rms variability (i.e. the 1st–order modulation index) of the lensed images A and B are 2.8% and 1.6% respectively.
-
2.
The difference light curve has an rms variability of 2.8%.
-
3.
The VLA 8.5-GHz image light curves, as well as the difference light curve, seem to show long-term (1 d) variability, next to some faster variability. The precise time scales are hard to determine, because of the average light-curve sampling rate of once per 3.3 days.
-
4.
Several 5-GHz WSRT 12-h integrated flux-density lightcurves of B1600+434 (June-July 1999), with a sampling rate of once every 5 min, show no evidence for variability 2% on time scales less than 12 hours.
-
5.
Multi-frequency monitoring with the WSRT shows a decrease in the short-term rms variability from 5 to 1.4 GHz by a factor of 3.
Can this considerable body of multi-frequency data be explained in terms of Galactic scintillation (Section 4.1) or radio-microlensing (Section 4.2)?
4.1. Galactic Scintillation
From ‘standard’ scintillation theory (e.g. Narayan 1992), we expect a strong anti-correlation between the time-scale of variability and its amplitude (i.e. rms variability). According to the Taylor & Cordes (1993) model for the Galactic ionized medium, B1600+434 should be in the weak-scattering regime and have a variability time scale of at most 1 day for an observed rms variability of 1.6–2.8%. However, the WSRT data show no evidence for this short-term variability (point 4). In fact a number of flux-density variations appear to have relatively long time scales (several weeks; see point 3 and also Section 5). These time scales would normally correspond to an rms variability that is well below the noise level (1%). Hence, the longer variability time scales are not compatible with the observed amplitude of variability in the lensed images (KdB00).
Beside this, the images are separated by only 1.4 arcsec but show a factor 1.75 difference in their rms variabilities (point 1). This either results from a difference of a factor 3.1 in their Galactic scattering measures, or a 90–as scatter-broadening of image B in the lens galaxy at 12 GHz (KdB00). This requires a scattering measure 1 kpc m-20/3 in the lens galaxy, which is very large compared to typical lines-of-sight through our Galaxy. Scatter-broadening at a lower level can not be excluded, however.
Finally, in the case of scintillation the observed rms variability should increase towards longer wavelenghts if the source is extended (i.e. larger than the scattering disk). In the case of B1600+434, however, we find that the rms variability decrease by almost a factor 3 between 5 and 1.4 GHz (KdB00; point 5). One might argue that the source contains a compact component that scintillates and a more extended component that does not vary. The compact component would show less variability at 1.4 Ghz than at 5 GHz, because it would be in the strong-scattering regime. However, the time-scale of variability at 5 GHz for this component would remain only a few hours, whereas the 12-h WSRT light curves show no evidence for this (point 4).
Overall, we conclude that the observational evidence does not seem to favor scintillation as the explanation of the observed external variability in B1600+434 (KdB00). To save this hypothesis a considerable rethinking of the properties of the Galactic ionised medium is required, at least in the direction of B1600+434.
4.2. Radio-microlensing
How about radio-microlensing? There are different ‘ingredients’ that play a role:
-
•
Source Structure: We assume that the source consist of a stationary core with a jet structure. This jet contains (several) condensations, either physical ‘bullets’ or shock-fronts. These jet-components move with near- or super-luminal motion and are compact (as scale), especially near the core. Components further along the jet might grow in size.
-
•
Compact Objects in the Lens Galaxy: The lens galaxy consists (partly) of massive compact objects. These objects create a magnification pattern on the source-plane, if they constitute a considerable fraction of the lens-galaxy mass inside a radius of 0.5–1 arcsec,
When these two ‘ingredients’ are combined, one will have jet-components that move over the magnfication pattern, being continuously magnified and/or demagnified, resulting in variability in the integrated flux density of the lensed images. The time-scale for these jet-component to cross the Einstein diameter of a point-mass is
where is the source redshift, is the apparent jet-component velocity in units of , is the lens mass, and , and are the angular diameter distances between lens-source, observer-source and observer lens, respectively. More complex microlensing simulations show similar time-scales of the order of weeks to months for typical jet velocities of a few time and compact-object masses of 1 M⊙. The longer observed variability time-scales for B1600+434 are therefore consistent with the radio-microlensing hypothesis (KdB00).
The difference in rms variability between the lensed images can be explained either by a difference in the compact-object mass function in their respective lines-of-sight and/or by moderate scatter-broadening (few as) of the image passing through the disk/bulge. If for example the average mass of compact objects in the disk/bulge is much lower than that for the halo line-of-sight, the resulting magnification pattern will show a more dense caustic network. This reduces the expected rms variability for a given angular source size (e.g. KdB00).
The strongest argument in favor of microlensing, however, is the frequency dependence of the observed rms variability. Using the constraints on the jet-structure that we derived from the 8.5-GHz VLA observations in 1998, we predict a decrease in modulation index from 5 to 1.4 GHz by a factor 3, if we assume that the jet-components are synchrotron self-absorbed (i.e. grow linearly with wavelength). This decrease has indeed been observed in the independent WSRT observations from 1998/1999 (Section 4; KdB00).
5. A caustic crossing in the radio?
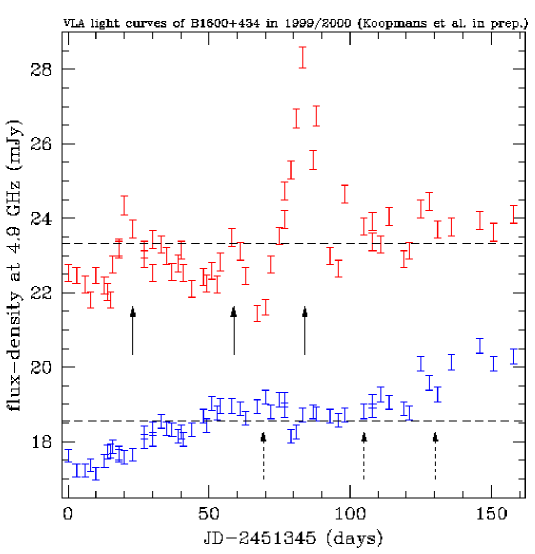
During the 1999/2000 VLA A- and B-array configurations we have been monitoring B1600+434 at 8.5, 5 and 1.4 GHz (Koopmans et al. in prep). Some very preliminary results at 5 GHz are shown in Fig.3. This data show several strong ‘events’ (10–30%) at both 5 and 8.5 GHz, whereas they are absent in the 1.4-GHz light curve. What is their origin? All distinct events in image A do not re-occur in image B (after the time-delay of 47 days) and are therefore not intrinsic source variability.
Can the strongest feature (around day 80) be an ‘extreme scattering event’ (ESE; Fiedler et al. 1987)? Plasma clouds in our Galaxy move with typically 30 km/s. Event durations of several weeks then imply an angular size for these clouds of 1 mas, if they are located at 0.5 kpc distance from us, thereby covering the entire source. An event of 30% at 5 GHz would then be detectable at 1.4 GHz as well, whereas no evidence for this is seen in the VLA 1.4-GHz light curves. Moreover, these very rare ESE’s are not expect to occur several times in the same light curve of image A within a time span of only 150 days. Similarly, also scintillation does not show this extreme behavior in amplitude over time scales of several weeks (see Section 4.1).
Rather, we think that this event is caused by a as-scale jet-component in the lensed source, which has recently been ejected from the core. This component subsequently moves over a single caustic in the magnification pattern that is created by compact objects in the line-of-sight towards lensed image A, causing observable variability in the integrated flux-density of the lensed image.
6. Conclusions
The CLASS gravitational lens B1600+434 shows strong ‘external’ variability in the VLA 5 and 8.5-GHz light curves of lensed image A, which passes predominantly through the halo of the lens galaxy. Neither Galactic scintillation nor Extreme Scattering Events (ESE) can satisfactorily explain all the observations. Only ‘radio microlensing’ can explain the observed variability time-scales and amplitudes, as well as its frequency dependence, without invoking extreme assumptions. It also offers a natural explanation for the strong (30%) event that we more recently observed, as being a ‘radio-microlensing caustic crossing’.
Based on the 1998 VLA and 1998/9 WSRT data, we already attempted to place constraints on the mass-function of compact objects in the lens-galaxy halo, finding a lower limit of 0.5 M⊙ (KdB00). However, these constraints are still weak and depend strongly on assumptions about scatter-broadening in image B. The way foreward is to use only the lightcurve of image A to put constraints on the mass function in its line-of-sight. With the detection of distinct radio-microlensing events, this task has become a realistic possibility. We have started to work on this (Koopmans et al. in prep) and hopefully we will soon be able to place significantly better constraints on the mass function of compact objects in the lens-galaxy halo, bringing cosmological radio-microlensing up to Galactic standards!
Acknowledgments.
We thank Roger Blandford, Konrad Kuijken, Jean-Pierre Marquart, Penny Sackett and Jane Dennett-Thorpe for critical discussions during the course of this work. We also thank the participants of the ‘Microlensing 2000’ conference for positive feedback. LVEK and AGdeB acknowledge the support from an NWO program subsidy (grant number 781-76-101). This research was supported in part by the European Commission, TMR Program, Research Network Contract ERBFMRXCT96-0034 ‘CERES’.
References
Browne, et al., 1997, in Cosmology with the new radio surveys, eds. M. Bremer and Jackson, N. J., p305
Fiedler, R. L., Dennison, B., Johnston, K. J. & Hewish, A. 1987, Nature, 326, 675
Irwin, M. J., Hewett, P. C., Corrigan, R. T., Jedrzejewski, R. I. & Webster, R. L. 1989, AJ, 98, 1989
Jackson, N., et al. 1995, MNRAS, 274, L25
Koopmans, L. V. E., de Bruyn, A. G. & Jackson, N. 1998, MNRAS, 295, 534
Koopmans, L. V. E., de Bruyn, A.G., Xanthopoulos, E., Fassnacht, C.D. 2000, A&A, 356, 391
Koopmans, L. V. E. & de Bruyn, A. G. 2000, A&A, in press, astro-ph/0004112 [KdB00]
Lähteenmäki, A., Valtaoja, E. & Wiik, K. 1999, ApJ, 511, 112
Narayan, R. 1992, Phil. Trans. Roy. Soc., 341, 151
Pelt, J., Kayser, R., Refsdal, S. & Schramm, T. 1996, A&A, 305, 97
Press, W. H., Rybicki, G. B. & Hewitt, J. N. 1992, ApJ, 385, 416
Taylor, J. H. & Cordes, J. M. 1993, ApJ, 411, 674
Vermeulen, R. C. & Cohen, M. H. 1994, ApJ, 430, 467