Observations of the supernova remnant W28 at TeV energies
Abstract
The atmospheric Čerenkov imaging technique has been used to search for point-like and diffuse TeV gamma-ray emission from the southern supernova remnant, W28, and surrounding region. The search, made with the CANGAROO 3.8 m telescope, encompasses a number of interesting features, the supernova remnant itself, the EGRET source 3EG J18002338, the pulsar PSR J180123, strong 1720 MHz OH masers and molecular clouds on the north and east boundaries of the remnant. An analysis tailored to extended and off-axis point sources was used, and no evidence for TeV gamma-ray emission from any of the features described above was found in data taken over the 1994 and 1995 seasons. Our upper limit ( TeV) for a diffuse source of radius 0.25∘ encompassing both molecular clouds was calculated at 6.64 cm-2s-1 (from 1994 data), and interpreted within the framework of a model predicting TeV gamma-rays from shocked-accelerated hadrons. Our upper limit suggests the need for some cutoff in the parent spectrum of accelerated hadrons and/or slightly steeper parent spectra than that used here (2.1). As to the nature of 3EG J18002338, it possibly does not result entirely from decay, a conclusion also consistent with its location in relation to W28.
Key Words.:
Gamma rays: observations - supernova remnants: individual: W281 Introduction
Supernova remnants (SNRs) have long been thought to be the dominant source of cosmic rays (CR) at energies below 100 TeV (for a review see e.g. Blandford & Eichler Blandford:1 (1987)). SNR, via the diffusive shock process, are able to accelerate electrons and hadrons and meet the energetics of the observed cosmic rays. The TeV gamma-ray flux predicted from SNR is the most accessible tracer of CR acceleration and its detection would be convincing evidence for the SNR origin of galactic CR. Models of the TeV gamma-ray emission from SNR predict distinct spectral features, according to the hadronic and/or electronic nature of the parent CR accounting for the gamma-ray flux (see Drury et al. Drury:1 (1994), Naito and Takahara Naito:1 (1994), Baring et al. Baring:1 (1999), and references therein for a summary).
Ground-based surveys of SNR at gamma-ray energies (TeV to PeV) have been carried out on several promising northern hemisphere candidates (e.g. IC443, Tycho’s SNR, W51, W44, G78.22.1). The Whipple (Buckley et al. Buckley:1 (1998), Lessard et al. Lessard:1 (1999)), HEGRA (Hess et al. Hess:1 (1997) at TeV energies, and Prosch et al. Prosch:1 (1996) at multi-TeV energies), CAT (Goret et al. Goret:1 (1999)) and CYGNUS (Allen et al. Allen:1 (1995)) groups have reported upper limits. Recently however, the HEGRA has seen marginal evidence for TeV gamma-rays from the young SNR Cas-A, after deep observation (Pühlhofer et al. Puhlhofer:1 (1999)). In the southern hemisphere, the CANGAROO has reported the detection of TeV gamma-rays from SNR SN1006 (Tanimori et al. Tanimori:1 (1998)) and SNR RX J1713.73946 (Muraishi et al. Muraishi:1 (2000)), and if confirmed, will be strong evidence in favour of the production of cosmic rays electrons in SNR.
W28 (also SNR G6.40.1 from Green Green:1 (1998)) is considered an archetypal composite (mixed or M-type) supernova remnant, characterised by a centrally filled X-ray and shell-like radio morphology (Rho & Petre Rho:1 (1998), Long et al. Long:1 (1991)). The ROSAT X-ray emission appears best explained by a thermal model (Rho et al. Rho:2 (1996)) although Tomida et al. (Tomida:1 (1998)) from the analysis of ASCA data, has suggested the presence of a weak a non-thermal component in the south west region. The limb-brightened radio emission (20, 6 & 2cm) shows a synchrotron spectrum of varying spectral index (Andrews et al. Andrews:1 (1983)). A radio point source at (G6.60.1) is defined (Altenhoff et al. Altenhoff:1 (1978), Andrews et al. Andrews:1 (1983)), hereafter referred as A83 in this paper. A glitching radio pulsar, PSR J180123 (PSR B1758, 416ms, ss-1), lies at the northern radio edge (Kaspi et al. Kaspi:1 (1993)). An upper limit to this pulsar’s characteristic age is estimated at 58 000 years, and it’s spin-down luminosity ( erg s-1) is at the lower edge of luminosity values when compared to the known gamma-ray (EGRET & COMPTEL) pulsars.
The age of W28 is estimated (Kaspi et al. Kaspi:1 (1993)) in the range 35 000 to 150 000 years, with upper and lower limits taken from the assumptions that W28 is currently in either the radiative or Sedov phases of expansion. According to Kaspi et al. Kaspi:1 (1993), the distance of PSR J180123 (9 to 16.5 kpc) derived from it’s dispersion measure (DM) appears inconsistent with that derived for the remnant. Estimates for the remnant distance are set at 1.8 kpc (Goudis Goudis:1 (1976) -D relation) and 3.3 kpc respectively (Lozinskaya Lozinskaya:1 (1981), from mean optical velocities), indicating that the pulsar/W28 association is possibly a line-of-sight coincidence. However, Frail et al. (Frail:1 (1993)) have noted the large uncertainty in using the DM as a distance estimate for this pulsar due to the high concentration of ionised material in the line of sight, and conclude there is sufficient evidence for the pulsar/remnant association. The unidentified EGRET source 3EG J18002338 (95% error circle 0.32∘ radius) (Hartman et al. Hartman:1 (1999)), listed as 2EG J18012312 in the second EGRET catalogue (Thompson et al. Thompson:1 (1996)), lies on the edge of the radio shell and was thought to be associated with the remnant (Esposito et al. Esposito:1 (1996), Zhang & Cheng Zhang:1 (1998)). 3EG J18002338 has a relatively hard spectral index (Hartman et al. Hartman:1 (1999)) with no apparent sign of a turnover at 1 GeV (Merck et al. Merck:1 (1996)). Lamb & Macomb (Lamb:1 (1997)) also point out that 3EG J18002338 is visible above 1 GeV at 5.4 significance, and is centred very close to the A83 radio position. The 3EG position of the EGRET source is displaced by about 0.5∘ relative to the 2EG position, yet still lies comfortably within the SNR radio shell, and remains a strong example of an EGRET source/SNR association (Romero et al. Romero:1 (1999)). The 3EG error circle however, now excludes PSR J180123 and the molecular clouds.
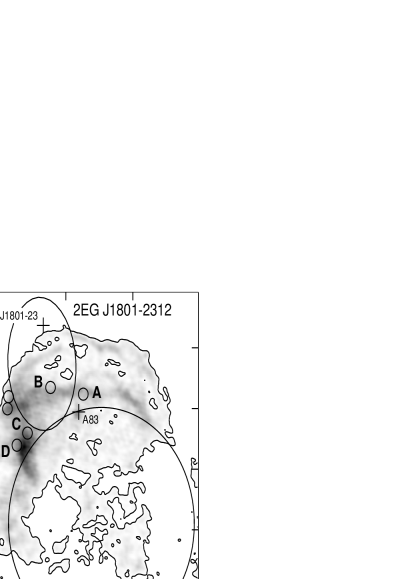
W28 lies in a complex region of the galactic plane with many HII regions and dense molecular clouds (Wootten Wootten:1 (1981)) contributing to the ISM surrounding the SNR. Over forty OH (1720 MHz) maser emission sites are concentrated at the eastern and northern edges of the SNR (Claussen et al. Claussen:1 (1997)), along the SNR and molecular cloud interface. The distribution of shocked and unshocked gas in this region is also consistent with the idea of the SNR shock passing through the cloud (Arikawa et al. Arikawa:1 (1999)). OH maser emission (1720 MHz) is considered a strong indicator of collisional pumping with matter densities cm-3 (Claussen et al. Claussen:1 (1997, 1999)). Enhanced levels of TeV -ray emission via the decay of neutral pions may be expected from such areas associated with the masers and molecular cloud (Aharonian et al. Aharonian:1 (1994)). Fig. 1 indicates the sites of interest in relation to the radio continuum emission (327 MHz). The presence of these interesting objects make W28 a prime southern hemisphere candidate for study at TeV gamma-ray energies.
We report here on the comprehensive analysis of data taken in 1994 and 1995 with the CANGAROO 3.8 metre telescope. This work follows analysis of data taken in 1992 (Kifune et al. Kifune:1 (1993)) in which weak evidence for a gamma-ray signal was reported. At that time, only ON source data were collected, making an estimation of the background rate difficult. Mori et al. (Mori:1 (1995)) reported briefly on an analysis of 1994 data centred on PSR J1801, in which a field of view was searched. Both ON and OFF source data were collected and no evidence for TeV -ray emission was seen from various point-like sources including the pulsar and both radio and X-ray maxima. The 1995 data were centred on the radio position A83, located away from PSR J1801. A search for point-like and diffuse sources of TeV emission was carried out on the 1994 and 1995 datasets out to from the tracking centre of each dataset, using an extended source analysis. We have used an improved set of cuts to those used in the analysis of data taken on the Vela Pulsar/Nebula (Yoshikoshi et al. Yoshikoshi:1 (1997)). These cuts were designed to minimise the loss of gamma-ray sensitivity for off-axis sources and in particular maintain reliable statistics over the search region.
2 The CANGAROO 3.8m telescope
The CANGAROO 3.8 m imaging telescope is located near Woomera, Australia (E, S, 160m a.s.l.). The 3.8 metre diameter mirror, of focal length 3.8 metres, is used to image the Čerenkov emission from gamma-ray and cosmic-ray induced extensive air showers (EAS) onto a high resolution multi-phototube camera. The camera consisted of 224 photomultiplier tubes in 1994. In April 1995 an extra 32 tubes were added to the corners of the camera bringing the total to 256 tubes in a 1616 square grid arrangement. However the extra corner tubes have not been used in the analysis of the 1995 W28 dataset in order to retain consistent imaging properties with the 1994 dataset. Each camera tube is a Hamamatsu R2248 with a photocathode size 0.12 on a side, and the total field of view of the camera is 2.9∘. An event trigger is registered when the summed output of triggered tubes exceeds a preset threshold, denoted HSUM. Images with a minimum of between 35 tubes, depending on the image’s compactness, trigger the telescope. A vertical event rate due to cosmic rays of 2 Hz is achieved. Monte Carlo simulations of the telescope indicate an gamma-ray energy threshold of 1.5 TeV at the vertical (Roberts et al. Roberts:1 (1998)), where the energy threshold is defined as that representing the half-maximum of the differential distribution of triggered energies. Tracking calibration is performed by monitoring the paths of bright (visual mag. 3–6) stars in the field of view, providing an absolute tracking accuracy of (Yoshikoshi Yoshikoshi:2 (1996)). A more detailed technical description of the telescope appears in Hara et al. (Hara:1 (1993)).
Data are recorded on clear moonless nights. An ON source run is generally followed by an OFF source run displaced in right ascension to provide a background run of matching zenith and azimuth angle distributions. However, since small sections of data from both observation seasons were removed due to cloud effects, a normalisation, described later, was used in estimating the statistical significance of any ON source excess. Pulse charge (ADC) and timing (TDC) information for each tube is recorded for each event. Calibration of the ADCs and TDCs is achieved by recording events triggered with a blue LED flasher before each observation. Tube signals are accepted as part of an image if they meet a number of criteria:
-
1.
The TDC value of a tube must lie between ns, referenced against the event trigger time. The event trigger time is registered when the HSUM threshold is met.
-
2.
The ADC value must be greater than one standard deviation above the RMS noise (comprising skynoise and electronic noise) for that tube.
-
3.
The tube must not be isolated. An isolated tube is one which is not adjacent to any other accepted tube.
-
4.
The tube must not have an outlying relative gain value. Tubes with relative gains outside the range 1.00.3 contribute significantly to trigger differences across the camera face. This factor is particularly important when comparing regions over the entire camera face.
The telescope is an altitude-azimuth type, which introduces a rotation of the camera relative to the sky about the tracking position during data collection. A ‘de-rotation’ is applied to the tube positions to account for this effect, and is necessary when considering off-axis sources. The images are parameterised according to the moment-based method of Hillas (Hillas:1 (1985)).
Pre-processing steps designed to minimise the effects of electronic interference are described below. The camera is divided into groups of eight tubes which share common high voltage and other circuitry, and a special cut, box (Yoshikoshi Yoshikoshi:2 (1996)), is designed to remove images arising from electronic contamination, and are concentrated in only one or two tube boxes, This box cut, in combination with a total ADC sum (adc) cut rejecting events with fewer than 200 ADC counts, is very effective at removing such artifacts. Monte Carlo simulations show that the box cut does not reduce the power of the image cuts, and that the optimum adc cut lies at 200 ADC counts.
Mirror degradation resulted in an event rate drop by about a factor of two from 1994 to 1995, indicating a higher energy threshold for the 1995 dataset. The results quoted in this work are normalised to a 1.5 TeV threshold for gamma-rays, using different raw triggering efficiencies for gamma-rays (Sect. 3), which take into account the increase in trigger threshold between 1994 and 1995. In addition, only events with width 0.01 and with the number of triggered tubes, ntubes are accepted. The cuts described above are termed noise cuts.
The ON–OFF statistical significance is calculated following Li & Ma (Li:1 (1983)), before and/or after application of all image cuts.
| (1) |
and is used to assess the likelihood of a gamma-ray signal. In order to account for the mismatch of observation times between ON and OFF source data (and hence zenith angle-dependent event rates), and trigger rate differences due to subtle changes in weather conditions and/or telescope response during observation runs, a normalisation is applied to the ON–OFF statistical significance. This normalisation, is defined as the ratio of the events available for image parametrisation, i.e. after noise cuts. A final systematic check on the ON–OFF statistics after application of all cuts, performed on a run-by-run basis, is explained in Sect. 4.
3 Extended source analysis
The analysis of extended sources has required the development of new techniques in TeV gamma-ray astronomy (Akerlof et al. Akerlof:1 (1991), Hess et al. Hess:1 (1997), Buckley et al. Buckley:1 (1998), Connaugton et al. Connaugton:1 (1998)). These methods use shape parameters such as width and length in combination with source position-dependent orientation and location cuts (e.g. alpha, asymmetry and dis). The orientation and location parameters are recalculated at every trial source position and a skymap is created. In the analysis of CANGAROO Vela Pulsar data, Yoshikoshi et al. (Yoshikoshi:1 (1997)) used a set of cuts based on alpha, length, width, concentration and dis. A continuous probability distribution was initially used to locate the position of the most significant point in the skymap. A gamma-ray flux at this point was then estimated from the ON–OFF excess obtained after using a combination of shape and location cuts with alpha. These cuts were optimised using Monte Carlo simulations and therefore are a priori decisions. We adopt the same a priori philosophy here in order to determine the significance of any result without the need to consider statistical penalties. The set of cuts described here were also used in the analysis of Centaurus A data described by Rowell et al. (Rowell:1 (1999)). The Monte Carlo simulation package, MOCCA92 (Hillas Hillas:3 (1995)), was used to generate Čerenkov images from extensive air showers (EAS). Gamma-ray primaries were sampled from a power law above 0.8 TeV with integral spectral index 1.6. Cosmic ray primaries, represented by a combination of proton, helium and nitrogen primaries, were sampled from a power law of spectral index 1.65 above 1.5 TeV.
In designing an analysis suited to off-axis and extended sources, it is important to consider the off-axis sensitivity of the CANGAROO camera, particularly considering that it has a relatively small field of view and operates at a gamma-ray threshold of about 1.5 TeV. The behaviour of various image parameters as a function of gamma-ray source position has been investigated. A gamma-ray point source was placed at six positions across the camera and each position considered independently. The resulting distributions of width and miss showed little variation with source distance from the camera centre, in contrast to those of length and dis (Fig. 2).


For increasing source distances from the camera centre, larger values of length and dis are possible, behaviour which is readily understood in terms of camera edge effect reduction on one side as the source approaches the camera edge. In particular, the length parameter for gamma-rays is very similar to that for cosmic-rays for sources beyond about 1.0∘ from the camera centre. Indeed, even for on-axis sources, the field of view of the 3.8 m camera imposes some edge effects, a consequence of operating at a relatively high gamma-ray energy threshold. Thus, for off-axis sources, a reduced gamma ray efficiency will result when using cuts derived for an on-axis source.
Firstly, there is a clear case for increasing the gamma-ray efficiency while maintaining the quality factor on the grounds of improved event statistics. An increase in gamma-ray efficiency entails an increase in background acceptance, thus improving an estimate of the background and diluting any unaccounted systematic effects. It is also possible to examine the effect of the gamma-ray efficiency on the ON–OFF significance after cut application. We can express Eq. (1) in another way, incorporating the gamma-ray efficiency, after application of image cuts:
| (2) |
where the gamma-ray signal, (=ON–OFF) and the background, (OFF), represent those prior to image cuts. The efficiency for gamma-ray selection is given by and that for the background (CR), . The quality or Q-factor of the cuts is given by . Here, we set the normalisation factor from Eq. (1), . We can see that the significance obtained after image cuts is dependent on the quality factor and, somewhat slightly, on the gamma-ray cut efficiency. For sources with a high gamma-ray to CR flux ratio (e.g. 0.l) with 4 (as for the CANGAROO telescope), both denominator terms are then similar, the sensitivity of to becomes more apparent. Such a situation may arise in the case of searches for bursts from AGN and/or gamma-ray bursts over short time scales. For signal to noise ratios expected of SNRs such as W28 however, we would expect only a minor improvement in from the above arguement. Thus, the main motivation for increasing here is simply to work with increased statistics.
The variable cuts on length and for dis were incorporated into the cut ensemble. Along with the 3rd moment of the image, asymmetry, we use an approximation of the distance between the assumed source position and calculated source position for each image, . This distance, expressed in units of standard deviation, is given by:-
| (3) |
where are the variances for miss and dis respectively. The variances, and represent the transverse and longitudinal errors in the most likely source position for an image. can be characterised as the source density function (SDF). When used in combination with shape and asymmetry cuts, a cut on provides a gamma-ray acceptance of 40% for an on-axis point source. is similar to the normalised cluster, or Mahalonobis distance for miss and dis (Hillas & West Hillas:2 (1991)), although here we are neglecting cross-term variances. can also be considered a discrete analogue of the probability distribution function used by Yoshikoshi et al. (Yoshikoshi:1 (1997)). The longitudinal error in source location is greater than the transverse error by about a factor of two. Following Akerlof et al. (Akerlof:1 (1991)), some reduction in the longitudinal error can be achieved by making use of the elongation (defined as length/width) of the image such that the expected longitudinal source distance is given by where is an empirically derived constant. For the 3.8 m camera we derive a value of using simulations. Fig. 3 gives distributions of the parameter for simulated gamma-rays and cosmic rays, and a comparison to real OFF source data.

Linear fits were found for the cut on length and value of , respectively, as a function of source displacement from the camera centre. The total cut combination is listed in Table 1.
| Parameter | Range |
|---|---|
| adc | ADC counts |
| box | |
| ntubes | |
| width | 0.01wid0.11 |
| length | |
| asymmetry | 0.0 |
| D | |
| for all | |
These cuts (Table 1) provide a constant gamma-ray efficiency of 40% (and cosmic-ray efficiency) and quality factor 4 at the same value of . Without the variable length and dis criteria, the gamma-ray acceptance quickly reduces to less than 30% for sources outside 0.5∘ from the camera centre for no significant improvement in Q-factor. Table 2 gives the simulated performance of the cut for various source positions. A comparison to the performance obtained by the set of cuts used in the Vela Pulsar analysis (Yoshikoshi et al. Yoshikoshi:1 (1997)) is included. These cuts were used to obtain a significant excess of gamma-ray-like events from a region displaced 0.14∘ from the pulsar position. The Vela Pulsar cuts are based on the same noise cuts listed in Table 1, except that fixed values of length and dis are used and a cut on alpha is substituted for . The Vela Pulsar cuts do not provide a constant gamma-ray acceptance over the search region, and the background (cosmic ray) acceptance also decreases sharply.
| Cuts used in this work (see Table 1) | ||||
|---|---|---|---|---|
| Source Location | gammas | cosmic rays | (%) | |
| 0.0∘,0.0∘ | 4.5 | 868 | 77 | 43 |
| 0.5,0.0 | 4.2 | 708 | 84 | 41 |
| 0.5,0.5 | 3.9 | 591 | 90 | 40 |
| 1.0,0.0 | 4.2 | 522 | 80 | 40 |
| 1.0,1.0 | 4.1 | 375 | 89 | 42 |
| 1.5,0.0 | 4.1 | 370 | 88 | 42 |
| Vela Pulsar Cuts (Yoshikoshi et al. Yoshikoshi:1 (1997)) | ||||
| 0.0,0.0 | 3.6 | 887 | 125 | 44 |
| 0.5,0.0 | 3.5 | 596 | 85 | 35 |
| 1.0,0.0 | 4.3 | 401 | 45 | 31 |
| 1.5,0.0 | 4.8 | 255 | 31 | 29 |
The resulting flux or upper limit from the search is found by dividing the ON–OFF excess, (or 3 upper limit thereof), by the position-dependent exposure (for an extended source, averaged over the integration region):
| (4) |
where is the raw trigger efficiency for gamma-rays averaged over the integration region, is a constant gamma-ray selection efficiency for the SDF cut, is the area over which gamma-rays are simulated ( cm2) and is the total observation time. We set to be the average of the simulated gamma-ray cut efficiencies out to , i.e. = 0.41. An unavoidable decline in for gamma-rays will occur as the source position is displaced further off-axis. Simulations show that decreases to less than half the on-axis value at the corners of the search. A linear fit was used to characterise at all points within such that as a function of the source displacement from the camera centre, . We find (1995 data) at the camera centre above the minimum simulated energy of 0.8 TeV for the 1995 dataset. The raw gamma-ray trigger efficiency for 1994 data was estimated by scaling the 1995 value by the ratio of observed event rates after noise cuts, giving (1994 data). In characterising and , we are assuming that the gamma-ray flux of an extended source is isotropically distributed. To calculate the flux applicable to the energy threshold of 1.5 TeV (Roberts et al. Roberts:1 (1998)) we used the gamma-ray spectral index of –1.6 adopted in the simulations. For a point-like search, the flux was taken as that from the point of interest, using a single value of . The nature of our gamma-ray selection cuts naturally incorporates the gamma-ray point spread function (PSF). The cut on accepts events with derived source positions within an optimal radius. A search for an extended source therefore does not require any extra area to account for the PSF in addition to the source area itself. In an extended source search, at a suitably high number of assumed source positions in the region of interest, we sum the events passing all cuts, taking care not to count an event more than once. Skymaps of the statistical significance, , of a gamma-ray signal were generated over a area at 0.05∘ steps. At each grid point, representing an assumed source position, image parameters were calculated and the number of events passing the cuts of Table 1 cumulatively summed for all data. Since the resolution of the grid (0.05∘), is smaller than the effective acceptance area of the cuts (the cut on alone is more powerful than a cut on alpha10∘), each skymap point value will not be fully independent of its neighbours.
As a final check on data integrity, the distribution of obtained on a run-by-run basis (i.e. run-by-run skymap) was quantitatively assessed for systematic effects. The most important systematic effect to consider in this type of analysis is the consistency of the trigger threshold over the entire camera between ON and OFF source runs. Such an effect is difficult to compensate for after the data are taken. The Kolmolgorov-Smirnoff (KS) test is used to examine the likelihood that the distribution of of the skymap obtained on a run-by-run basis is derived from a normal distribution. Over the time scales of a single run (5 hours), we do not expect significant contributions from a steady source of TeV gamma-rays of the strength expected of a SNR or plerion. A relatively strong KS probability of 4 was used to reject pairs of data that appeared severely affected by such systematics. For unmatched pairs, a well-behaved OFF or ON comparison run was used. A total of 10 hours data were rejected using the KS test, representing three ON/OFF pairs from the 1994 dataset.
4 Results
Table 3 presents a summary of data accepted for analysis from the 1994 and 1995 observing seasons.
| 1994 Data | 1995 Data | |||
| ON | OFF | ON | OFF | |
| Time(hrs) | 20.3 | 23.5 | 37.5 | 30.0 |
| Images | 59909 | 65483 | 97850 | 76595 |
| After noise cuts | 37386 | 40731 | 39354 | 31237 |
| ON, OFF normalisation | 0.92 | 1.26 | ||
| Raw gamma-ray trigger | ||||
| efficiency | 0.21 | 0.12 | ||
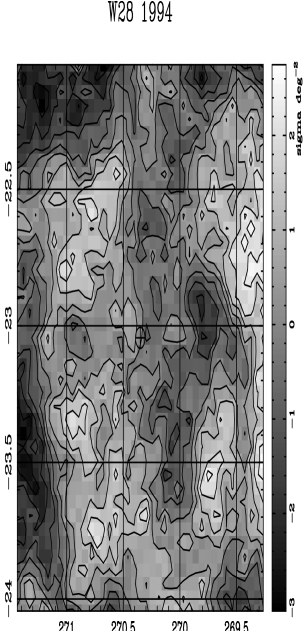
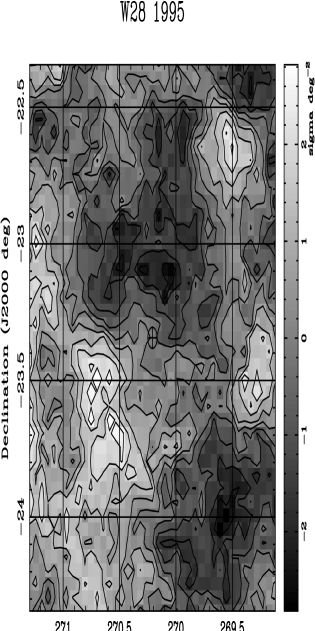
The skymaps of significance (Fig. 4) for both years’ data, do not indicate any significant point-like excesses over a search for -ray emission. Table 4 summarises the 3 upper limits for the positions of a number of interesting sites within the W28 region. It should be pointed out that our results will have a systematic error of the order %, based on uncertainties in the trigger conditions, mirror reflectivity and spectral index adopted in the simulations (Yoshikoshi Yoshikoshi:2 (1996)). For example, in the next section we compare our results to a model producing a gamma-ray flux with spectral index of , harder than the spectrum used in simulations. Such a difference however will contribute a systematic of 5%.
The following positions were considered as potential sources; the position A83 given by Andrews et al. (Andrews:1 (1983)), the pulsar PSR J, the two strongest (by an order of magnitude) masers, labelled E & F by Claussen et al. (Claussen:1 (1997)), and the EGRET source 3EG J18002338. In addition, an extended region of radius 0.25∘ centred on a position to encompass the molecular clouds was considered. An average position was used for the masers E and F since they are separated by only 0.02∘.
| 1994 DATA | 1995 DATA | |||||||||
| RA | Dec | F (1.5 TeV) | F (1.5 TeV) | |||||||
| Source | (J2000) | (J2000) | ON | OFF | cm-2s-1 | ON | OFF | cm-2s-1 | ||
| A83a | 270.21 | 23.34 | 644 | 698 | +0.1 | 3.36 | 632 | 504 | 0.1 | 2.95 |
| Mol. Cloudsb | 270.35 | 23.34 | 2589 | 2843 | 0.3 | 6.64 | 2663 | 2163 | 0.8 | 5.56 |
| PSR J180123c | 270.35 | 23.04 | 644 | 698 | +0.1 | 3.20 | 723 | 587 | 0.4 | 3.32 |
| Masers E & Fd | 270.47 | 23.31 | 765 | 822 | +0.3 | 4.14 | 798 | 643 | 0.3 | 3.47 |
| 3EG J18002338e | 270.12 | 23.65 | 974 | 965 | +2.1 | 8.82 | 804 | 575 | +1.9 | 1.18 |
| 269.80f, 23.59 | 270.43f, 23.74 | |||||||||
| a: Radio point source (Andrews et al. (Andrews:1 (1983)) | ||||||||||
| b: Extended source of radius 0.25∘ encompassing the molecular clouds. | ||||||||||
| c: Point source at pulsar position given by from Kaspi et al. (Kaspi:1 (1993)). | ||||||||||
| d: Point source at average position of 1720 MHz OH maser sites E and F as defined by Claussen et al. (Claussen:1 (1997)). See text. | ||||||||||
| e: Highest pointlike significance within 95% error circle (0.32∘ radius) of EGRET source. Quoted position is that for | ||||||||||
| the error circle centre (Hartman et al. Hartman:1 (1999)). See also below. | ||||||||||
| f: Positions of each pointlike maximum significance within the 3EG error circle. | ||||||||||
In assuming that the EGRET source was point-like, a search for the highest point significance within the 95% error circle was carried out. Since the statistical degrees of freedom for a non-a priori search for point-like emission over the skymap is 100, the highest ON–OFF excess within the EGRET error circle must be interpreted with a similar statistical penalty in mind.
The point spread function (PSF) for a pure gamma-ray signal can be used to assess the location accuracy of the proposed source positions. Monte Carlo simulations show that the PSF for gamma-rays increases slightly from a standard deviation of 0.2∘ on-axis to 0.22∘ for sources at the skymap corners. The positions of our candidate sources (Table 4) lie within 1.0∘ on-axis. Taking a conservative estimate of the PSF as 0.22∘, a simplistic estimate of the source location error is obtained by adding in quadrature 0.22/=0.02∘ to the the absolute tracking precision (0.02∘), giving . We have used a value of 100 which is representative of the 3 upper limit excesses ( in Eq. (4)) calculated here. We can therefore say that the features listed in Table 4 would be resolved by the CANGAROO 3.8m telescope if they were point sources of TeV gamma rays. From Table 4 we can also see that the positions of the highest significance within the EGRET 95% error circle for both year’s data are also not co-located, with their separation, , easily exceeding the estimated PSF.
5 Gamma Ray Production in SNR
SNR shocks are able to accelerate particles to TeV energies. Gamma-rays are produced in secondary reactions between these high energy particles and ambient matter and radiation fields. The decay of , produced in ion-ion collisions, is the prime hadronic source of gamma-rays in SNR. Electrons accelerated to multi-TeV energies in SNR give rise to bremsstrahlung and inverse Compton (IC) scattering -ray production processes in SNR (see e.g. Mastichiadis & de Jager Mastichiadis:1 (1996), Gaisser et al. Gaisser:1 (1998)). The cosmic microwave background (CMB) is usually considered the dominant soft photon source with contributions (10%) from the infrared background as seed photons for the IC process. The detailed model of Baring et al. (Baring:1 (1999)) uses these processes collectively (including synchrotron and bremsstrahlung radiation) to account for observations from radio to TeV gamma-ray energies for the northern SNR, IC443.
The models of Naito and Takahara (Naito:1 (1994)) and Drury et al. (Drury:1 (1994)) give predictions of the TeV gamma ray flux due to decay. As a first attempt at explaining the particle acceleration processes in W28, we make use of the Naito and Takahara model and compare its predictions of the channel to our results. By considering only the production channel, a lower limit on the predicted TeV gamma flux can be estimated. A proton parent spectrum with differential index 2.1 and exponential cutoff at 100 TeV has been assumed (, i.e. consistent with shock acceleration expected in a SNR. The predicted TeV flux will scale according to:
| (5) |
where is the energy available for cosmic ray acceleration, is the particle number density of the ISM (cm-3) and is the distance to the SNR (kpc). is some fraction, typically 10% of the total energy of the SNR (canonically 1051erg). In fact, the total SNR energy for W28 has been estimated by Rho et al. (Rho:2 (1996)) at 4erg from ROSAT X-ray data.
The most interesting question concerns the possibly of enhanced TeV gamma-ray emission from regions of high ISM density (Aharonian et al. Aharonian:1 (1994)), where there is a greater chance for the interaction of cosmic rays from the SNR. The molecular clouds along the northeast and northern remnant boundary have been mapped in detail by Arikawa et al. (Arikawa:1 (1999)) at the CO J=1-0 and J=3-2 lines. The shocked (region undergone passage and compression by the SNR shock) component of the clouds is distributed along the SNR/clouds boundary, has a mean density of cm-3, and mass M⊙. The other 4M⊙ of the unshocked gas has a density of cm-3 and is displaced radially outward from the shocked gas by 1 arcmin. Clearly, any TeV gamma-ray flux from decay would be dominated by the shocked gas regions, given that the unshocked regions of the cloud would have a much lower density and lower energy available for CR production, and the mean matter density for regions excluding the molecular cloud is only 1.3 cm-3 (Esposito et al. Esposito:1 (1996)). Arikawa et al. (Arikawa:1 (1999)) has derived the energy deposited into the shocked gas at ergs, a value consistent with the Rho et al. (Rho:1 (1998)) estimate for the total SNR energy when considering the volume filling factor , between the clouds and the SNR. is simplistically estimated at , by taking the mass and density of the shocked gas (given above), assuming the cloud consists of H2, and a value of 10pc for the SNR radius. We also assume that 10% of the available SNR energy goes into cosmic ray production, a reasonable value for a Sedov-phase SNR, and also consistent with the measured energetics for the SNR and clouds. Thus we adopt values of 3ergs for , and cm-3 for in Eq. (5). A working band on our flux prediction is obtained if we assume a range of values for from 1.8 to 3.3 kpc, as discussed in Sect. 1. In Fig. 5, we compare the model predictions based on the above scalings to our upper limit obtained from an extended source of radius 0.25∘ encompassing the clouds from 1994 data (the highest of our upper limits). The flux from 2EG J18012312 (essentially the same as 3EG J18002338) and its straight extrapolation to TeV energies is also included as any gamma-ray flux will be limited by the EGRET measurement.
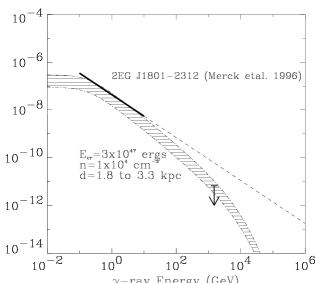
Our upper limit lies an order of magnitude below the straight extrapolation of the flux from EGRET (dashed line of Fig 5), and is able to place some constraint on the prediction of a gamma-ray flux from the shocked gas region. In order to accommodate our upper limit however a cutoff and/or slighter steeper parent spectrum than -2.1 appears necessary. In assuming an exponential cutoff at 100 TeV for the parent spectrum of accelerated hadrons, we assume that W28 follows the ’standard’ picture of particle acceleration in SNR, with particle energies limited by radiative losses, finite age of the shock and particle escape. When the cutoff for electrons is due only to radiative losses however, it can be expected that the hadron spectrum will continue (Reynolds & Keohane Reynolds:1 (1999)). Apart from the long-established ’knee’ at eV in the all-particle cosmic ray spectrum there is now direct experimental evidence pointing to a continuation of the proton/helium spectra up to at least TeV (Asakimori et al. Asakimori:1 (1998)), implying that strong cutoffs may not be required. Our result here is consistent however, with previous comparisons of upper limits (from other SNRs) to hadron-induced gamma-ray models (e.g. Buckley et al. Buckley:1 (1998), Allen et al. Allen:1 (1995) and Prosch et al. Prosch:1 (1996)) which seem to require some cutoff below the knee energy/and or spectra steeper than -2.1. Further constraints may arise if electronic components are considered. Particularly, electronic bremsstrahlung may dominate over the inverse Compton component due to the very high density of target matter in the clouds.
The above discussion aside, the location of 3EG J18002338 by itself, makes it’s interpretation difficult in terms of simple CR-matter interaction, or as the result of a pulsar-powered process (proposed by Merck et al. Merck:1 (1996)). Many of the promising sites within W28 for gamma-ray production are now outside the 95% error circle, leaving just the filled X-ray centre, and southern/western portions of the radio shell. At best, we are in a position to rule out the interpretation of the EGRET source as resulting totally from decay gamma-rays with an unlimited parent spectrum, and to place limits on the parent spectral index/cutoff energy combination.
6 Conclusion
A search for TeV gamma-ray emission from the southern SNR W28 was carried out by the CANGAROO over two observation seasons (1994 and 1995) using the atmospheric Čerenkov imaging technique. An analysis providing a consistent gamma-ray acceptance and quality factor for extended sources was used. A number of sites within a search region of were considered as potential point-like and diffuse sources of TeV gamma-ray emission. No evidence was found for the emission of TeV gamma-rays at any of these sites which include those from the strongest two masers, an EGRET source, a radio pulsar (all as point sources) and a diffuse region containing the molecular clouds that appear to be interacting with the remnant. Our 3 upper limit from this diffuse region at 6.64 cm-2s-1 TeV, and the flux of the EGRET source 3EG J18002338 were compared with gamma-ray flux predictions from the model of Naito and Takahara (Naito:1 (1994)). Under this framework, our upper limit rules out a straight extrapolation of the EGRET flux to TeV energies. It also constrains somewhat the flux expected from the shocked region of gas in the molecular cloud, placing limits on the parent spectra for hadrons and/or cutoff energy. Our results suggest that the EGRET source probably does not result entirely of gamma-rays. This fact is supported by it’s location in relation to the molecular clouds. In a later paper, we will consider electronic bremsstrahlung and inverse Compton scattering and discuss the broader implications of our results in relation to the origin of galactic cosmic rays.
Further data on W28 will no doubt be taken with the recently completed CANGAROO II telescope (Yoshikoshi et al. Yoshikoshi:3 (1999)), which, at the very least will provide tighter constraints on models of gamma-ray production for this interesting source.
Acknowledgements.
This work is supported by a Grant-in-Aid in Scientific Research from the Japanese Ministry of Science, Sports and Culture, and also by the Australian Research Council. GR, JH, MR & TY acknowledge the receipt of JSPS postdoctoral fellowships. We also thank an anonymous referee for valuable comments.References
- (1) Akerlof C.W., Cawley M.F., Chantell M., et al 1991, ApJ 377, L97
- (2) Allen G.E., Berley D., Biller S., et al 1995, ApJ 448, L25
- (3) Altenhoff W.J., Downes D., Pauls T., et al 1978, A&AS 35, 23
- (4) Aharonian F., Drury L. O’C., Völk H.J., et al. 1994, A&A 285, 645
- (5) Andrews M.D. Basart J.P., Lamb R.C., et al. 1983, ApJ 266, 684
- (6) Arikawa Y., Tatematsu K., Sekimoto Y., Takahashi T. 1999, Proc. Astron. Soc. Jap. 51, L7
- (7) Asakimori K., Burnett T.H., Cherry M.L., et al 1998, ApJ. 502, 278
- (8) Baring M.G., Ellison D.C., Reynolds S.P., Grenier I.A., Goret P. 1999, ApJ, 513 311
- (9) Blandford R., Eichler D. 1987, Phys. Rep. 154, 1
- (10) Buckley J.H., Akerlof C.W., Carter-Lewis D.A., et al. 1998, A&A 329, 639
- (11) Claussen M.J., Frail D.A., Goss W.M., Gaume R.A. 1997, ApJ 489, 143
- (12) Claussen M.J., Goss W.M., Frail D.A., Desai K. 1999, ApJ 522, 349
- (13) Connaugton V., Akerlof C.W., Biller S., et al. 1998, Astropart. Phys. 8, 179
- (14) Drury L. O’C, Aharonian F., Völk H.J. 1994, A&A 287, 959
- (15) Esposito J.A., Hunter S.D., Kanbach G., Sreekumar P. 1996, ApJ 461, 820
- (16) Frail D.A., Kulkarni S.R., Vasisht G. 1993, Nat. 365, 136
- (17) Gaisser T.K., Protheroe R.J., Stanev T. 1998, A&A. 492, 219
- (18) Goret P., Gouiffes C., Nuss E., et al. 1999, Proc. 26th Int. Cosmic Ray Conf. (Salt Lake City) 3, 496
- (19) Goudis C., 1976, Ap&SS 40, 91
- (20) Green D.A., 1998, ‘A Catalogue of Galactic Supernova Remnants (1998 September version)’, Mullard Radio Astronomy Observatory, Cambridge, United Kingdom (available on the World-Wide-Web at http://www.mrao.cam.ac.uk/surveys/snrs/).
- (21) Hara T., Kifune T., Matsubara Y., et al 1993, Nucl. Inst. Meth. 300, A332
- (22) Hartman R.C., Bertsch D.L., Bloom S.D., et al 1999, ApJS 123, 79
- (23) Hess M. 1997, Proc. 25th Int. Cosmic Ray Conf. (Durban) 3, 229
- (24) Hillas A.M. 1985, Proc. 19th Int. Cosmic Ray Conf. (La Jolla) 3, 445
- (25) Hillas A.M., West M. 1991, Proc. 22nd Int. Cosmic Ray Conf. (Dublin) 1, 472
- (26) Hillas A.M. 1995, Proc. 24th Int. Cosmic Ray Conf. (Rome) 1, 270
- (27) Kaspi V.M., Lyne A.G., Manchester R.N., et al 1993, ApJ 409, L57
- (28) Kifune T. 1993, Proc. 23rd Int. Cosmic Ray Conf. (Calgary) 1, 444
- (29) Lamb R.C., Macomb D.J. 1997, ApJ 488, 872
- (30) Lessard R.D., Bond I.H., Boyle P.J., et al 1999, Proc. 26th Int. Cosmic Ray Conf. (Salt Lake City) 3, 488
- (31) Li T., Ma Y. 1983, ApJ 272, 317
- (32) Long K.S., Blair W.P., White R.L., Matsui Y., 1991, ApJ 373, 567
- (33) Lozinskaya T.A. 1981 Sov Astron Lett 7, 17
- (34) Mastichiadis A., de Jager O.C. 1996, A&A 311, L5
- (35) Merck M., Bertsch D.L., Dingus B.L., et al 1996, A&AS 120, 465
- (36) Mori M. 1995, Proc. 24th Int. Cosmic Ray Conf. (Rome) 4, 487
- (37) Muraishi H., Tanimori T., Yanagita S., et al 2000, A&A in press
- (38) Naito T., Takahara F. 1994, J Phys G: Nucl Part Phys 20, 477
- (39) Prosch C., Feigl E., Plaga, R., et al 1996, A&A 314, 275
- (40) Pühlhofer G., Völk H., Wiedner C.A., et al 1999, Proc. 26th Int. Cosmic Ray Conf. (Salt Lake City) 3, 492
- (41) Reynolds S.P., Keohane J.W. 1999, ApJ 525, 368
- (42) Rho J.H., Petre R. 1998, ApJ 503, L167
- (43) Rho J.H., Petre R., Pisarski R., Jones L.R. 1996, MPE Report 263, 273
- (44) Roberts M.D., McGee P., Dazeley S.A., et al 1998, A&A 337, 25
- (45) Romero G.E., Benaglia P. and Torres D.F. 1999, A&A 348, 868
- (46) Rowell G.P. Dazeley S.A., Edwards P.G., et al 1999, Astropart. Phys. 11, 217
- (47) Tanimori T., Hayami Y., Kamei S. et al 1998, ApJ 492, L33
- (48) Thompson D.J., Bertsch D.L., Dingus B.L., et al 1996, ApJS 107, 227
- (49) Tomida H. 1998, Genshikaku Kenkyu 42, 123, in Japanese
- (50) Wootten A. 1981, ApJ 245, 105
- (51) Yoshikoshi T. 1996, PhD. thesis, Tokyo Institute of Technology.
- (52) Yoshikoshi T., Kifune T., Dazeley S.A., et al 1997, ApJ 487, L65
- (53) Yoshikoshi T., Dazeley S.A., Gunji S., et al 1999, Astropart. Phys. 11, 267
- (54) Zhang I., Cheng K.S. 1998, A&A 335, 234