An Extended View of the Fornax Cluster
Abstract
The Multibeam survey at the Parkes Radio Telescope has provided a wealth of 21 cm HI data. We have mosaicked ten standard HIPASS cubes to produce a datacube approximately 25∘25∘ in size, centred on NGC1399, the optical centre of the Fornax Cluster. Some properties of the initial 80 galaxies identified in HI are described.
In the optical, Ferguson’s Fornax Cluster Catalogue (FCC) (Ferguson 1989) identified 340 likely member galaxies in the central 40 deg2. In the radio we have detected a more uniform sheet of about 80 galaxies at the cluster velocity extending up to 15∘ from the cluster centre. At the cluster distance of about 15 Mpc, this corresponds to an elongated structure more than 7 Mpc in extent.
Galaxies were detected to a lower mass limit of M⊙ and fewer than 25 of these were within the central 40 deg2, suggesting considerable HI depletion of galaxies in the centre of the cluster. Further, these results strongly indicate that HI surveys do not readily identify galaxy clusters.
School of Physics, University of Melbourne, Victoria, 3010, Australia
1. Introduction: The Fornax Cluster
The Fornax Cluster is amongst the closest and most well studied clusters in the southern sky, providing a rich nearby field for the study of galaxy populations, dynamics and evolution in the cluster environment.
Covering an area of nearly 40 deg2, Ferguson’s optical catalogue (Ferguson 1989) identified 340 “likely cluster members”, only 85 of which had redshifts. Cluster membership was largely assigned on the basis of morphology and surface brightness (SB), suggesting a bias whereby high SB compact galaxies, paricularly unusual dwarf galaxies, may have been rejected as “stars” and any extended low surface brightness (LSB) galaxies incorrectly assigned a “background” status (Disney 1976).
Using the Tully-Fisher relation in Fornax, Bureau et al. (1996) determined the cluster distance to be 15.4 2.3 Mpc. Recessional velocities of Fornax cluster galaxies range from about 700 km to 2200 km (Barnes et al. 1997). Very few galaxies have been detected in front of the cluster or in the void behind the cluster in the region 2200–4500 km . Galaxies beyond about cz = 3000 km would not be classified as likely cluster members (Drinkwater & Gregg 1998).
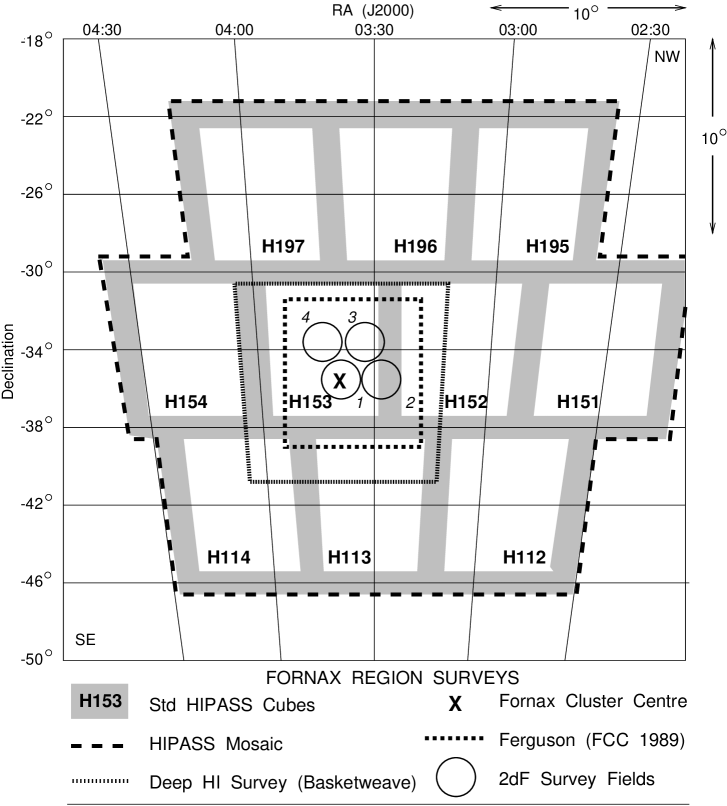
The fields covered by several surveys of the Fornax cluster are illustrated in Figure 1, including the unbiased spectroscopic Two Degree Field (2dF) Survey which is surveying all objects in the magnitude limits 16.5 19.7 in a 12 deg2 region (Drinkwater et al. 2000a). The positions of the 10 HIPASS cubes used to compile our mosaic are shown. The deep neutral hydrogen survey covering 10∘10∘ in a “basket-weave” pattern has recently been completed and new detections not found in HIPASS have already been identified (see Drinkwater et al. in these proceedings).
Also, a spectrographic survey centred on Fornax using the FLAIR instrument on the UK Schmidt Telescope (not shown here) is identifying bright compact objects over a 6∘6∘ field in this region (Drinkwater & Gregg 1998).
2. Our Data: HIPASS Mosaic
Ten standard HIPASS cubes were used to create our 25∘25∘ mosaic. HIPASS detects HI emission over the velocity range -128012700 km , has an angular resolution of 15 arcmin, a velocity resolution of 18 km and a 1 sensitivity of approximately 13 mJy beam-1 (Barnes et al. 2000). At the distance of Fornax, this corresponds to a lower detectable HI mass limit of M⊙.
After masking the edges of the mosaic, an automated galaxy finder (Kilborn 2000) was applied to the data. At a lower cutoff of 3 in peak flux (corresponding to about 33 mJy), the galaxy finder produced a first list of 400 or so candidate detections by position and peak flux over a velocity range of 300–3700 km . This list was easily culled to remove known interference-generated “detections” (derived from known telescope correlator interference) and to group duplicates together, leaving a list of 87 possible detections, each of which was confirmed by eye in the mosaic.
For each candidate detection, the miriad software package was employed to establish an accurate position, spectral profile and other standard parameters. The NASA databases NED and DSS were searched for likely optical counterparts to within a maximum 10 arcmin radius (although positional matches could be expected to be within 6 arcmin).
We have confirmed approximately 80 HI detections, including several without an apparent optical counterpart, and several more with more than one object in the Parkes beam in the DSS images. New velocity measurements have been determined for 8 previously identified galaxies.
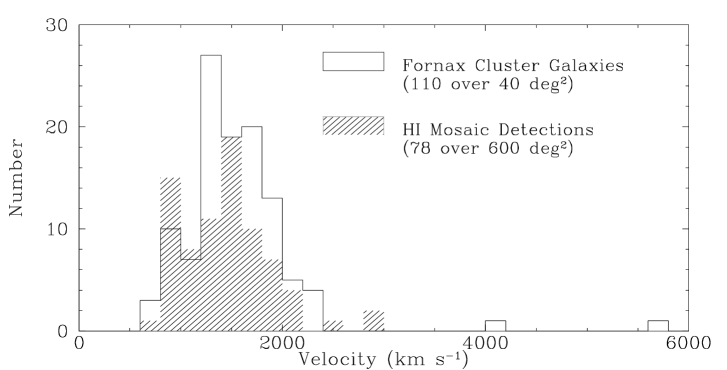
Velocity histograms for 110 optical galaxies in the Fornax Cluster (area 40 deg2) and for 78 HI detections in our mosaic (area 600 deg2) are plotted in Figure 2. The optical identifications include both those listed in the Fornax Cluster Catalogue and those subsequently added by the FLAIR surveys (Drinkwater et al. 2000b).
3. Large-scale Structure around Fornax
In Figure 3, the positions of the HI detections relative to the Fornax centre are shown. Large-scale structure (LSS) is also evident in Figure 4, where the galaxies appear to be in a long sheet-like arrangement in which the velocity widths of the galaxies are comparable to the velocity dispersion of the whole group. Our results indicate that there is a slight velocity gradient, from SE to NW, across the formation, as is suggested in Figures 3 and 4.

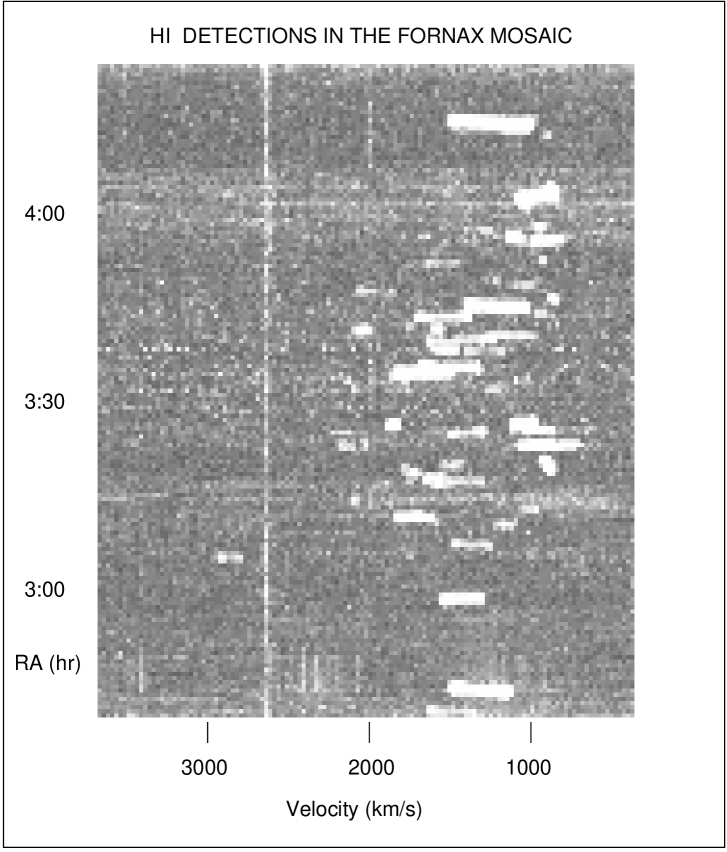
HIPASS is a survey biased towards the detection of HI-rich objects. As is evident in Figure 3, the Fornax cluster of galaxies at the centre of the mosaic field is not clearly distinguished in this survey. Only 5 (less than 7%) of the HI detections are within the central 2.4∘ radius core of the cluster and fewer than about 30% of detections are within the boundary of the Fornax Cluster Catalogue region. This would suggest considerable HI depletion in the cluster galaxies, possibly due to tidal stripping, ram pressure stripping, star formation and/or other mechanisms.
Our results clearly indicate that HIPASS is not a survey which will preferentially detect galaxy clusters.
4. HI Mass Distribution
The HI mass (MHI) of each detection was estimated using the standard formula (Verschuur & Kellermann 1988). For MHI calculations, all detections were assumed to be at the cluster distance of 15.4 Mpc. Where known, the blue magnitude values () given in NED were used for mass-to-light ratio (MHI/L) estimations. Again, all detections were assumed to be at the same distance. Note that the NED values have errors of 0.5 in the total blue magnitude (Marquarding 2000).
At least 60% of our initial detections have MHI less than M⊙ and as many as 50% are dwarfs with an HI mass of less than 5108 M⊙.
In Figure 5 it can be seen that it is predominantly the low mass galaxies which have MHI/L ratios greater than 1–2 M⊙/L⊙. The higher mass galaxies are presumably depleted of HI by a higher level of past or current star formation.

5. Summary
A mosaic of 10 standard HIPASS cubes, spanning about 25∘25∘ and centred on the Fornax Cluster, has been created and efficiently searched using an automated galaxy finder.
Fewer than about 30% of the detections are within the central 40 deg2 of the cluster, suggesting considerable HI depletion of galaxies in the cluster. Further, our results show that HI surveys do not readily detect galaxy clusters.
Down to a lower MHI limit of M⊙, many low HI mass galaxies were detected. Initial results indicate that generally only low MHI galaxies have high HI mass-to-light ratios (MHI/L). New velocities of at least 8 objects have been measured. Interestingly, several HI detections do not have optical counterparts.
Our initial 80 confirmed HI detections have revealed that the Fornax Cluster is imbedded in a large-scale structure more than 7 Mpc in extent and evidence of a velocity gradient across the LSS is seen.
Acknowledgments.
Many thanks to Virginia Kilborn for her generous assistance and use of her “galaxy finder” program.
References
Barnes, D.G. et al. 2000, MNRAS, in press
Barnes, D.G., Staveley-Smith, L., Webster, R.L., & Walsh, W. 1997, MNRAS, 288, 307
Bureau, M., Mould, J.R., & Staveley-Smith, L. 1996, ApJ, 463, 60
Disney, M.J. 1976, Nature, 263, 573
Drinkwater, M.J. et al. 2000a, A&A, in press
Drinkwater, M.J., & Gregg M.D. 1998, MNRAS, 296, L15
Drinkwater, M.J., Gregg, M.D., Holman, B.A., & Brown, M. 2000b, MNRAS, in preparation
Ferguson, H.C. 1989, AJ, 98, 367
Kilborn, V. 2000, PhD Thesis, in preparation
Marquarding, M. 2000, MSc Thesis, in preparation
Verschuur, G. & Kellermann, K. ed. 1988, Galactic and Extragalactic Radio Astronomy, 2nd ed, Springer-Verlag, New York, 525