X-ray Sources in the Hubble Deep Field Detected by Chandra
Abstract
We present first results from an X-ray study of the Hubble Deep Field North (HDF-N) and its environs obtained using 166 ks of data collected by the Advanced CCD Imaging Spectrometer (ACIS) on board the Chandra X-ray Observatory. This is the deepest X-ray observation ever reported, and in the HDF-N itself we detect six X-ray sources down to a 0.5–8 keV flux limit of erg cm-2 s-1. Comparing these sources with objects seen in multiwavelength HDF-N studies shows positional coincidences with the extremely red object NICMOS J123651.74 +621221.4, an active galactic nucleus (AGN), three elliptical galaxies, and one nearby spiral galaxy. The X-ray emission from the ellipticals is consistent with that expected from a hot interstellar medium, and the spiral galaxy emission may arise from a ‘super-Eddington’ X-ray binary or ultraluminous supernova remnant. Four of the X-ray sources have been detected at radio wavelengths. We also place X-ray upper limits on AGN candidates found in the HDF-N, and we present the tightest constraints yet on X-ray emission from the SCUBA submillimeter source population. None of the 10 high-significance submillimeter sources reported in the HDF-N and its vicinity is detected with Chandra ACIS. These sources appear to be dominated by star formation or have AGN with Compton-thick tori and little circumnuclear X-ray scattering.
1 Introduction
The Hubble Deep Field North (HDF-N; Williams et al. 1996, hereafter W96) provides an unprecedented view of the distant Universe, and the incredible amount of work focused on this patch of sky has led to fundamental insights about the formation and evolution of galaxies. Intense follow-up studies have been performed at a variety of wavelengths including the radio, submillimeter, far-infrared, near-infrared, and optical bands; these investigations have discovered a fascinating array of cosmic objects. Notably lacking until now, however, is a deep X-ray survey of this area.666The only previous pointed X-ray observation of the HDF-N was a 21 ks exposure made with the ROSAT High Resolution Imager (HRI). No X-ray sources in the HDF-N were detected due to the limited sensitivity of this observation, and to our knowledge the ROSAT results have never been published. X-ray surveys provide the most direct and unbiased probe of massive black hole accretion activity throughout the Universe. This is particularly true in the hard X-ray band above 2 keV where most of the energy density of the extragalactic X-ray background (XRB) resides. In addition, X-ray surveys allow studies of starburst galaxies, elliptical galaxies, clusters and groups of galaxies, and other objects. Early observations with the Chandra X-ray Observatory (hereafter Chandra; Weisskopf, O’Dell & van Speybroeck 1996) have resolved much ( 60–75%) of the 2–8 keV XRB into point sources (Brandt et al. 2000; Mushotzky et al. 2000); an even higher fraction ( 70–80%) of the 0.5–2 keV X-ray background had already been resolved by ROSAT (e.g., Hasinger et al. 1998). The key goals now remaining are to resolve the rest of the XRB and to understand in detail the nature and evolution of the sources creating it.
In this letter, we present first results from a deep X-ray survey of the HDF-N area using the Chandra Advanced CCD Imaging Spectrometer (ACIS; G.P. Garmire et al. 2000, in preparation). We focus on X-ray sources in the HDF-N itself and in its immediate vicinity where substantial follow-up work has already been performed. The Galactic column density along this line of sight is cm-2 (Stark et al. 1992), and km s-1 Mpc-1 and are adopted.
2 Chandra ACIS Observations and Data Analysis
The field containing the HDF-N was observed with the Chandra ACIS for a total exposure time of 166 ks in three segments on 1999 November 13 (50 ks), 1999 November 14 (58 ks), and 1999 November 21 (58 ks). The HDF-N was placed near the aim point for the ACIS-I array on CCD I3 during all three observations. The full ACIS-I field of view is , and the on-axis image quality is FWHM. The observations were corrected for the radiation damage the CCDs suffered during the first few weeks of the mission (Prigozhin et al. 2000; Hill et al. 2000) following the procedure of Townsley et al. (2000), which corrects simultaneously for both position-dependent gain shifts and event grade changes. The three exposures were then co-added after cross-registration using bright sources near the optical axis; we believe cross-registration to be accurate to within . Absolute X-ray source positions are accurate to within (see §3.1).
We created images from 0.5–8.0 keV (full band), 0.5–2.0 keV (soft band) and 2–8 keV (hard band) for further study, and we use ASCA event grades 0, 2, 3, 4 and 6 in all analyses. We searched these images with the wavdetect software (Dobrzycki et al. 1999; Freeman et al. 2000) using the same methods and safety checks as Brandt et al. (2000). We have used a probability threshold of , and light curve analyses verify that none of the X-ray sources discussed below is affected by a ‘flaring pixel’ problem (Chandra X-ray Center, private communication). All of the sources below are consistent with being pointlike, although the constraints are not tight in most cases due to limited numbers of photons. Even with a 166 ks observation the data are far from being background limited (the full-band background is 0.037 count pixel-1), and within of the aim point the detection limit with our selection criteria is photons in the full, soft and hard bands. For a power-law model with photon index and the Galactic column density, this corresponds to a soft (hard) observed flux detection limit of erg cm-2 s-1 ( erg cm-2 s-1). For the cosmology of §1, at the corresponding rest-frame luminosity limits are erg s-1 ( erg s-1); even fairly low-luminosity Seyfert galaxies should be detected at this redshift. For an open Universe with , these limits become erg s-1 ( erg s-1).
3 Results for Sources in and near the HDF-N
3.1 The X-ray Sources in the HDF-N
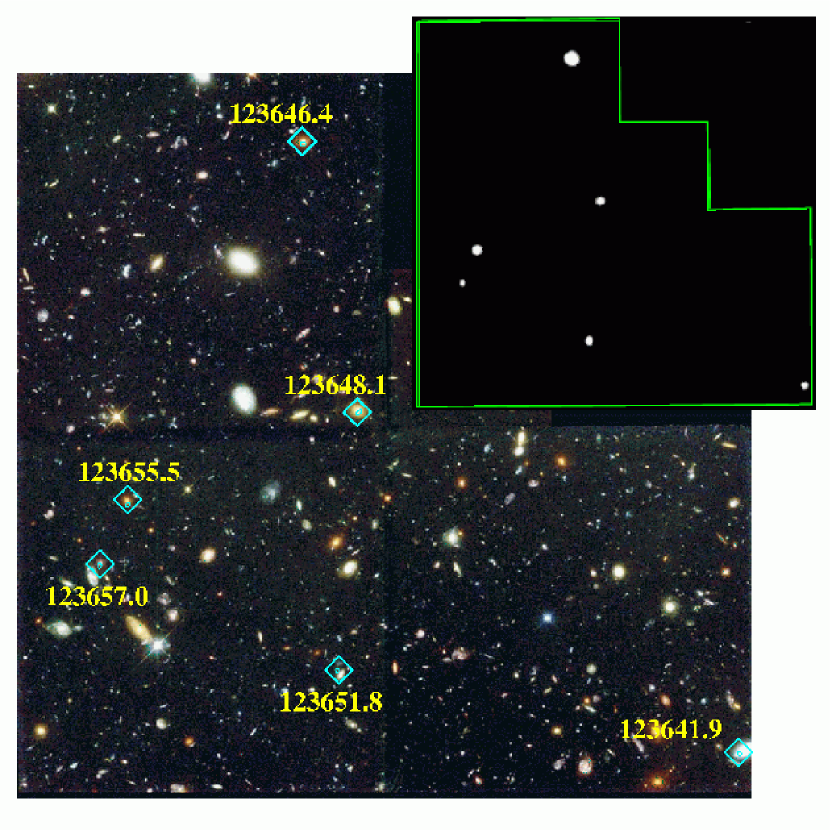
We have detected six full-band X-ray sources in the HDF-N (see Table 1 and Figure 1). This number of detections is consistent with plausible extrapolations of the number counts.
Four of the X-ray detections are positionally coincident (to within ) with 8.5 GHz sources from Richards et al. (1998, hereafter R98), giving us confidence in these matches and, more generally, in the X-ray positions. CXOHDFN J123646.4+621404 () is a red spiral galaxy oriented nearly face-on that hosts an active galactic nucleus (AGN; Phillips et al. 1997). Variable radio and optical emission have been detected (R98; Sarajedini et al. 2000). CXOHDFN J123651.8+621220 is spatially coincident with the remarkable source NICMOS J123651.74+621221.4, the second reddest object in the NICMOS survey of Dickinson et al. (2000). This source is also an 8.5 GHz emitter, and it may have 15 m and 1.3 mm emission as well (R98; Aussel et al. 1999; Downes et al. 1999). While its continuum is very red, it is detected in , and and is thus unlikely to be an extremely high redshift object; photometric redshift estimates indicate 2.6–2.7, but these have significant uncertainty due to possible reddening by dust (M. Dickinson, private communication). CXOHDFN J123651.8+621220 has the largest hard-band to soft-band count ratio (hereafter ‘band ratio’) of any X-ray source in the HDF-N (see Table 1). Provided the underlying X-ray continuum shape is typical for an AGN with 1.7–2.1, the large band ratio suggests substantial internal absorption by a column density cm-2. If the photometric redshift is correct the implied X-ray luminosity is erg s-1, and this source would be a good candidate for a type 2 Quasi-Stellar Object.
CXOHDFN J123655.5+621310 () and CXOHDFN J123657.0+621301 () are both ellipticals with radio emission. The rather flat radio spectrum () of the first may suggest AGN activity, although the X-ray luminosity for this object is not unusually high given the large -band luminosity [; compare with Figure 1 of Eskridge, Fabbiano & Kim 1995]. This source has also been detected in the Hogg et al. (2000) survey of the HDF-N at 3.2 m. The second source has a steep radio spectrum () as well as a possible ISO detection, and its X-ray luminosity is consistent with that expected from hot gas in an elliptical. Neither of these ellipticals is detected in the hard band, although we cannot rule out the presence of hard power-law emission with luminosity comparable to that seen in some nearby ellipticals (Allen, Di Matteo & Fabian 2000).
The two X-ray sources that are not positionally coincident with radio sources are coincident with fairly bright W96 sources. CXOHDFN J123641.9+621131 appears to be matched with a bright () foreground spiral galaxy at lying near the edge of the HDF-N. Somewhat surprisingly, however, the X-ray source position is not consistent with the nucleus of this galaxy. It may be coincident with a bright spot seen clearly in the image of W96. If the identification with the galaxy is correct, the X-ray source is kpc from the nucleus and its 0.5–8 keV luminosity is erg s-1, low enough that this source might plausibly be an off-nuclear ‘super Eddington’ X-ray binary or ultraluminous supernova remnant (e.g., Fabbiano 1998). The galaxy may also have some 8.5 GHz emission, although this emission is not positionally consistent with the X-ray source (see Table 5 of R98). CXOHDFN J123648.1+621309 () is another elliptical that has been detected at 3.2 m by Hogg et al. (2000); its X-ray luminosity is consistent with hot gas emission.
3.2 Active Galactic Nucleus Candidates in the HDF-N
X-ray emission is a universal property of AGN. Several surveys for AGN in the HDF-N itself have been performed, and we have searched for X-ray emission from the resulting AGN candidates of Jarvis & MacAlpine (1998), Conti et al. (1999) and Sarajedini et al. (2000). Aside from CXOHDFN J123646.4+621404, the AGN discussed above, we do not detect any of these candidates, and we place X-ray upper limits as discussed at the end of §2. The physical implications of these upper limits vary depending upon the properties (e.g., optical magnitudes and redshifts) of the individual candidates; given the typical range of X-ray to optical flux for type 1 AGN (e.g., Figure 2 of Schmidt et al. 1998), we should have detected most type 1 AGN to and might plausibly have detected some to . We also do not formally detect the strong FR I radio source J123644+621133 (R98), although there is a hint of an X-ray photon excess at its position. Among radio-loud AGN, however, FR I sources are the least X-ray luminous, and a rest-frame X-ray luminosity just below our 2–10 keV upper limit of erg s-1 would still make this source consistent with the 2–10 keV X-ray luminosities of other FR I sources (compare with Table 3 of Sambruna, Eracleous & Mushotzky 1999).
3.3 Submillimeter Sources in the HDF-N and its Vicinity
Deep submillimeter surveys have revealed a population of luminous, dusty, star-forming galaxies at moderate to high redshift that make an important contribution to the energy output of the Universe (e.g., Hughes et al. 1998, hereafter H98). However, it has been difficult to determine the relative contributions that AGN and star formation make to powering these objects (e.g., Almaini, Lawrence & Boyle 1999). X-ray observations may clearly discriminate between these possibilities.
H98 have presented 5 submillimeter sources in the HDF-N, and Barger et al. (2000, hereafter B00) have presented an additional 5 sources in the vicinity of the HDF-N (here we consider submillimeter sources detected by B00 at ). All 10 of these sources are in the ACIS field, but we do not detect any of them. Two of these sources may show X-ray photon excesses near their positions, but further observations are needed before source detections can be claimed. We have used the Chandra data to place constraints on the primary energy generation mechanism for these 10 sources. We follow the general method described by Fabian et al. (2000, hereafter F00), computing submillimeter (850 m) to X-ray (2 keV) spectral indices (777Note that the ‘s’ in stands for ‘submillimeter’ rather than ‘soft X-ray.’) and comparing these with values for local objects (see Table 2 and Figure 2). Because our Chandra observation is 8–18 times longer than those used by F00, we are able to place tight constraints on a substantially larger number of submillimeter sources.
One straightforward interpretation of Figure 2 is that star formation is the primary energy source for these 10 submillimeter sources. Black hole accretion could only dominate the energy production if it is either (1) intrinsically X-ray weak or (2) obscured by Compton-thick material along the line of sight and there is little electron scattering by a ‘mirror’ in the nuclear environment. These are the tightest X-ray constraints yet on the submillimeter source population, and the first to apply to enough sources to reasonably represent the population. X-ray background synthesis models suggest that 10–20% of the submillimeter sources could be powered by AGN (Almaini et al. 1999), and optical spectroscopy finds indications of AGN activity in at least % of submillimeter sources (Barger et al. 1999). Our 0/10 rate of X-ray detection is uncomfortably small, although it is still statistically consistent with these values at the % level. Although the redshifts used in Figure 2 have significant uncertainties (see H98 and B00), our basic results are not very sensitive to redshift.
If we consider less-significant B00 submillimeter sources in the 2.5–3 range, there are two additional submillimeter sources: 123616.2+621513 (5.4 mJy, unknown) and 123629.1+621046 (6.1 mJy, ). Both of these are positionally coincident with Chandra sources: CXOHDFN J123616.1+621513 (13.5 full-band counts) and CXOHDFN J123629.1+621046 (23.6 full-band counts). The soft-band (hard-band) values for these two sources are () and (), respectively. These sources probably have some AGN activity, although such activity must be obscured or weak.
Additional Chandra observations during Cycles 1 and 2 will allow an even deeper (by a factor of 3–6) X-ray survey of this area. Subsequent papers will discuss the X-ray sources detected in the full ACIS field of view and optical follow-up studies.
References
- (1)
- (2) Allen, S.W., Di Matteo, T. & Fabian, A.C. 2000, MNRAS, 311, 493
- (3)
- (4) Almaini, O., Lawrence, A. & Boyle, B.J. 1999, MNRAS, 305, L59
- (5)
- (6) Aussel, H., Cesarsky, C.J., Elbaz, D. & Starck, J.L. 1999, A&A, 342, 313
- (7)
- (8) Barger, A.J., Cowie, L.L., Smail, I., Ivison, R.J., Blain, A.W. & Kneib, J.-P. 1999, AJ, 117, 2656
- (9)
- (10) Barger, A.J., Cowie, L.L. & Richards, E.A. 2000, AJ, in press (B00; astro-ph/0001096)
- (11)
- (12) Brandt W.N., et al. 2000, AJ, in press (astro-ph/0002121)
- (13)
- (14) Cohen, J.G., Cowie, L.L., Hogg, D.W., Songaila, A., Blandford, R., Hu, E.M. & Shopbell, P. 1996, ApJ, 471, L5
- (15)
- (16) Conti, A., Kennefick, J.D., Martini, P. & Osmer, P.S. 1999, AJ, 117, 645
- (17)
- (18) Dickinson, M., et al. 2000, ApJ, 531, 624
- (19)
- (20) Dobrzycki, A., Ebeling, H., Glotfelty, K., Freeman, P., Damiani, F., Elvis, M. & Calderwood, T. 1999, Chandra Detect 1.0 User Guide. Chandra X-ray Center, Cambridge
- (21)
- (22) Ebeling, H., White, D.A. & Rangarajan, F.V.N. 2000, MNRAS, submitted
- (23)
- (24) Eskridge, P.B., Fabbiano, G. & Kim, D.-W. 1995, ApJS, 97, 141
- (25)
- (26) Fabbiano, G. 1998, The Hot Universe: Proceedings of IAU Symposium 188, ed. Koyama, K., Kitamoto, S. & Itoh, M. (Kluwer, Dordrecht), p. 93
- (27)
- (28) Fabian, A.C., et al. 2000, MNRAS, submitted (F00; astro-ph/0002322)
- (29)
- (30) Freeman, P.E., Kashyap, V., Rosner, R. & Lamb, D.Q. 2000, ApJ, submitted
- (31)
- (32) Hasinger, G., Burg, R., Giacconi, R., Schmidt, M., Trümper, J. & Zamorani, G. 1998, A&A, 329, 482
- (33)
- (34) Hill, J.E., Lewis, K.T., Foster, R.F., Bautz, M., Brown, S.K., Roming, P.W.A., Hornschemeier, A.E., Burrows, D.N. & Garmire, G.P. 2000, Proc. SPIE, in press
- (35)
- (36) Hogg, D.W., Neugebauer, G., Cohen, J.G., Dickinson, M., Djorgovski, S.G., Matthews, K. & Soifer, B.T. 2000, AJ, in press (astro-ph/9910478)
- (37)
- (38) Hughes, D.H., et al. 1998, Nature, 394, 241 (H98)
- (39)
- (40) Jarvis, R.M. & MacAlpine, G.M. 1998, AJ, 116, 2624
- (41)
- (42) Kraft, R.P., Burrows, D.N. & Nousek, J.A. 1991, ApJ, 374, 344
- (43)
- (44) Lyons, L. 1991, Data Analysis for Physical Science Students. Cambridge University Press, Cambridge
- (45)
- (46) Mushotzky, R.F., Cowie, L.L., Barger, A.J. & Arnaud, K.A. 2000, Nature, in press (astro-ph/0002313)
- (47)
- (48) Phillips, A.C., Guzmán, R., Gallego, J., Koo, D.C., Lowenthal, J.D., Vogt, N.P., Faber, S.M., Illingworth, G.D. 1997, ApJ, 489, 543
- (49)
- (50) Prigozhin, G., Kissel, S., Bautz, M., Grant, C., LaMarr, B., Foster, B. & Ricker, G. 2000, Proc. SPIE, in press
- (51)
- (52) Richards, E.A., Kellermann, K.I., Fomalont, E.B., Windhorst, R.A. & Partridge, R.B. 1998, AJ, 116, 1039 (R98)
- (53)
- (54) Sambruna, R.M., Eracleous, M., & Mushotzky, R.F. 1999, ApJ, 526, 60
- (55)
- (56) Sarajedini, V.L., Gilliland, R.L. & Phillips, M.M. 2000, AJ, in press
- (57)
- (58) Schmidt, M., Hasinger, G., Gunn, J., Schneider, D., Burg, R., Giacconi, R., Lehmann, I., MacKenty, J., Trümper, J. & Zamorani, G. 1998, A&A, 329, 495
- (59)
- (60) Stark, A.A., Gammie, C.F., Wilson, R.W., Bally, J., Linke, R.A., Heiles, C. & Hurwitz, M. 1992, ApJS, 79, 77
- (61)
- (62) Townsley, L.K., Broos, P.S., Garmire, G.P. & Nousek, J.A. 2000, ApJ, in press (astro-ph/0004048)
- (63)
- (64) Weisskopf, M.C., O’Dell, S.L. & van Speybroeck, L. 1996, Proc. SPIE, 2805, 2
- (65)
- (66) Williams, R.E., et al. 1996, AJ, 112, 1335 (W96)
- (67)
| CXOHDFN Name | Off axis | 0.5–8.0 keV | Band | W96 | CXO/W96 | Descriptive | ||||
|---|---|---|---|---|---|---|---|---|---|---|
| (J2000) | Angle (′) | Countsa | Ratiob | (erg cm-2 s-1)c | (erg s-1)d | Name | Offset (′′)e | Redshiftf | Notesh | |
| 123641.9+621131 | 2.65 | 4-976 | 1.92 | 0.0891 | 20.0 | Spiral | ||||
| 123646.4+621404 | 2.03 | 2-251 | 0.74 | 0.9602 | 22.5 | AGN (R) | ||||
| 123648.1+621309 | 1.51 | 2-121 | 0.62 | 0.4763 | 21.4 | Elliptical | ||||
| 123651.8+621220 | 1.23 | — | 0.76 | 2.6–2.74 | 26.7 | NICMOS (R) | ||||
| 123655.5+621310 | 0.68 | 3-180 | 0.73 | 0.9685 | 23.2 | Elliptical (R) | ||||
| 123657.0+621301 | 0.48 | 3-355 | 0.53 | 0.4746 | 24.4 | Elliptical (R) |
| Source | 0.5–2 keV / | |||
|---|---|---|---|---|
| Name | (mJy)a | / | 2–8 keV | |
| HDF 850.1 | 7.0 | / | / | |
| HDF 850.2 | 3.8 | / | / | |
| HDF 850.3 | 3.0 | / | / | |
| HDF 850.4 | 2.3 | / | / | |
| HDF 850.5 | 2.1 | / | / | |
| 123618.3+621551 | 7.8 | / | / | |
| 123621.3+621708 | 7.5 | / | / | |
| 123622.7+621630 | 7.1 | / | / | |
| 123646.1+621449 | 10.7 | / | / | |
| 123700.3+620910 | 11.9 | / | / |