Electron, Muon, and Hadron Lateral Distributions Measured in Air-Showers by the KASCADE Experiment
Abstract
Measurements of electron, muon, and hadron lateral distributions of extensive air showers as recorded by the KASCADE experiment are presented. The data cover the energy range from eV up to almost eV and extend from the inner core region to distances of 200 m. The electron and muon distributions are corrected for mutual contaminations by taking into account the detector properties in the experiment. All distributions are well described by NKG-functions. The scale radii describing the electron and hadron data best are m and m, respectively. We discuss the correlation between scale radii and ‘age’ parameter as well as their dependence on shower size, zenith angle, and particle energy threshold.
keywords:
cosmic rays; air shower; lateral distributionPACS:
96.40.Pq, , , , ,††thanks: Now at: University of Hamburg, Hamburg. , , , , , , , , , , , , , , , , ,††thanks: Present address: University of Chicago, Enrico Fermi Institute, Chicago, IL 60637., , , ,††thanks: Now at: University of Leeds, Leeds LS2 9JT, U.K., , , , , , , , , , , , , , , , , , , ,
=
1 Introduction
Since the detection of extensive air showers (EAS) [1] lateral or radial density distributions of different kinds of particles produced in EAS have been an ongoing target of experimental as well as theoretical investigations. There are a number of reasons why EAS lateral distributions are of importance for the air shower phenomenon. The first and most important one is that from the number and distribution of ground particles the energy and mass of the primary particle can be deduced. While at least the energy reconstruction can be done rather crudely from analytical considerations, more reliable algorithms need detailed air shower simulations to relate the observables to primary energy and mass. Perhaps trivial, although experimentally very important, is the fact that in measurements the shower particles are always sampled over a limited range of core distances only – in most cases with an area coverage in this range not much exceeding one percent – but showers are often referred to in terms of integrated numbers of particles:
| (1) |
The total particle numbers, , for different kinds and energy ranges of shower particles, are obtained by choosing and and are traditionally used both as measures for the primary energy in an individual experiment as well as a means for comparison of different experiments. Comparing experimental results is generally hampered by different detector characteristics like energy thresholds and discrimination of particle types but also by different observation altitudes. These effects need to be corrected, e.g. using suitable air shower and detector response simulations.
Detector effects are, in principle, minimized by disentangling the lateral distributions (and thus also the total particle numbers) for various kinds of particles. For experiments using a single type of detector this is generally not an option and resulting lateral distributions correspond to some mixture of different particle types, depending on the detection technique used as well as on absorber thicknesses and thresholds applied. Experiments with several detector components optimized for different particle types still measure a mixture of particles, but are able to disentangle various types to a large extent. The present paper follows this path to obtain lateral distributions separately for the major charged particles – electrons, muons, and hadrons – in EAS of primary energies from eV up to almost eV.
Integrating from to implies an extrapolation beyond the core distance ranges actually covered. Deviations of measured lateral distributions from the expected form, as a consequence, result in systematic errors of the particle numbers obtained. Such systematic errors can be very much reduced by using ’truncated’ particle numbers integrated only over the experimentally covered range of core distances. This approach is introduced for muons in section 3.1. The main drawback of such truncated particle numbers is that comparisons of different experiments are further complicated.
The lateral distribution functions also carry information on the related particle physics and astrophysics. Different hadronic interaction models predict different lateral shapes. Hence, it is possible to test available interaction models. Unfortunately, from a particle physicists point of view, the expected lateral shape also depends on the mass of primary cosmic rays. Heavier primaries lead, on average, to a flatter distribution. Since the lateral distribution is only one in a group of composition-sensitive observables measured with KASCADE, no attempts are made to infer any mass parameter in the present paper. This will be addressed in a separate article.
Historically, choices of parametrizations of both electron and muon lateral distributions were influenced very much by the seminal review of Greisen [2]. Greisen described the lateral density function (LDF) of the electromagnetic (e.m.) component of EAS by
| (2) |
over the core distance range from cm to m and for atmospheric depths of 537 g/cm2 to 1800 g/cm2. The parameter is the total number of electrons in the shower and is the Molière radius. The Molière unit, about 0.25 radiation lengths in air, characterises the spread of low-energy electrons by multiple scattering.
Greisen also noted that Eq. 2, except for the last factor, is a close approximation to the analytical calculations for electromagnetic showers performed by Kamata and Nishimura [3] if a shower age parameter of is assumed. Greisen’s approximation to the Nishimura-Kamata functions for is referred to as the NKG function:
| (3) |
This function, often used to describe the charged particle lateral distribution, will in the following be applied individually to electron, muon, and hadron distributions by choosing approriate sets of parameters . For a comparison of the parametrization of Kamata and Nishimura with the NKG function (Eq. 3) see [4].
Many experimental groups reported deviations of the e.m. LDF from the NKG form which are most obvious at large core distances [5, 6, 7]. This may be related to the problem that the NKG form has originally been formulated for zero energy threshold of shower electrons in purely electromagnetic showers and that higher moments of the NKG form tend to diverge, depending of the age parameter . More general forms were, for example, suggested by Hillas and Lapikens [8] and Capdevielle et al. [9].
Traditionally, the NKG form is used with a fixed value of and a variable age parameter . Thus, the scale length is kept constant while the shape of the LDF is assumed to be variable. A different LDF and a scaling relation were proposed by Lagutin et al. [10], based on Monte Carlo calculations for pure electromagnetic showers. They proposed a normalized LDF with
| (4) |
independent of primary energy and age at least in the range , where is the core distance divided by a scale radius, here the root mean square (rms) radius, , of the particle density at ground. Note that Eq. 4 has finite higher order moments but is not useful for small .
Greisen [2] also suggested a functional form for the muon LDF in EAS
| (5) |
with , now referred to as the Greisen function. In the original form, which was based on a very limited number of events, the Greisen radius is 320 m. This form refers to a minimum muon energy of 1 GeV but a more general form for the 1–20 GeV range was also quoted by Greisen. Deviations of the muon LDF from the Greisen form (Eq. 5) were reported by several experimental groups, such as [11, 12, 13]. Alternatives were suggested by Linsley [14] and by Hillas et al. [15]. The KASCADE experiment allows to scrutinize the muon LDF for different thresholds (0.23–2.4 GeV), although only for core distances below 100–230 m.
For the hadronic (originally termed nuclear interacting or just N) component, the LDF depends very much on the hadron energy, with more energetic hadrons being more concentrated near the shower core. This was already pointed out by Greisen [2].
Hadron lateral distributions were investigated by previous experiments mainly close – within 10 m or less – to the shower core. Rather wide lateral distributions measured at Tien Shan initiated speculations on rising mean values of transverse momenta or on strongly rising cross-sections of jet production [16]. At Chacaltaya hadrons far away from the shower axis and with high values of GeV/c have been observed [17]. Similar discrepancies between observations and calculations were reported repeatedly, e.g. by the Turku group, claiming an increase of large transverse momentum processes with rising energy (see [18] and references therein). Features suggesting strong changes in the characteristics of hadronic interactions in the PeV range were also claimed in [19, 20].
Early parametrizations of the hadron LDF assumed a power law form, as for instance shown in the review by Cocconi [21]. More recently, Maket-ANI reported agreement with exponential forms within 5 m from the core [22]. The Chacaltaya group found a NKG-like function to fit their lateral distribution best for core distances up to 10 m [23]. The KASCADE hadron calorimeter with its large detection area and large dynamic range not only provides better statistics but also allows to extend the hadron LDF analysis to much larger core distances than any previous experiment.
2 The KASCADE experiment
The KASCADE (KArlsruhe Shower Core and Array DEtector) experiment is located at Forschungszentrum Karlsruhe, Germany, at an altitude of 110 m a.s.l. and has been described in detail in [24, 25]. The experiment has three major components: an array of electron and muon detectors, a central detector mainly for hadron measurements but with substantial muon detection areas, and a tunnel with streamer tube muon telescopes. Since the latter have only been completed at the time of writing this article, no data from the muon tunnel are included in the present analysis.
The KASCADE array covers an area of about 200200 m2 and consists of 252 detector stations located on a square grid of 13 m separation. These are organized in 16 clusters of 16 stations each, except for the inner four clusters where the location of one station is blocked by the central detector. The stations contain two types of detectors, liquid scintillation counters ( detectors) of 0.79 m2 area each and 5 cm thickness with little shielding above and plastic scintillators of 0.81 m2 area each and 3 cm thickness (muon detectors) below a shielding of 10 cm lead and 4 cm steel. The inner four clusters are instrumented with four detectors per station but without muon detectors while the outer 12 clusters house two and four muon detectors per station. For both detector types the sum of photomultiplier signals, the earliest time, and the hit pattern are recorded for all stations fired.
The central hadron calorimeter is of the sampling type and has a fiducial area of 1619 m2. A detailed description can be found in [26]. The energy is absorbed in an iron stack and sampled in eight layers of liquid ionization chambers with anode segments of 0.250.25 m2 (appr. 38 500 channels). The thickness of the iron slabs increases from 12 to 36 cm towards the deeper parts of the calorimeter, amounting to 154 cm in total. The 8th layer is located below an additional concrete ceiling of 77 cm thickness. On top, a 5 cm lead layer filters off the soft electromagnetic component. The ionization chambers are read out by logarithmic amplifiers and 13 bit ADCs, achieving a dynamic range of . Signals starting from single minimum ionizing muons up to energy deposits of 10 GeV in a chamber are read out without saturation. The response curve of each channel is calibrated with a reference capacitor coupled to the preamplifier, injecting known charges into the electronics chain.
Below the 8th calorimeter layer, two layers of multiwire proportional chambers (MWPCs), vertically separated by 38 cm, are used as muon detectors. In total, 32 chambers are operated with 129 m2 total area per layer. Hits are registered on anode wires and two layers of cathode strips at angles of with respect to the wires.
A total of 456 plastic scintillation counters of m2 area each and 3 cm thickness are used within the calorimeter (below 5 cm lead and 36 cm steel) to trigger the calorimeter and the MWPCs. They also serve as muon counters. On top of the calorimeter, an additional 50 such counters fill the central gap of detectors but their data are not included in the present analysis. A summary of the detector components used in this article together with their most relevant parameters is given in Table 1.
| Detector | channels | separation | total area | threshold | for |
|---|---|---|---|---|---|
| array | 252 | 13 m | 490 m2 | 5 MeV | |
| array | 192 | 13 m | 622 m2 | 230 MeV | |
| trigger | 456 | — | 208 m2 | 490 MeV | |
| MWPCs | 26 080 | — | 129 m2 | 2.4 GeV | |
| calorimeter | 38 368 | — | 304 m2 | 50 GeV | hadrons |
3 Data analysis procedures
3.1 Shower reconstruction
Shower parameters are reconstructed from the array data in a procedure with three iterations. In a first step core positions are obtained by the centre of gravity (COG) of the detector signals. The shower direction is determined assuming a plane shower front. In this first step, the electron and muon shower sizes, and , are obtained by summing up the relevant detector signals of the and muon detectors, respectively, and multiplying them with a core-position dependent geometrical weight factor. Next, the shower direction is obtained by fitting a conical shower front to the recorded times of detectors which are within 70 m from the shower core. The core position is fitted simultaneously with the electron shower size and the electron lateral shape parameter. Next, the detector signals are corrected for expected contributions from particles other than electrons, and muon detector signals are corrected for expected electromagnetic and hadronic punch-through (see Section 3.2). The main differences between the second and third iteration are improved corrections. Signals largely inconsistent with those in the neighbouring detectors or with expected fluctuations of particle numbers, or signals more than some 200 ns off from the shower front are discarded in this fit. This greatly reduces the impact of hadronic and electromagnetic punch-through on muon signals.
In the shower reconstruction, both the electron and muon lateral distributions are assumed to follow a NKG form with a Molière radius of 89 m and 420 m, respectively. For muons, the fit is performed by considering only detector stations at core distances between 40 and 200 m. The truncated muon size, , is then defined by integrating Equation 1 in this range. The lower integration limit is imposed by severe punch-through near the shower axis and the upper one is approximately the largest core distance of any counter for showers with their cores inside KASCADE. The scale radius of 420 m and the muon age parameter were deduced from simulations. The latter can not be fitted on a shower-by-shower basis due to limited statistics. Therefore, it is derived from CORSIKA simulations [27] and parametrized as a function of . The actual values are obtained by fitting CORSIKA muon density distributions individually for proton and iron induced showers and taking the mean value of both parametrizations. This leads to a mass dependent systematic error in the reconstruction of in a range of up to 5 but yields a more robust result than trying to fit also on a shower-by-shower basis.
The actual muon LDF is known to deviate from the assumed NKG form outside the fit range. Within the limited range accessible to the experiment, the NKG form is nevertheless, on a shower-by-shower basis, as good as the Greisen function or any other form with suitably adapted parameters. Simulations show that provides a very good estimate of the primary energy, almost independent of the primary particle mass [28].
The adopted electron LDF is also known to deviate from experimental data at large core distances, even though the age parameter is fitted on a shower-by-shower basis for core distances of 10–200 m. This results in an underestimate of up to 5–8% for simulated showers.
The core position can be reconstructed with an uncertainty of about 3 m at 1 PeV, and the accuracy is typically better than 1 m for showers above 4 PeV if the core is located well inside the array. In order to use data of best quality, the analysis of average lateral distributions in this paper is restricted to showers with core positions within 91 m from the centre of the array. The angular resolution for such showers above 1 PeV is about 0.4∘ (68 % C.L.). Statistical sampling errors on () improve from about 10% (20%) at 1 PeV to about 3% (10%) at 10 PeV.
3.2 Particle numbers in array detectors
The signal analysis of the detectors takes account of muons by subtracting their expected energy deposits from the measured energy. In the same way, the expected and hadron punch-through contributions are subtracted from the energy deposit in the muon detectors. Since both are mutually related, an iterative procedure is applied. Finally, the number of particles hitting a detector is estimated by dividing the remaining energy deposit by the expected energy deposit per particle. There are no means to discriminate against hadrons in the array detectors.
In total, the procedure requires four lateral energy correction functions (LECFs) which are, in the most general case, a function of core distance, zenith angle, and shower size. Actually, there is a weak dependence on the cosmic-ray mass composition, too. Hence, mean values of the LECFs for simulated proton and iron primaries are used. All LECFs were obtained from CORSIKA simulations of EAS (using the QGSJET model [29]) followed by detailed detector simulations (based on the GEANT package for detector simulation [30]). The same event reconstruction is applied to simulated as to experimental data. As a result, the energy deposits can be related to the numbers and types of particles hitting the detectors. For the analysis of average lateral distributions special refined LECF functional forms are used (see Fig. 1). They do not change fundamental shower parameters like or , but improve the reproduction of the average lateral distribution of simulated showers. LDFs obtained after detector simulation and shower reconstruction closely match LDFs of the relevant particle type and energy threshold before detector simulation.
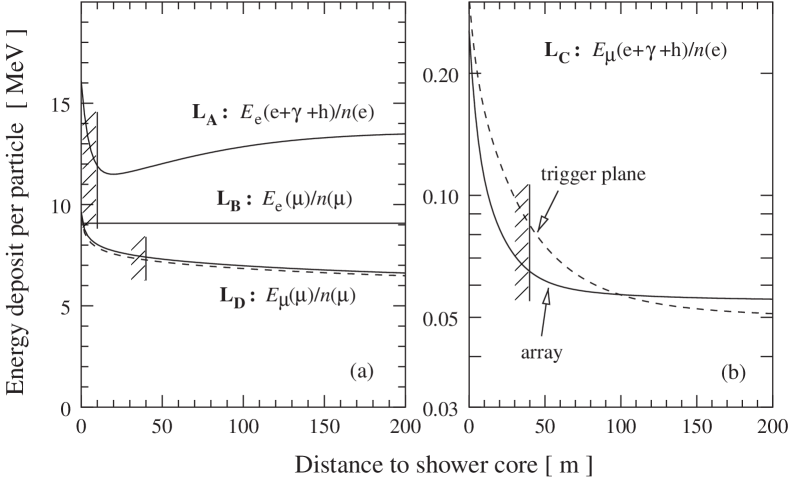
The following correction functions are used: is the average sum of energy deposits by electrons, gammas, and hadrons in the counters normalized to the number of electrons above 5 MeV kinetic energy, , hitting the counter; is the average energy deposit by muons in the counters per muon; is the average punch-through energy deposit of electrons, gammas, and hadrons in the muon counters per electron; is, in turn, the average deposit of muons in the muon counters per muon. The average energy deposits and in and muon detectors, respectively, are:
and
with and being the areas of the detectors and and the particle densities. Parametrized correction functions are given in Fig. 1. The rise of at small and large core distances is due to hadrons and gammas, respectively. rises at small distances because of energetic knock-on electrons released by high-energy muons in the absorber material above the muon counters.
and are adjusted for the core distance range 10–200 m, and and for the range 40–200 m. For core distances below 20–40 m the electromagnetic and hadronic punch-through, even on average, exceeds the energy deposit by muons in the muon counters. Despite the reduction of ’spikes’ and correction for other punch-through, systematic errors on the muon LDF due to punch-through remain significant below 40 m core distance. For this reason, the array muon analysis was restricted to core distances farther than 40 m.
The expected numbers of the ‘wrong’ particle types in the second and third iteration are derived from the fitted lateral distributions of the previous step. Therefore, to some extent the derived shower sizes depend on the assumed shapes. The electron size , in particular, depends on the extrapolation of the assumed electron LDF to radii below 10 m and above 200 m, as well as on the assumed muon LDF at radii below 40 m – the latter resulting in about 2% systematic error.
After shower reconstruction lateral distributions of average energy deposits are obtained for various bins of shower size and zenith angle. A similar procedure to the one described above is applied to correct for the contribution of other particle types, but now on the average and not individual energy deposits. Therefore, refined LECFs are used to get average particle density distributions. Again, the corrections for muons in the detectors and for electron punch-through into the muon detectors are calculated iteratively, by using LDFs from the preceding iteration. In each iteration, both electron and muon LDFs are fitted and the slope of the muon LDF is no longer parametrized (see Sec. 3.1) but is fitted as well. In these fits, we take into account not only the statistics of hits but also the uncertainty expected in the punch-through correction and we consider effects caused by the experimental resolution in determining the core position.
3.3 Muon numbers in the trigger plane
The trigger plane has a muon energy threshold of 490 MeV and, therefore, less electromagnetic punch-through than the array muon detectors. On the other hand, the dynamic range of signals is smaller and hadronic punch-through is more significant because of the outset of cascading in the absorber material above. The effect of hadronic punch-through is reduced by rejecting detector elements within a distance of 1 m to identified high-energy hadrons (typically above 50 GeV). Further reduction of hadronic and electromagnetic punch-through is achieved by rejecting counters with energy deposits inconsistent with the expected numbers of muons, accounting for statistical number fluctuations and for fluctuations in the energy loss of muons.
Conversion of average energy deposits into particle numbers in the trigger plane closely follows the procedure outlined for the array detectors. LECFs for trigger plane counters were derived from simulations – with the same selection criteria applied as for experimental data. Most notably, the punch-through correction is different for array detectors (Fig. 1b), but the different composition of materials above the muon counters also results in slightly different effective energy loss distributions (Fig. 1a).
3.4 Reconstruction in the MWPCs
Hits of single muons in the MWPCs are characterised by signals on one or a few anode wires and an average of 3.5 neighbouring cathode strips on each side. Hit reconstruction requires that the intersection of the two cathode signals coincides with an anode signal. At low particle densities this reconstruction achieves a good efficiency and spatial resolutions are 1.4 cm along wires and 0.7 cm perpendicular. At high densities of about 5 muons/m2, signals of several hits start to overlap and ambiguities arise in the reconstruction.
Muon tracks are reconstructed from pairs of hits in the two detector layers. Accepted tracks are required to be in reasonable agreement with the shower direction (; if ), which effectively resolves ambiguous hits. Systematic uncertainties in calculating efficiencies are reduced by discarding those muons which, according to the shower direction, could be observed in one layer of the MWPCs only. Thereby, hits near the edges of the chambers are rejected. Furthermore, muons entering from the sides of the building in inclined showers would have a lower than nominal energy threshold. To compensate for this effect, only those areas of the MWPCs are used where muons parallel to the shower directions have penetrated the entire iron absorber of the calorimeter. Geometric and reconstruction efficiencies were obtained from the shower and detector simulation chain followed by the normal reconstruction procedure. The particle detection efficiency in the MWPCs itself is derived continuously by using muons observed in the trigger layer and the other of the two MWPC layers and is typically 98 %. All efficiencies are accounted for in the lateral distributions.
3.5 Hadron reconstruction
Briefly, the algorithm for pattern recognition of hadrons in the eight layers of ionization chambers proceeds as follows [26]: Clusters of energy are searched to line up in the calorimeter and to form a track in different layers from which an approximate angle of incidence can be inferred. Then, patterns of cascades are searched for in the deeper layers. Going upwards in the calorimeter, clusters are formed from the remaining energy and are lined up to showers according to the direction already found. The reconstruction efficiency for isolated hadrons is 70% at 50 GeV and reaches nearly 100% at 100 GeV.
Hadron energies are reconstructed from the sum of calibrated signals in layers 2–8, weighting each layer by the relative amount of preceding absorber. The uppermost layer is not used for the energy determination to avoid distortions by electromagnetic punch-through. The weighted signal sum is converted to energies by a function derived from detector simulations based on the GEANT package. The energy resolution is rather constant, slowly improving from 20% at 100 GeV to 10% at 10 TeV.
Due to the fine lateral segmentation of 25 cm, the minimal distance to separate two equal-energy hadrons with a 50% probability amounts to 40 cm. This causes the reconstructed hadron number density to flatten off at about 1.5 hadrons/m2. The reconstructed hadron energy density, on the other hand, is not affected by this saturation [26]. Radiation from high-energy muons can mimic hadrons. However, their reconstructed energies are much lower than those of the actual muon, typically by a factor of 10. Simulations show that a 1 TeV muon is identified as a hadron with a probability of about 1% [31].
4 Electron lateral distribution
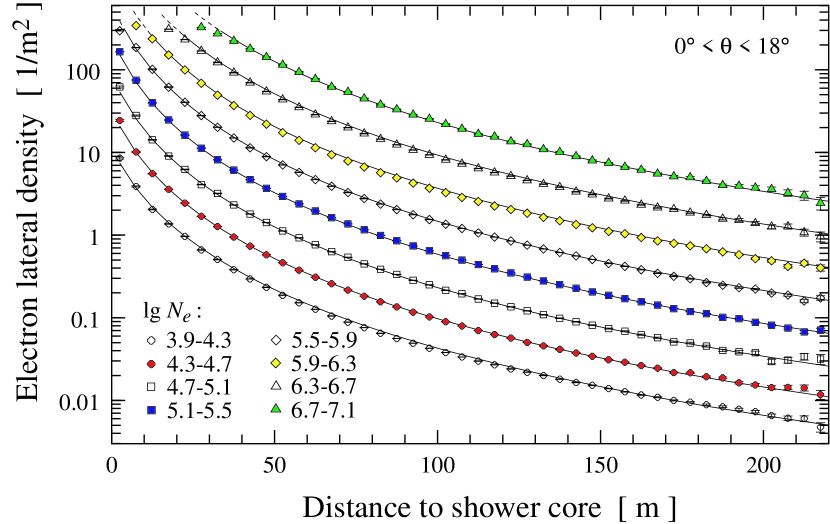
Average LDFs of electrons have been reconstructed for shower sizes from less than to more than electrons. Contributions of hadrons, muons, and gammas to energy deposits in the / detectors were corrected for by the procedure outlined in Section 3.2. Resulting lateral distributions for electrons above 5 MeV kinetic energy are presented in Fig. 2. NKG functions fit the data quite well and are represented by lines. Reduced values are 1–3 with only the lowest bin being worse by about a factor of 2. Note that saturation effects in average lateral distributions become relevant at electron densities of approximately 300 m-2 although individual counters have a dynamic range of up to 600 m-2. The effect is attributed to shower-by-shower fluctuations and it does not influence the measurement in individual events.
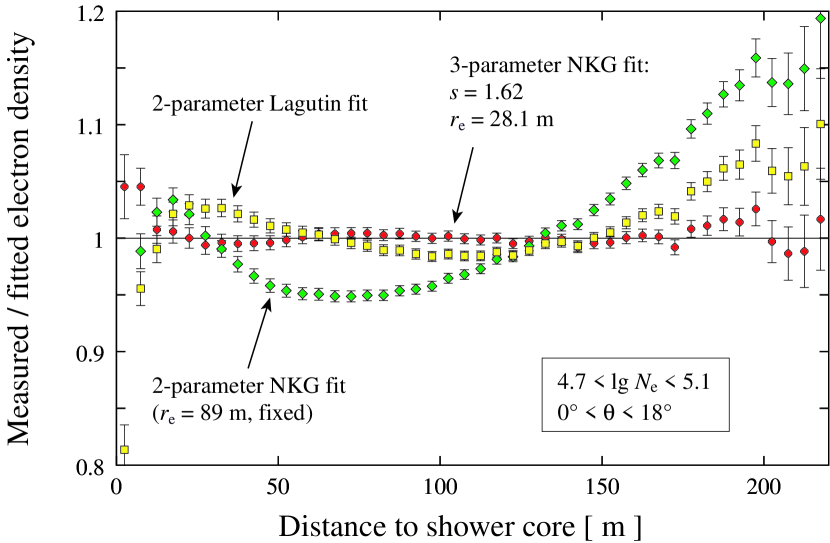
Deviations of the experimental LDF from the NKG function (Eq. 3) have been discussed in the literature frequently (see Section 1) and are subject to more detailed studies presented below. It turns out that the NKG function can describe the KASCADE electron LDF over the core distance range 10–200 m surprisingly well – but the best agreement is achieved with parameters far away from the conventional assumption of m. When fitting , , and simultaneously, the measured LDFs can be reproduced at the 1% level for –30 m and –1.8. The actual values depend on shower size and zenith angle. In order to avoid confusions with the original Molière radius, , we will call this fit parameter of the electron lateral distributions in the following. Two-parameter fits with conventional are substantially worse, as can be seen in Fig. 3. Similar results have been found in -shower calculations by Hillas and Lapikens [8]. In the fits, we find a strong correlation between and . A corresponding parameter map has been generated by scanning and fitting . The reduced -values are about one and are plotted as black areas in Fig. 4. It seems worth noting that the optimal value of tends to decrease and of to increase, both with increasing shower size and with increasing zenith angle. This variation does not exactly follow the ridge shown in the – plane of Fig. 4.
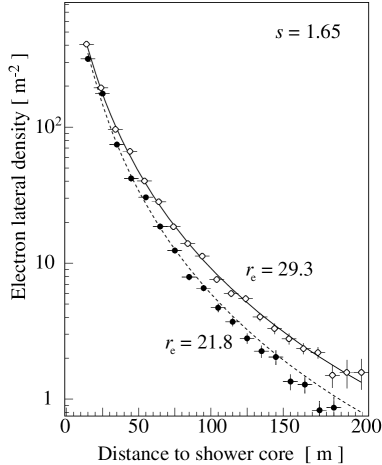
At the level of accuracy possible in individual showers, the correlation between and entail highly ambiguous values if and are fitted simultaneously. Therefore, is usually fixed and the steepness of the lateral distributions is quantified by the fit parameter . A problem mostly relevant to NKG functions with small scale radii m is, that upwards fluctuations of the large parameter easily lead to ill defined shower sizes. CORSIKA simulatios show, that this problem can be circumvented if is fixed and fitted, instead. An example of experimental electron lateral distributions of events with similar shower size and zenith angle is presented in Fig. 5. The difference in shape is clearly visible and well accounted for by the different parameters of the fitted NKG functions. The sensitivity of to the primary mass will be subject of a forthcoming publication.
Since evaluation of involves an extrapolation of the LDF beyond the fiducial range, fitting with non optimal causes systematic errors of the shower size obtained. In case of KASCADE, variations of the Molière radius in the range change by up to 5%. Using a truncated electron size in analogy to , no such extrapolation would be required. Since the required correction is fairly small – in contrast to the case – we keep using a total electron shower size.
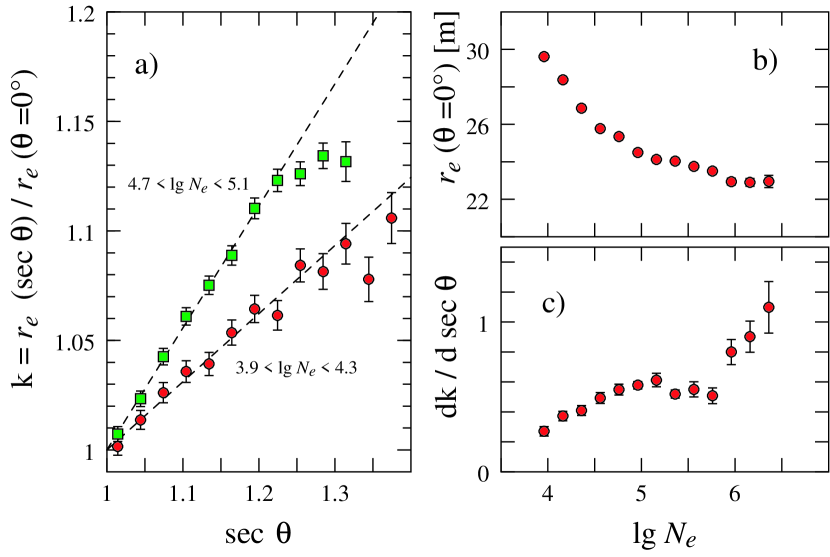
Figure 3 shows, in addition to the NKG function, also residuals for a fit with the LDF of Eq. 4 proposed by Lagutin et al. The rather moderate description of the experimental data is not particularly surprising, since Eq. 4 was developed for purely electromagnetic showers. However, this form has a much more reasonable behaviour at large core distances than the NKG form. The rms-radius calculated directly from the experimental data and used by Lagutin et al. as the scale radius, would be diverging when evaluated analytically from our best-fit NKG form. Lagutin et al. also claimed that the shape of the LDF remains unchanged when the radius is expressed in units of a variable scale radius. We tested this scaling hypothesis by fitting electron lateral distributions of different shower sizes and zenith angles to the NKG form and fixing the age parameter to , a value which provided the best overall fit for all data considered. Again, the reduced is in the range 1–4 with slightly better fits obtained for larger shower sizes. No siginificant dependence on zenith angle is observed. The parameter of the fits can then be considered the variable scale radius. As shown in Fig. 2, all data can be reproduced rather well – with the largest deviations seen for shower sizes . This probably is due to selection effects at threshold. For small zenith angles, varies from about 30 m at to 24 m at , with little change beyond that size. A comparison with results from 3-parameter NKG fits to the electron LDF reveals that the scaling assumption does indeed reproduce all our electron data rather well, but residuals of up to % also demonstrate significant deviations from perfect scaling.
Apart from the scaling for different shower sizes it is particularly illustrative to see a change of the scale radius as a function of zenith angle. To be independent of the scale chosen and the precise form of the LDF used, the scale radius shown in Fig. 6a is normalized to that for vertical showers. Using the Lagutin function instead of NKG, consistent results are obtained. A linear relation between scale radius and the secant of the zenith angle is obvious and is mainly a result of the increasing distance between the detector and the shower maximum. Electrons are being scattered away from the shower axis as the shower has to penetrate a larger air mass. The slope in this relation can, in fact, be used to infer the average depth of shower maximum – although additional corrections based on simulations have to be applied. The increase of the depth of shower maximum with increasing shower size, and thus energy, results in a decrease of the scale radius as seen in Fig. 6b. Also, the slope of the normalised scale radius versus rises with shower size (see Fig. 6c). An exception from the otherwise monotonic change is apparent at shower sizes corresponding to the knee in the flux spectrum, which we observe at [32]. A quantitative analysis of the phenomenon in terms of possible change of the chemical composition is beyond the scope of this paper.
5 Muon lateral distributions
The KASCADE experiment measures lateral distributions of muons for three different energy thresholds (Table 1). In the following, we group the showers in bins of truncated muon numbers . Punch-through and efficiency corrections are applied as described in Section 3. Ranges of core distances for the different muon energy thresholds are limited by uncertainties in the punch-through corrections at small core distances and by the geometry of the KASCADE detector array. Since rises with shower size, the impact of punch-through corrections becomes more severe at higher energies and the minimum core distances have to be increased correspondingly. For showers with cores inside KASCADE, the upper limit is about 220 m for array detectors and 100 m for central detector components.
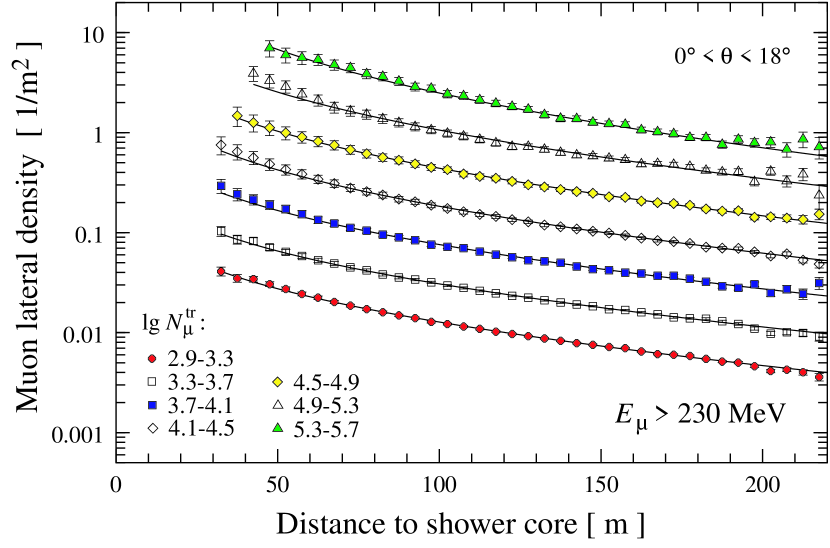
As is well known, the muon LDF at sea level and in the energy range considered in this work is much flatter and typically an order of magnitude lower than the electron LDF in our range of core distances. Figure 7 presents average muon lateral distributions with an energy threshold of 230 MeV. NKG functions with m are superimposed as dashed lines and typically fit the data to better than 5%. The Greisen function (Eq. 5) or the forms suggested by Linsley [14] and by Hillas et al. [15] do not – within the small range of accessible core distances – provide a substantially better description of the data. The rather unconventional application of the NKG form in fitting the muon lateral distribution for individual showers (see Section 3) is, therefore, not expected to affect the quality of the measurement. As in the case of electrons (see Fig. 4), the and values in NKG fits and also the and values in Greisen fits are highly correlated. While the total number of muons is affected by this ambiguity of the scale radius, is not, because no extrapolation beyond the fiducial core distance range is performed.
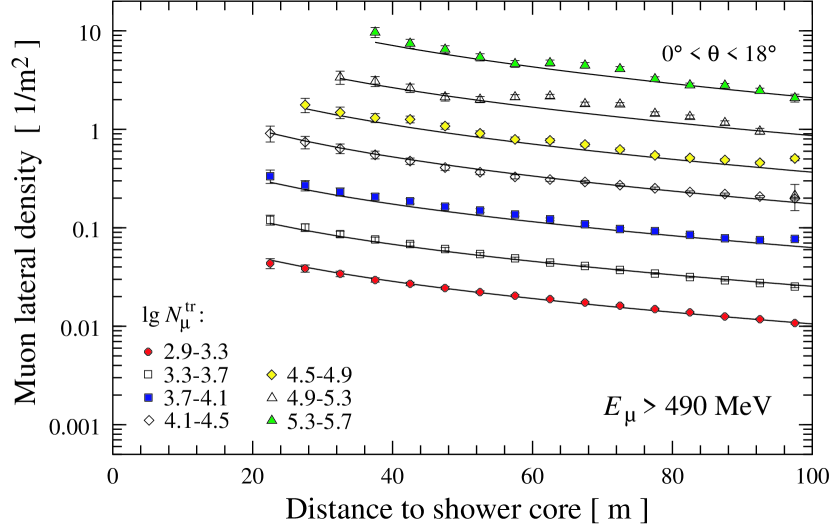
Muon density distributions above a threshold of 490 MeV as obtained with the trigger plane detectors are presented in Fig. 8. Again, they are equally well fitted by NKG as by Greisen functions. Due to the smaller detector area, statistical errors are larger than for the array muon LDF. Nevertheless, the same range of is covered, allowing to compare both muon LDFs. Apart from threshold effects this comparison can serve as an additional check for any systematics, for example due to punch-through corrections or cuts applied which are quite different in both cases.
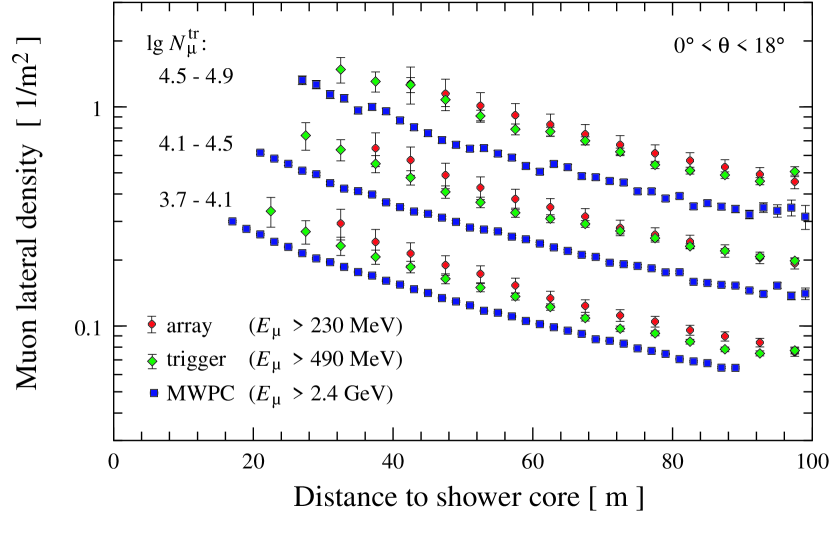
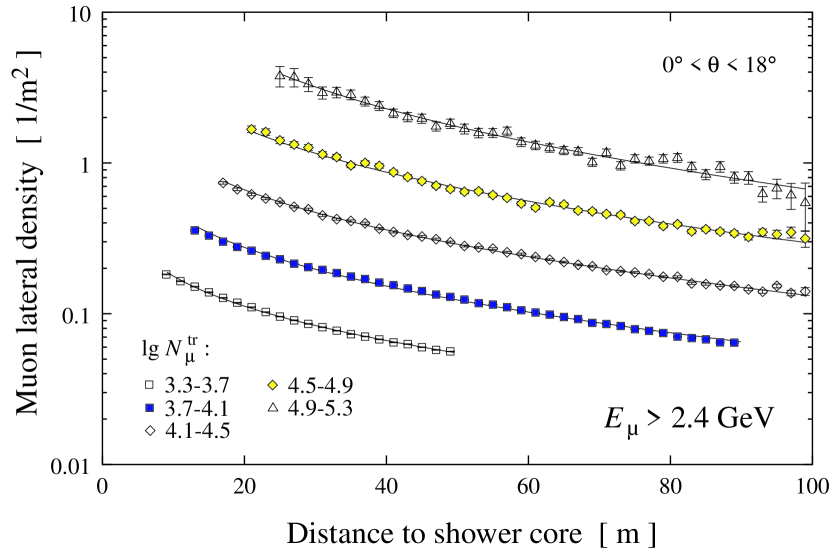
Muons with energies above 2.4 GeV are measured with the MWPC system and their LDF is presented in Fig. 9. Since these detectors are triggered only by the scintillators of the trigger plane and not by the array stations, full efficiency is reached only above the trigger threshold presently set at 7 counters in the trigger plane, i.e. at m-2. The chambers identify a muon as a track and no punch-through correction is applied. The lower core distance limit is applied mainly because of hadronic punch-through in EAS cores.
The lateral distributions obtained for the different thresholds are compared in Fig. 10. As expected, the muon density decreases with increasing threshold. The drop of about 10% between 230 and 490 MeV and of about 50% between 230 MeV and 2.4 GeV is nearly independent of primary energy and only weakly dependent on core distance.
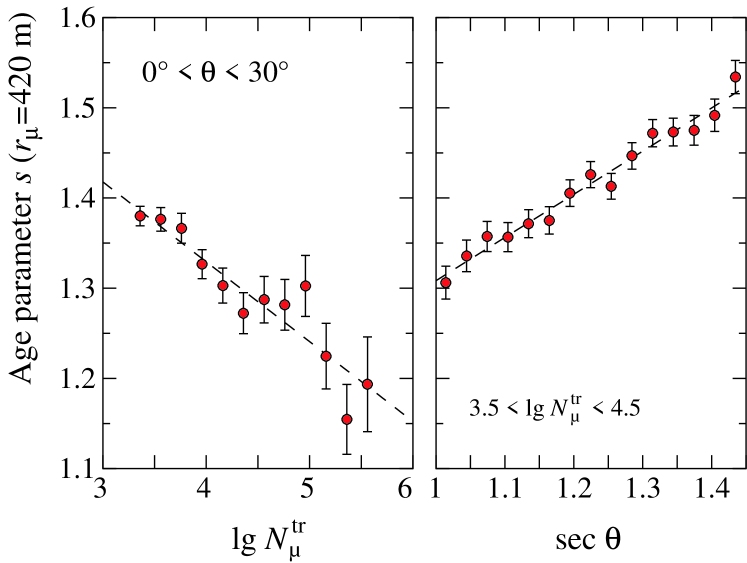
For all thresholds, the muon LDF flattens with increasing zenith angle and steepens with increasing shower size (see [33]). This is illustrated in Fig. 11 for muons above 230 MeV, where the age parameter in NKG functions fitted with a fixed m is shown. The observed effect is comparable to that of the electron LDF. With increasing primary energy, i.e. rising , the shower penetrates deeper into the atmosphere resulting in steeper lateral distributions. With increasing zenith angle, in contrast, the shower maximum recedes from the experiment resulting in correspondingly flatter distributions. This is partly compensated by a harder muon spectrum which is due to longer decay path lengths.
6 Hadron lateral distribution
Data on lateral distributions of hadrons studied over a large range of distances to the shower core are very scarce in the literature [17]. The KASCADE calorimeter operated jointly with the array detectors enables such investigations to be performed with high quality. Different from electrons and muons, the reconstruction of individual energies of hadrons enables to study in detail also the hadronic energy dependence of lateral distributions as well as to compare lateral particle and energy density distributions. As an example, Fig. 12 presents hadron lateral distributions for four sizes corresponding approximately to the energy interval from 1 to 10 PeV. The densities of hadrons and of hadronic energy are given. They extend up to distances of 90 m from the shower core where the intensity has dropped by nearly five orders of magnitude. At the very centre, a saturation as mentioned in section 3.5 can be noticed for the hadron number. Hence, in this range the hadronic energy is the more reliable observable.
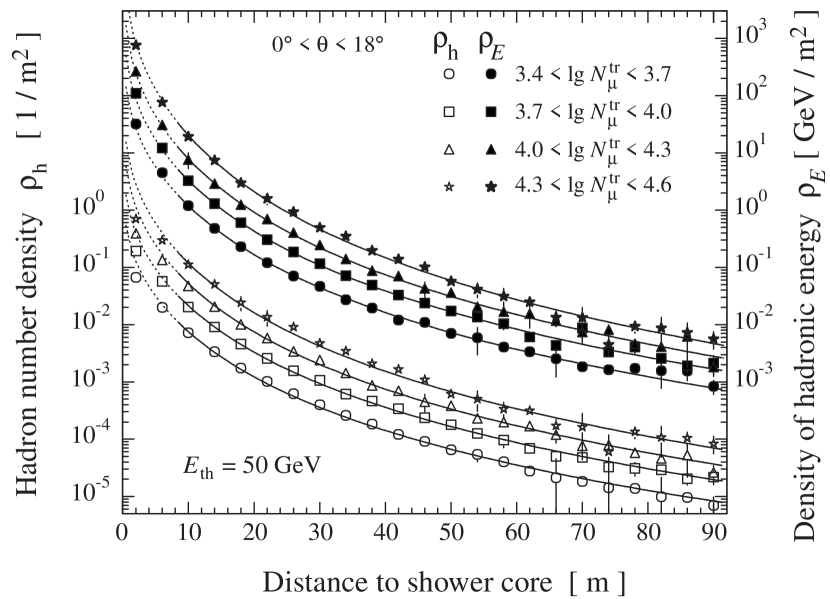
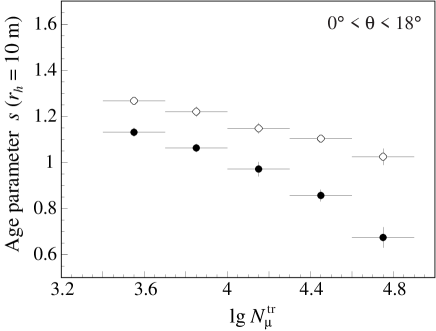
Several functions have been applied to fit the data points, among others exponentials suggested by Kempa [34]. However, by far the best fit was obtained when applying the NKG formula represented by the curves shown in the graph. Because of the mentioned saturation effects close to the shower centre, the actual fit is only applied to the data points within the range of the full lines while the dashed curves are extrapolations to smaller distances. The distributions are much narrower than those of the electrons and the scale radii determined by the fit are about m. Furthermore, a variation of the lateral shape is observed which is similarly to that of the electron LDF. When fixing = 10 m to determine the age parameters , we get the result presented in Fig 13. The age parameter yields values similar to the electromagnetic and muonic component and decreases with increasing shower size as expected.
The smaller scale radii and the observed variation with shower size may be interpreted in the picture of high energy hadrons passing through the atmosphere and generating essentially the electromagnetic component. Multiple scattering of electrons then resembles the scattering character of hadrons with a mean transverse momentum of 400 MeV/c almost irrespective of their energy. Hence, in a dimensional estimate of the hadronic lateral scale radius we substitute in the formula of the Molière radius, , the radiation length by the hadronic interaction length, the scaling energy MeV by the mean transverse momentum, and the critical energy (which approximately coincides with the average energy of the electrons at observation level) by the threshold energy of detected hadrons and arrive at a radius m, such as is observed experimentally.
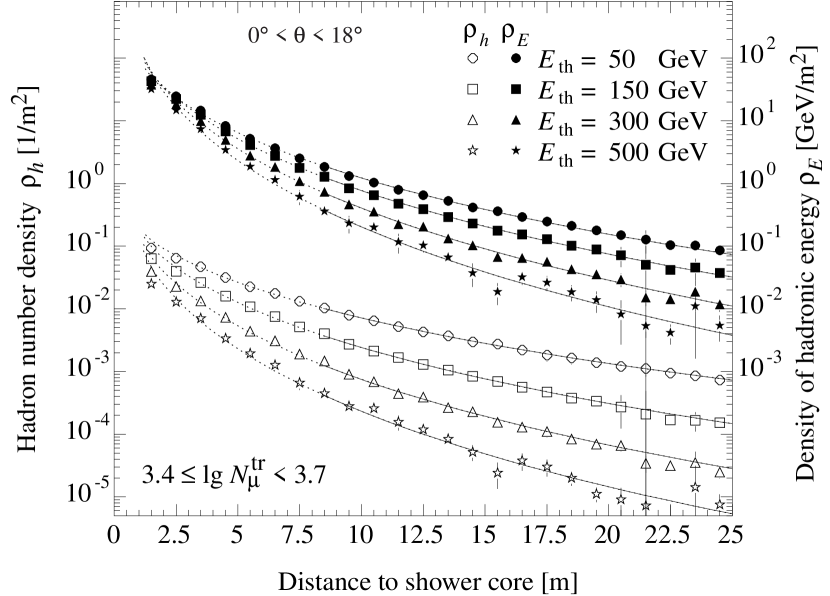
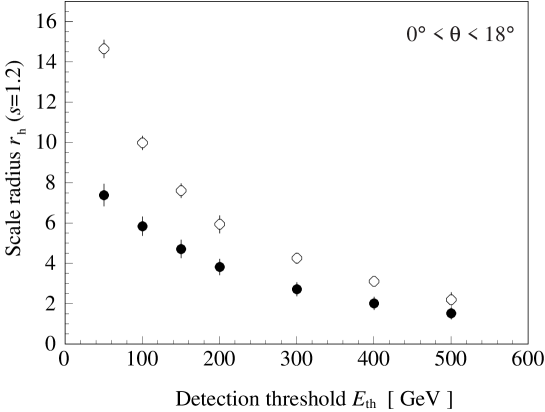
Figure 14 provides a closer view to the shower axis for different threshold energies. Again, hadron numbers and energy densities are given. We observe that energetic hadrons are concentrated very close to the centre. The number of TeV hadrons drops by an order of magnitude within the first 3 m. The energy density is well described by the NKG formula down to small distances to the shower axis. Deviations at distances up to about 1 m are attributed to the limited core position resolution of the detector. The variation of the hadronic scale radius, , with the detection threshold, , applied to the hadrons is displayed in Fig. 15. The data corroborate the expected dependence of the shower width on energy threshold, , as outlined above.
7 Summary and Outlook
Measurements of electron, muon, and hadron lateral distributions as recorded by the KASCADE experiment have been presented for radial distances of up to 200 m and for the energy range . Detector simulations were performed to account for effects like muon and hadron contamination in signals of the -scintillators and for punch-through of electrons and hadrons into the muon detectors.
All types of lateral distributions are well described by NKG-functions using different scale radii (with ) for the different air shower components.
-
•
A study of the electron LDFs shows that optimum fits are not obtained for the canonical value of m, but for m, i.e. we observe a stronger curvature in the experimental data than in the conventional NKG function. This imposes a systematic effect of up to 5 % in the integrated number of shower electrons. Due to the strong correlation of and , the preferred lower scale radius is accompanied by a larger age parameter of . The optimum set of parameters depends on shower size and zenith angle and may be used to infer the mass of the primary particle. For practical reasons and because of limited statistics within single events, information about the shape of the electron LDF is usually extracted by fixing and fitting only the age parameter . A problem specific to NKG functions in this approach and with small scale radii is, that upwards fluctuations of easily lead to ill defined shower sizes. As an alternative, we have demonstrated that a fixed age parameter but variable scale radius provides an equally good fit to the data. The parameter then changes in a characteristic way and also exhibits a distinct structure at shower sizes corresponding to the knee position.
-
•
Within the fiducial area of KASCADE, muon LDFs are well described by a NKG function, but with a scale radius of m. Because of the limitation to 40 m 200 m, the experiment is not very sensitive to the actual value chosen and the data are also equally well described by a Greisen parametrization. Significant differences would only occur at radial distances outside the acceptance of the experiment. The unknown flat shape of the muon LDF at large distances imposes serious problems (even for much larger surface detector arrays) when calculating the total number of muons within an air shower. Most importantly, is subject to systematic shifts and increased fluctuations, thereby deteriorating the shower size and primary energy resolution. Thus, for classifying events, we have introduced the truncated muon number, , obtained from integrating the LDF only within the experimental acceptance of 40-200 m. A rough scan of the low energy muon spectrum has been performed by analysing LDFs at , 490, and 2400 MeV. Similarly to electrons, a steepening of the muon LDF is observed with increasing shower size and decreasing zenith angle, as is expected for observations being increasingly closer to the shower maximum.
-
•
Quite interestingly, also hadronic lateral energy density and particle number distributions are well approximated by the NKG form up to distances of at least 90 m. The scale radius for GeV is m and scales roughly proportional to , as expected by a simple dimensional comparison of electromagnetic multiple scattering and hadronic interactions.
-
•
The interrelation between the electromagnetic and hadronic EAS component may explain the ‘unconventional’ small preferred scale radius of the electron LDF of 20-30 m as compared to the classical value of m. It should be kept in mind that the classical Molière radius has been derived for pure electromagnetic showers and for zero energy threshold only. However, extensive air showers are mostly initiated by primary hadrons. Therefore, the shower evolution is mostly driven by the substantially narrower hadronic component, and the effective lateral scale radius of observed electrons is expected to be smaller than for electrons in pure -initiated showers.
The present paper is not focussed to detailed analyses in terms of predictions of the EAS developments from Monte Carlo simulations and to a comparison of different theoretical high-energy interaction approaches like VENUS [35], QGSJET [29] and SIBYLL [36]. These models, continuously in the process of refinement, are generators implemented into the Karlsruhe EAS Monte Carlo code CORSIKA [27]. However, the presented results provide a coherent experimental basis for serious tests considering simultaneously the three main EAS components, not only concerning the interaction but also the particle propagation procedures. It may be noted that the muon lateral distributions are experimentally given for three different energy detection thresholds of the registered muons, thus implying also some sensitivity to the low energy spectrum. Most valuable for such tests are observations based on the hadronic component. An example of first analyses in this scope were presented in [37] and a remarkable agreement of lateral distributions of hadrons for primary protons and Fe nuclei was observed. In particular, the absence of peculiar features, in contrast to earlier observations by Danilova et al. [16] and Arvela and Elo [18] can be stated, even at energies as high as 10 PeV. Such results support the trust in a correct handling of the particle propagation and of the development of the hadronic component at least for hadron energies above 50 GeV. More detailed comparisons of lateral distributions with CORSIKA simulations are under study and will be subject of a forthcoming publication.
Acknowledgements
The authors are indebted to the members of the engineering and technical staff of the KASCADE collaboration, who contributed with enthusiasm and engagement to the success of the experiment.
The support, based on common projects of Scientific-Technological Cooperation Agreements (WTZ) and provided by the Ministery for Research of the German Federal Government and International Bureau Bonn, is gratefully acknowledged. The collaboration has been partly supported by grants of the Polish Committee for Scientific Research, the Romanian Ministery of Research and Technology, of the Armenian Government and an ISTC project (A116).
References
- [1] P. Auger et al., Rev. Mod. Phys. 11 (1939) 288.
- [2] K. Greisen, Ann. Rev. Nucl. Sci. 10 (1960) 63.
- [3] K. Kamata and J. Nishimura, Prog. Theoret. Phys. Suppl. 6 (1958) 93.
- [4] J. Nishimura, Handbuch der Physik, volume 46/2, pp. 1–114, Springer-Verlag, 1967.
- [5] S. Yoshida et al., J. Phys. G: Nucl. Part. Phys. 20 (1994) 651.
- [6] A. V. Glushkov et al., Proc. 25th ICRC, Durban, Vol. 6, p. 233, 1997.
- [7] R. N. Coy et al., Astroparticle Physics 6 (1997) 263.
- [8] A. M. Hillas and J. Lapikens, Proc. 15th ICRC, Plovdiv, Vol. 8, p. 460, 1977.
- [9] J. N. Capdevielle, J. Gawin, and J. Procureur, Proc. 15th ICRC, Plovdiv, Vol. 8, p. 341, 1977.
- [10] A. A. Lagutin et al., Proc. 25th ICRC, Durban, Vol. 6, p. 285 and p. 289, 1997.
- [11] R. Armitage et al., J. Phys. G 13 (1987) 707.
- [12] N. Hayashida et al., J. Phys. G 21 (1995) 1101.
- [13] M. Aglietta et al., Nuovo Cimento B 112B (1997) 139.
- [14] J. Linsley, Proc. 8th ICRC, Jaipur, Vol. 4, p. 77, 1963.
- [15] A. M. Hillas et al., Proc. 11th ICRC, Budapest, Vol. 3, p. 533, 1969; Acta Physica Academiae Scientarium Hungaricae 29, Suppl. 3, pp. 533-538, 1970.
- [16] T. V. Danilova et al., Proc. 19th ICRC, La Jolla, Vol. 7, p. 40, 1985.
- [17] H. Hasegawa et al., Proc. 9th ICRC, London, Vol. 2, p. 642, 1965.
- [18] H. Arvela and A.-M. Elo, Proc. 24th ICRC, Rome, Vol. 1, p. 332, 1995.
- [19] R. H. Vatcha and B. V. Sreekantan, J. Phys. A 6 (1973) 1050.
- [20] R. H. Vatcha and B. V. Sreekantan, J. Phys. A 6 (1973) 1067.
- [21] G. Cocconi, Handbuch der Physik, volume 46/1, pp. 215–271, Springer-Verlag, 1961.
- [22] S. V. Ter-Antonian et al., Proc. 24th ICRC, Rome, Vol. 1, p. 369, 1995.
- [23] R. Ticona et al., Proc. 23rd ICRC, Calgary, Vol. 4, p. 331, 1993.
- [24] P. Doll et al., (KASCADE Collaboration), The Karlsruhe cosmic ray project KASCADE, Report KfK 4686, Kernforschungszentrum Karlsruhe, 1990.
- [25] H. O. Klages et al., (KASCADE Collaboration), Nucl. Phys. B, Proc. Suppl. 52B (1997) 92.
- [26] J. Engler et al., Nucl. Instr. and Meth. A 427 (1999) 528.
- [27] D. Heck et al., CORSIKA: A Monte Carlo code to simulate extensive air showers, Report FZKA 6019, Forschungszentrum Karlsruhe, 1998.
- [28] J. Weber et al., (KASCADE Collaboration), Proc. 25rd ICRC, Durban, Vol. 6, p.153, 1997.
- [29] N.N. Kalmykov, S.S. Ostapchenko, A.I. Pavlov, Nucl. Phys. 52B (1997) 17.
- [30] Application Software Group, GEANT - Detector Description and Simulation Tool, CERN, Geneva, 1993.
- [31] H.H. Mielke, Internal Report FZK 51.02.03-01, Forschungszentrum Karlsruhe, 1996
- [32] R. Glasstetter et al., (KASCADE Collaboration), Proc. 26rd ICRC, Salt Lake City, Vol. 2, p.222, 1999.
- [33] A. Haungs et al., (KASCADE Collaboration), Features of the EAS muon density distributions measured with the KASCADE experiment, Report FZKA 6263, Forschungszentrum Karlsruhe, 1999.
- [34] J. Kempa, Nuovo Cimento 31A (1976) 568 and 581.
- [35] K. Werner, Physics Reports 232 (1993) 87.
- [36] R.S. Fletcher et al., Phys. Rev. D 50 (1995) 5710.
- [37] T. Antoni et al., (KASCADE Collaboration), J. Phys. G 25 (1999) 2161.