Exploration of the BaSeL stellar library for 9 F-type stars COROT potential targets⋆
The Basel Stellar Library (BaSeL models) is constituted of the merging of various
synthetic stellar spectra libraries, with the purpose of giving the most comprehensive
coverage of stellar parameters. It has been corrected for systematic deviations
detected in respect to UBVRIJHKLM photometry at solar metallicity, and can then be
considered as the state-of-the-art knowledge of the broad band content of stellar
spectra.
In this paper, we consider a sample of 9 F-type stars with detailed spectroscopic
analysis to investigate the Basel Stellar Library in two photometric systems
simultaneously, Johnson (BV, UB) and Strömgren (by, m1, and c1).
The sample corresponds to potential targets of the central seismology programme
of the COROT space experiment, which have been recently observed at OHP.
The atmospheric parameters Teff, [Fe/H], and log g obtained from the BaSeL
models are compared with spectroscopic determinations as well as with results of other
photometric calibrations.
For a careful interpretation of the BaSeL solutions, we computed confidence regions
around the best 2-estimates and projected them on Teff-[Fe/H],
Teff-log g, and log g-[Fe/H] diagrams. We first derive the 3 atmospheric
parameters from the full photometric information available (Johnson and Strömgren data).
The BaSeL library has only been calibrated for broad band UBVRIJHKLM
photometry, and it presents therefore intrinsic limitations in respect to other
photometric systems, especially with different bandwidth.
Thus, using this combination (Johnson and Strömgren), BaSeL temperatures are
systematically lower ( 130K), and the discrepancy for the gravity and the
metallicity can be quite large in comparison to the other methods.
To disentangle these unexpected discrepancies, we fixed the temperatures at their
spectroscopic values and studied the relative influence of each colour index in
the log g-[Fe/H] diagrams.
We find inconsistent results between Strömgren and Johnson synthetic colours.
While the Johnson colours give impressively good log g-[Fe/H] solutions, the combination
of the m1 and c1 Strömgren synthetic indices does not provide reliable results.
This is not, of course, due to any intrinsic superiority of the UBV over
the Strömgren system, but to the properties of the BaSeL models.
Finally, in order to simultaneously and accurately determine the stellar parameters
Teff, [Fe/H] and log g, we suggest to use the combination of the synthetic BaSeL
indices BV, UB and by rather than BV, UB, by, m1 and c1.
Key Words.:
Stars: fundamental parameters – Stars: abundances – SurveysBased on observations made on the 193cm telescope at Observatoire de Haute-Provence, France and data from the ESA Hipparcos satellite
1 Introduction
The Basel Stellar Library (BaSeL) is a library of theoretical spectra
corrected to provide synthetic colours consistent with empirical colour-temperature
calibrations at all wavelengths from the near-UV to the far-IR (see Cuisinier et al. 1996
for the correction procedure, and Lejeune et al. 1998 and references therein for a complete
description).
These model spectra cover a large range of fundamental parameters
(2000 Teff 50,000 K, 5 [Fe/H] 1
and 1.02 log g 5.5)
and their photometric calibrations are regularly updated (for instance, the
calibrations in the very low metallicity range is being improved by comparisons with
globular cluster populations, Westera et al. 1999) and extended to an even larger set of
parameters (see Lejeune et al. 1997, Lejeune et al. 1998, and Lejeune et al. 2000).
The BaSeL library spectra have been calibrated directly for standard dwarf and
giant sequences at solar abundances and using UBVRIJHKLM broad-band photometry, and
are hence expected to provide excellent results in these photometric bands.
Since they are based on synthetic spectra, they can in principle be used in many
other photometric systems taken either individually or simultaneously, and this is
another major advantage of these models.
For these reasons, they are currently used in an increasing number of astrophysical
studies (e.g. Bruzual et al. 1997, Weiss & Salaris 1999, Kurth et al. 1999).
Nevertheless, little attention has been paid until now to validate the possibilities
offered by the BaSeL models in several photometric bands simultaneously.
The fact that the library spectra have been calibrated using broad-band observations
(UBVRIJHKLM) does not necessarily imply that similarly reliable results can be expected
from their application to intermediate- and/or narrow-band photometry data.
On the contrary, the extent to which the coarse UBVRIJHKLM calibration
provides useful results even at higher resolution requires separate investigation.
In this paper, we investigate the BaSeL models using Johnson and Strömgren photometric
systems simultaneously.
BaSeL Strömgren photometry has been previously tested with success against
stars belonging to double-lined eclipsing binaries for which gravities are accurately
known (Lastennet et al. 1999a).
Here we use a sample of 9 F-type stars for which detailed spectroscopic analysis has
been performed.
These stars are potential candidates of the COROT (COnvection and ROTation) space experiment
main programme (see for instance Catala et al. 1995, Michel et al. 1998, and Baglin et al.
1998 for details), and has been observed at the 193cm telescope at Observatoire de
Haute-Provence (OHP, France) as part of the target selection process.
High signal to noise ratio (S/N 150) spectra have been obtained using
Elodie echelle spectrograph and analysed by comparison with theoretical spectra
(Lignières et al. 1999).
This set of new spectroscopic data together with both Johnson and Strömgren photometry
from the literature provides a unique test of the predicted results of the BaSeL
library.
In addition, other calibration methods, namely the Templogg programme (based on Napiwotzki
et al. 1993, and Künzli et al. 1997) and the Marsakov & Shevelev (1995) catalogue,
provide further comparisons.
The paper is organized as follows: Sect. 2 deals with the description of our working
sample of stars and the extinction issue, Sect. 3 presents the various methods
used to derive estimates of Teff, [Fe/H], and log g, and Sect. 4 is devoted
to the presentation and the discussion of the results, with particular emphasis put on
the intrinsic properties of the BaSeL library spectra in Sect. 5.
Finally, Sect. 6 draws our general conclusions.
2 The sample: relevant data and reddening
2.1 Basic data for the 9 stars
The photometric data in the Johnson (BV and UB) and Strömgren (by, m1, c1) systems of our working sample of F-type stars are presented in Table 1, along with cross-identifications, Hipparcos parallaxes () and rotational velocities (v sini is derived from the application of the Least-Squares Deconvolution method of Donati et al. 1997 on the OHP spectra).
2.2 Reddening
Estimates of the extinction are required for photometric calibration methods and in particular for the BaSeL and Templogg methods used in this paper. Parallaxes listed in Table 1 from the Hipparcos catalogue (ESA, 1997, see also Perryman et al. 1997) show that all the stars are in the close solar neighborhood ( 45 pc). While reddening is generally expected to be close to zero inside this very local sphere (e.g. Welsh et al. 1991), we checked this by applying the extinction model of Vergely (1998) to our stars. This model has been constructed from a sample of 4000 stars (in a sphere of 250 pc) with Strömgren photometry and provides extinction as a function of position and distance 111However, it is also worth noticing that this model neglect small clumps and circumstellar extinction, which means that if there is a small clump with a high density on the line of sight, the model underestimates the extinction. The / values (3.3%) reported for the present stars in the Hipparcos Catalogue ensure that our extinction estimates cannot be seriously affected by distances uncertainties. Results are shown in Table 1 (col. E(by)) and confirm that the reddening is very close to zero for all stars. Such small values have no influence on the inferred photometric results presented in this paper, and will thus be neglected. Therefore, all the results obtained in the remainder of this paper will be given without reddening.
| ID† | HD | HIP | (mas) | E(by) | v sini | BV | UB | by | m1 | c1 |
|---|---|---|---|---|---|---|---|---|---|---|
| 1 | 43587 | 29860 | 51.760.78 | 0.001 | 2 | 0.610.01 | 0.100.01 | 0.3840.01 | 0.1870.03 | 0.3490.03 |
| 2 | 43318 | 29716 | 28.020.76 | 0.002 | 5 | 0.490.01 | 0.000.01 | 0.3220.03 | 0.1540.03 | 0.4460.03 |
| 3 | 45067 | 30545 | 30.220.92 | 0.001 | 6 | 0.560.01 | 0.070.01 | 0.3610.02 | 0.1680.03 | 0.3960.03 |
| 4 | 49933 | 32851 | 33.450.84 | 0.001 | 10 | 0.390.01 | 0.090.02 | 0.2700.02 | 0.1270.04 | 0.4600.03 |
| 5 | 49434 | 32617 | 24.950.75 | 0.002 | 79 | 0.2950.015 | 0.050.03 | 0.1780.01 | 0.1780.02 | 0.7170.03 |
| 6 | 46304 | 31167 | 23.130.76 | 0.002 | 200 | 0.250.01 | 0.060.01 | 0.1580.01 | 0.1750.02 | 0.8160.04 |
| 7 | 162917 | 87558 | 31.870.77 | 0.004 | 25 | 0.420.01 | 0.030.02 | 0.2800.02 | 0.1660.06 | 0.4580.01 |
| 8 | 171834 | 91237 | 31.530.75 | 0.004 | 64 | 0.370.01 | 0.040.01 | 0.2540.04 | 0.1450.01 | 0.5600.04 |
| 9 | 164259 | 88175 | 43.110.75 | 0.003 | 76 | 0.380.01 | 0.010.01 | 0.2530.01 | 0.1530.01 | 0.5600.04 |
† Arbitrary running number.
3 Description of the different methods
In this section, we present the various methods used to derive Teff, [Fe/H], and log g. Apart from the BaSeL models, a detailed spectroscopic analysis and two photometric calibrations have been considered.
3.1 Photometric analysis
3.1.1 The BaSeL models
For the present work, more than 50700 models have been computed by interpolation by two of us (Lastennet and Lejeune), each model giving synthetic photometry in the Johnson and Strömgren systems for a set of (Teff, [Fe/H], log g). In order to fit the observed colours of the target stars, we have computed a fine grid in the (Teff, [Fe/H], log g) parameter space. The grid explored is defined in this way: 5000 Teff 8000K in 20K steps, 1 [Fe/H] 0.5 in 0.1 steps, and 3 log g 5 in 0.1 steps. These parameter ranges are reasonable matches to the expected properties of F dwarfs, for which the BaSeL library includes the Kurucz atmospheric models (Mixing Length Theory of convection with , and with the overshooting parameter equal to 1).
In order to derive simultaneously the effective temperature (Teff), the metallicity ([Fe/H]), and the surface gravity (log g) of each star, we minimize the -functional defined as:
where col(i) and (col(i)) are the observed values (BV,
UB, by, m1, and c1) and their error bars, as reported
in Table 1, and col(i)mod are obtained from the synthetic
computations of the BaSeL models.
A similar method has already been developed
and used by Lastennet et al. (1996, 1999b) for CMD diagrams.
With 5 observational data (BV, UB, by, m1 and c1 for each star) and
3 free parameters (Teff, log g and [Fe/H]), we expect to
find a -distribution with 2 degrees of freedom.
Since the -value is an estimation of the quality of the fit, with 2 degrees of
freedom (DOF), a -value smaller than 6 is a good fit, because it means that
the probability P that this DOF=2 is smaller than 6 is about 95%, i.e.
P(DOF=2) 6 95 %. This criterion will change according to the
DOF, but basically, small values are signatures of good fits.
In the remainder of this paper, the -values
generally satisfy this criterion being most of the time much better,
hence by default they will not be discussed when they are good.
A -grid is formed in the (Teff, log g, [Fe/H]) parameter space.
Once the central minimum value is found, we compute the surfaces
corresponding to 1, 2, and 3 confidence levels.
For clarity, the intersection of these confidence surfaces with the appropriate
plane will be displayed (e.g. Teff-[Fe/H] in Fig.1, Teff-log g in Fig. 2).
3.1.2 The ”Templogg” method
We have also run the ”Templogg” program which is designed to determine effective temperature and log g from either Strömgren or Geneva photometry. For Strömgren photometry it uses a Fortran program written by E. Fresno which relies upon the grids of Moon & Dworetsky (1985) in the Teff-log g parameter space relevant to this paper, with the improvements by Napiwotzki et al. (1993). For Geneva photometry it uses a Fortran program written by M. Kunzli (see North et al. 1994). The program chooses among eight different regions in the HR diagram for selecting the best calibration within the Strömgren system and three different regions for the Geneva system. The results from this method are gathered in Table 2.
3.1.3 The catalogue of Marsakov & Shevelev (1995)
Marsakov & Shevelev (1995) (hereafter [MS95]) have computed effective temperatures and surface gravities using Moon’s (1985) method, which is also based on the interpolation of the grids presented in Moon & Dworetsky (1985). According to Moon (1985), the standard deviations of the derived parameters are Teff 100 K and log g 0.06. The metallicities of Marsakov & Shevelev (1995) are obtained with the equation of Carlberg et al. (1985):
where 2.72 , and the colour excess m1 and the Strömgren index are determined from (by). All the [MS95] results relevant for our sample are given in Tab. 2.
3.2 Spectroscopic analysis
The fundamental stellar parameters have been derived from a detailed analysis of spectra with high signal to noise ratio (S/N 150) obtained at OHP with the Elodie echelle spectrograph (spectra ranging from 3906 Å to 6811 Å at a resolution of 42000). After reduction, the observed spectra were compared with theoretical ones constructed from a combination of Kurucz atmospheric models (ATLAS9 - Mixing Length Theory of convection with and without overshooting. This choice of parameters different than those used by Kurucz is fully justified in van’t Veer-Menneret & Mégessier (1996)), the VALD-2 atomic database (Kupka et al. 1999), and the SYNTH radiative transfer codes (Piskunov 1992) and BALMER9 (Kurucz 1993). In addition, the Least-Squares Deconvolution method (Donati et al. 1997) provided accurate determination of the projected rotational velocities listed in Tab. 1. Details about these determinations are given in the two next subsections and the results are summarized in Tables 1 and 2. Note that the level of accuracy of these results, initially designed to select COROT targets, is sufficient for the purpose of the present study.
3.2.1 Determination of Teff from the H line
The effective temperature can be determined by taking advantage of the sensitivity of H line wings. Most importantly, detailed studies (e.g. van ’t Veer-Menneret & Mégessier 1996), have shown that the H line is independent of the surface gravity (for non-supergiant stars) for effective temperatures ranging from 5000 K to 8500 K, and depends only slightly on the metallicity. Teff is therefore obtained for each star of the sample by fitting the observed H line with synthetic spectra computed from a grid of solar metallicity atmospheric models separated by 250K.
3.2.2 Determination of the surface gravity and metallicity
Within the temperature range that we found, we noticed that Fe I absorption lines depend only on temperature and metallicity, being practically independent of the surface gravity, while Fe II lines are sensitive to the temperature, metallicity and gravity. Consequently, the temperature being known from the H line, the metallicity along with the microturbulence velocity are determined first by fitting a set of weak and strong Fe I lines. Then, the gravity is obtained by fitting Fe II lines. The spectral region near 6130 Å proved to be suitable for this analysis. However, the line broadening induced by rotation tends to mix neighbouring lines and prevent the analysis of individual Fe lines for high values of v sini (HD 49434, HD 46304, HD 171834 and HD 164259).
3.3 Other determinations in the literature
To be as complete as possible, we looked for other determinations available in the literature and the SIMBAD database. One of the most comprehensive sources for our purpose is the fifth Edition of the catalogue of Cayrel de Strobel et al. (1997), which includes [Fe/H] determinations and atmospheric parameters (, log g) obtained from high-resolution spectroscopic observations and detailed analyses, most of them carried out with the help of model atmospheres. However, the stars of our sample are not included in this catalogue. Since the catalogue comprises the literature (700 bibliographical references) up to December 1995, we only looked for more recent references. To the best of our knowledge, the catalogue of metallicities of Zakhozhaj & Shaparenko (1996) (hereafter [ZS96]) is the only one which contains useful information for our purpose. These metallicities are obtained from photometric UBV data and are available for two stars of our sample: HD 43587 and HD 164259 (see Table 2).
| ID† | 1 | 2 | 3 | 4 | 5 | 6 | 7 | 8 | 9 | |
|---|---|---|---|---|---|---|---|---|---|---|
| HD | 43587 | 43318 | 45067 | 49933 | 49434 | 46304 | 162917 | 171834 | 164259 | |
| Method | ||||||||||
| Teff | Templogg | 6009 | 6420 | 5982 | 6535 | 7321 | 7379 | 6587 | 6714 | 6789 |
| [MS95] | 5952 | 6280 | 6066 | 6625 | 6629 | 6739 | 6730 | |||
| BaSeLa | 5740 | 6040 | 6000 | 6420 | 7120 | 7200 | 6400 | 6580 | 6580 | |
| BaSeLc | 5720 | 6320 | 5940 | 6600 | 7240 | 7240 | 6660 | 6700 | 6820 | |
| Spectro.‡ | 6000 | 6250 | 6000 | 6500 | 7250 | 7250 | 6500 | 6750 | 6750 | |
| log g | Templogg | 4.32 | 4.20 | 4.16 | 4.25 | 4.16 | 3.93 | 4.32 | 4.02 | 4.11 |
| [MS95] | 4.11 | 4.05 | 4.02 | 4.46 | 4.49 | 4.10 | 4.10 | |||
| BaSeLa | 3.4 | 3.1 | 3.9 | 3.5 | 3.5 | 3.3 | 3.6 | 3.4 | 3.3 | |
| BaSeLb | bad fit | 4.5 | 3.8 | 3.9 | 4.0 | 3.4 | 4.0 | 4.1 | 4.0 | |
| BaSeLc | 4.3 | 4.5 | 3.8 | 4.3 | 4.0 | 3.4 | 4.5 | 3.9 | 4.2 | |
| Spectro.‡ | 4.5 | 4.0 | 4.0 | 4.0 | 4.0 | |||||
| [Fe/H] | Templogg | 0.13 | 0.18 | 0.15 | 0.48 | 0.03 | 0.09 | 0.03 | 0.20 | 0.11 |
| [MS95] | 0.15 | 0.18 | 0.17 | 0.35 | 0.08 | 0.15 | 0.05 | |||
| BaSeLa | 0.2 | 0.5 | 0.0 | 1.0 | 0.5 | 0.9 | 0.5 | 0.8 | 0.6 | |
| BaSeLb | bad fit | 0.1 | 0.0 | 0.8 | 0.1 | 0.8 | 0.3 | 0.4 | 0.2 | |
| BaSeLc | 0.2 | 0.0 | 0.1 | 0.6 | 0.1 | 0.8 | 0.0 | 0.5 | 0.0 | |
| Spectro.‡ | 0.1 | 0.3 | 0.1 | 0.5 | 0.2 | |||||
| [ZS96] | 0.03 | 0.03 |
4 Multi-colour exploration of the BaSeL models: comparisons and discussion
In this section, we will discuss the results obtained from the exploration of the BaSeL model properties in the Johnson and Strömgren photometric systems (the best solutions from the BaSeL models and from the other methods are summarized in Table 2). First we discuss the results in the Teff, log g, [Fe/H] parameter space using all the photometric indices. Discrepancies between synthetic and spectroscopic results led us to consider solutions derived from Johnson and Strömgren photometry separately, by fixing (in the second part of this discussion) Teff at its spectroscopic values and investigating the BaSeL properties in log g-[Fe/H] diagrams. Finally, we present the most reliable combination of synthetic photometry indices to get Teff, log g and [Fe/H] simultaneously.
4.1 Simultaneous Teff, log g, [Fe/H] determinations using all the photometric indices
The results obtained with all the methods described in Sec. 3 are shown in Teff-[Fe/H]
diagrams (Fig. 1) and Teff-log g diagrams (Fig. 2)
for the 9 stars of our sample.
The solutions from the BaSeL models (i.e. the best -solution plus the 1-, 2- and 3-
confidence level contours) are
obtained in order to fit simultaneously the 5 available observed photometric values of Tab. 1:
(BV), (UB), (by), m1, and c1.
For each star, the contour solutions are displayed in a log g constant plane
(Fig. 1) or an [Fe/H] constant plane (Fig. 2),
corresponding to the best simultaneous (Teff, [Fe/H], log g) solutions derived from
the BaSeL models.
When available, the results from the spectroscopic analysis (diamond with error bars) as
well as from the ”Templogg” programme (square), and Marsakov & Shevelev (1995) (triangle)
are projected in these diagrams for comparison.
As far as the effective temperature is concerned, the overall agreement is good between all
the methods.
However, with comparison to spectroscopy, the BaSeL models give systematically lower values:
Teff Teff(spectro) Teff(BaSeL)
130K on average (which is comparable to the result of Cuisinier et al. 1994).
On the other hand, the Templogg method gives systematically larger values (by 60K on
average). Results given by either the [MS95] catalogue or the Templogg method are essentially
identical.
There is no such overall agreement for the surface gravity and the metallicity,
and this disagreement is neither correlated with increasing temperature nor with increasing v sini.
For instance in Fig. 2, while the systematic disagreement in gravity appears
for stars with the hottest spectroscopic temperatures and high rotation speeds (HD 49434,
HD 46304, HD 171834 and HD 164259), the disagreement is even worse for the cooler and slowly
rotating star HD 43318.
Thus, except in one case (HD 45067) where the match is perfect for both log and [Fe/H],
BaSeL-derived metallicities and gravities are systematically lower than the values obtained from
the other methods.
In particular, the best- values of log g inferred from the synthetic BaSeL colours
range between 3.1 and 3.9, indicating possible evolved/sub-giant stars, which is ruled out
by spectroscopic determinations (listed in Tab. 2).
Even if inspection of the confidence contours might temper this conclusion by pointing out
that the BaSeL results are sometimes compatible to 3-, the systematic behaviour
remains, at least for the small sample studied, and requires further analysis.


4.2 Simultaneous [Fe/H]-log g determinations using various combinations of photometric indices
Since it appears that the BaSeL models have difficulties reproducing simultaneously
the 3 parameters with all the photometric information (Strömgren plus Johnson),
we checked if this remains true using either Johnson or Strömgren photometry
separately, in order to find out which photometric strategy would improve the situation.
As only two Johnson indices are available in the data (Table 1), namely BV and UB,
the three fundamental parameters cannot be derived simultaneously using Johnson
photometry alone.
Therefore, we choose to fix the effective temperature derived from spectroscopy, and
results for Johnson (Fig. 3) and Strömgren (Fig. 4)
are compared in log g-[Fe/H] diagrams.
Note that the m1 and c1 indices are optimized linear combinations of colour indices
designed for the purposes of measuring metallicity and surface
gravity, respectively, whereas UBV was not designed at all on such physical considerations.
Therefore, the m1 and c1 indices should a priori give the best determinations
of [Fe/H] and log g.
The effective temperature being fixed to its spectroscopic value,
the metallicity and the surface gravity of each star are determined simultaneously
by minimizing the following -functional:
where col(i) and (col(i)) are the observed values and their error bars respectively, and col(i)mod are obtained from the synthetic computations of the BaSeL models.


Figures 3 and 4 display the log g-[Fe/H] solutions
for Johnson and Strömgren, respectively.
The impressively good results of Fig. 3 show that for the spectroscopic
temperatures, the BaSeL library spectra provide log g values which deviate from the
spectroscopic values neither by a significant amount, nor in a systematic manner.
A similar, only slightly weaker agreement holds for the metallicities: they come out
within less than 0.2 dex from the spectroscopic results, which is excellent in
view of the intrinsic accuracy ( 0.2 dex) that can be obtained
from empirical UBV data and calibrations (e.g. Buser & Kurucz 1992).

Direct comparison of Fig.3 with Fig. 4 - which uses the information on all the Strömgren indices - clearly shows that the results from Johnson and Strömgren are not compatible. In most cases, even the 1- contours are partly outside the log g-[Fe/H] diagrams in Fig. 4, suggesting that the best solutions inferred from the 3 Strömgren synthetic indices are perhaps even further away from the expected values. We performed various tests to identify which synthetic Strömgren index (indices) is (are) responsible for the disagreement with the Johnson solutions. We add separately each Strömgren index to the UBV data, in order to highlight the influence of each of them on the contours derived from the Johnson data. The indices m1 and c1 are clearly found to modify the Johnson contours, in the sense of degrading the results. On the other hand, by does not modify the UBV confidence contours. This last point is illustrated by comparing Fig. 3 (BV, UB) with Fig. 5 (BV, UB and by). We observe that neither the contours nor the values are modified by the addition of the by index to the BV and UB indices.
| ID† | HD | Teff‡ | Teff(BaSeL) | |
|---|---|---|---|---|
| (spectro) | 3log g5 | 1[Fe/H]0.5 | ||
| 1 | 43587 | 6000 | 5860-5940 | 5680-5910 |
| 2 | 43318 | 6250 | 6260-6315 | 6160-6320 |
| 3 | 45067 | 6000 | 6020-6070 | 5850-6060 |
| 4 | 49933 | 6500 | 6590-6750 | 6610-6730 |
| 5 | 49434 | 7250 | 7055-7440 | 7305-7380 |
| 6 | 46304 | 7250 | 7150-7610 | 7440-7510 |
| 7 | 162917 | 6500 | 6525-6665 | 6525-6650 |
| 8 | 171834 | 6750 | 6685-6875 | 6730-6850 |
| 9 | 164259 | 6750 | 6685-6875 | 6730-6850 |
† Running number as in Tab. 1
‡ Estimated error: Teff250 K
The reason of this remarkable property is twofold:
first, the by index depends only slightly on log g and [Fe/H] in the parameter range
considered; and second, the BaSeL Teff associated with by is fully compatible
with the spectroscopic Teff for the 9 stars.
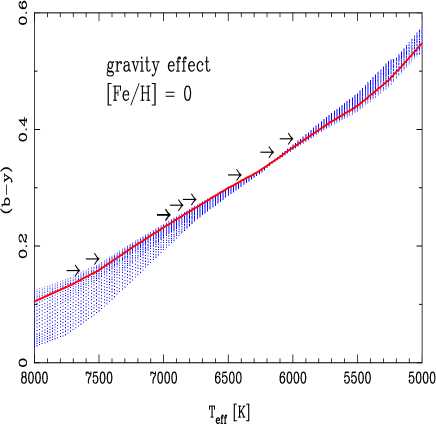
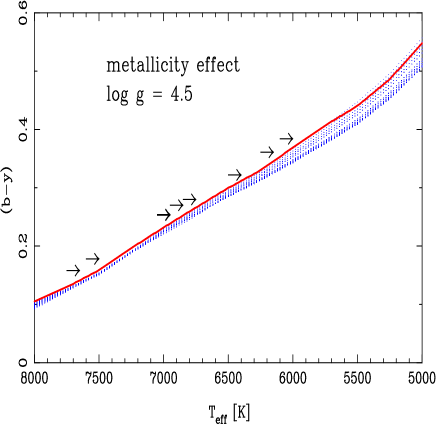
The first point is illustrated in Fig. 6 in the effective temperature range
5000-8000 K: the upper panel shows the effect of gravity (log g between 3 and 5) for constant
metallicity ([Fe/H] 0), and the lower one the effect of metallicity ([Fe/H] between 1
and 0.5) for constant gravity (log g 4.5).
It appears clearly from these two plots that the Tefff(by) relationship is little
influenced by surface gravity between 5800 and 6700 K, and by metallicity above 6500 K.
The second point is proved in Table 3, where Teff derived from the
BaSeL calibrations shown in Fig. 6 are in agreement with the
spectroscopic determinations. This underlines the reliability of temperature
determinations based on the synthetic by index derived from the BaSeL
models.
In conclusion, we find that synthetic Strömgren m1 and c1
account for the difference between the Johnson and Strömgren solutions.
We also find that BV, UB are the best BaSeL colours to derive log g and [Fe/H] when
Teff is fixed.
Since by gives good Teff estimates, this hence suggests that the BV, UB, by
combination, i.e. a combination of Johnson and Strömgren photometric indices,
should be able to produce reliable simultaneous estimates of the 3 fundamental parameters.
This suggestion is developed in the next part.
4.3 Best synthetic colour combination
Fig. 7 and 8 show the Teff-[Fe/H]-log g
results by using the prescription suggested in the previous paragraph, namely, BV, UB,
by. The results are also summarized in Table 2, where they are quoted as
BaSeLc.
A general comparison with the other methods shows that the BaSeL solutions are very satisfactory
for the 3 fundamental parameters:
effective temperatures are in excellent agreement, and [Fe/H] and gravities show good agreement.
The improvement is clear when compared with the original results presented in Figs.
1 and 2 because there is no longer any systematic trend
towards lower temperatures (see Tab. 2) and because the determinations of log
g and [Fe/H] are also much better, without systematic deviations.
There is only one exception (HD 46304): its Teff is in perfect agreement with
its spectroscopic value, but the predicted log g and [Fe/H] are still low.
While the BaSeL contours are consistent with the Templogg gravity only at the 2- level,
the metallicity predicted from the BaSeL models is poor in comparison to the result of the Templogg
calibration ([Fe/H]0.7).
What could explain this persistent difference ?
It is worth noticing that this star has a large v sini (200 km s-1, the
largest in our working sample), and it is well known that high rotational
velocities modify the colours. Since the expected colour effect due to
rotation is typically a few hundredths of a magnitude222These values
are highly dependent of spectral type, age, and chemical composition, see for
instance Maeder (1971) and Zorec (1992). in BV and increases with v sini,
this is probably part of the reason why the predictions of the BaSeL models
disagree with the Templogg method for this star (even if rotation is not
taken into account in the Templogg method).
In conclusion, except in the
case discussed before, reliable and simultaneous estimates of the 3
atmospheric parameters can be derived for F-type stars from only the three
synthetic BaSeL colours, BV, UB and by. This is a very useful
criterion for further applications.


5 Discussion
Some of the intrinsic properties of the BaSeL library spectra can explain why synthetic
Strömgren photometry does not increase the performance of UBV in determining
fundamental stellar parameters (most particularly, abundances and surface gravities),
as follows.
The fact that the library spectra have been calibrated using broad-band photometry
implies that their use in determining fundamental stellar parameters from
intermediate- and narrow-band photometry cannot be expected to provide results at
the same level of confidence.
Our results show that, in the particular domain studied, the broad-band
calibration is adapted for the by index but not for the m1 and c1 indices.
The reason is that, as by has been designed to measure the continuum, its synthetic
value is less affected than m1 and c1 by high-resolution spectral features.
Secondly, the library spectra have a typical resolution of 25Å in the wavelength
range where the corresponding synthetic photometry is being calculated.
For the Johnson broad-band UBV (with passbands of halfwidths in the range
500-1000Å) a factor of 2 more flux data points are used in the numerical
integrations than are used in those for synthesizing the Strömgren data
(where passbands have halfwidths of order 200Å). Since each flux point gives
the integrated flux in a 25Å passband and includes the effects of spectral
lines and bands, the magnitude of these effects – as well as their nonlinear
variations with abundance and/or surface gravity – on the actually observed
colours may be severely distorted in the computed colours (Buser 1978).
As a consequence, the accuracy of synthetic Strömgren photometry may be
significantly lower than it is for UBV, particularly for the m1 and c1 indices,
which are weighted sums involving three passbands each (such that errors accumulate
faster than in UBV indices).
Finally, a further comment on the impressively good accuracy of the BaSeL
determinations for the Johnson-Strömgren BV, UB, by combination
(see Figs. 7 & 8) is in order.
As mentioned before, the Strömgren by index provides a reliable measure of the
continuum and, therefore, a good temperature index.
This is particularly interesting, given the known difficulties of matching empirical
and theoretical BV-Teff scales to within better than about 0.03 mag
(see, e.g., Sekiguchi & Fukugita 2000)333
The by index is less vulnerable than BV to the secondary effects of surface
gravity and metallicity, even at the low spectral resolution given by the model spectra.
.
The fact that the UB and BV BaSeL colours give good measures of log g and [Fe/H]
is not surprising.
It is well known that if one does not ask UBV data to provide the temperature in the first
place (e.g., by using an independent source, such as spectroscopy, spectral classification,
or else suitable other photometry, such as Strömgren by), the sensitivities of
both UB and BV can be used to full advantage for determining log g and [Fe/H].
Moreover, although these sensitivities change with temperature, they
are near or even at their maxima in the F-dwarf star domain (e.g., Buser & Kurucz 1992).
This means that the derived values of [Fe/H] and log g presented in
Figs. 7 and 8 are as reliable as they can possibly
be, given the uncertainties in the colours.
6 Conclusion
Several methods of determination of the fundamental stellar parameters Teff,
log g and [Fe/H] are compared for nine single F stars.
Particular attention has been paid to the simultaneous predictions of the BaSeL models
in two photometric systems, Johnson and Strömgren.
We show that using all photometric data is not the best strategy to obtain reliable
simultaneous determinations of Teff, log g and [Fe/H] with the BaSeL models
in the temperature range relevant for this paper, because of intrinsic limitations of
the BaSeL library.
As a matter of fact, if one uses all five available photometric indices (BV, UB, by,
m1 and c1), only the agreement with spectroscopic determination for the effective
temperature is good, although the BaSeL-derived temperatures are slightly but systematically
lower. The discrepancies in gravity and metallicity are however rather high, with the BaSeL
predictions being too low.
Alternatively, we show that the best results are obtained by using BV, UB, by
in combination.
This BaSeL combination is the best because on the one hand the by synthetic index
gives reliable and accurate estimates of the effective temperature and, on the other hand,
BV and UB give good estimates of [Fe/H] and the surface gravity.
We wish to emphasize that, if Strömgren photometry is shown here to be less performing
than UBV as a device for determining fundamental stellar parameters (and, most particularly,
abundances and surface gravities), this is due to the fact that the BaSeL library spectra
have been calibrated by colour-calibration in UBVRIJHKLM; it is not, of course, due to an
intrinsic superiority of the UBV system over the Strömgren system.
Thus, because the BaSeL library has only been calibrated in the UBVRIJHKLM colours,
the best parameters derivations come from this system.
Whilst parameters derivations in equivalent bandwidth systems such as Washington seem to be
as good with the BaSeL libraries than with empirical methods (Lejeune 1997),
parameter derivations from the BaSeL library in narrow band systems such as Strömgren
photometry seem to be of poorer quality.
This work thus strongly suggests that the BaSeL library should be calibrated in various
photometrical systems, in various bandwidth (maybe using higher resolution synthetic
stellar spectra libraries) in order to represent in the best way the variety of the knowledge
of stellar spectral energy distributions that exists today in various photometric systems.
We found that the best combination to determine stellar parameters within the BaSeL
library, even with its limitation, was to use a combination of two Johnson colours,
UB and BV, and a Strömgren colour, by.
We also note that the agreement between Templogg and BaSeL for the hottest stars of the
sample could be especially useful in view of the well known difficulty of spectroscopic
determinations for fast rotating stars.
As far as the astrophysical applications are concerned, the BaSeL synthetic colours are
of particular interest in evolutionary synthesis and colour-magnitude diagram studies
of stellar populations, such as open clusters and young associations, where
(i) F-type stars are highly common and, of course,
(ii) a vast abundance of data are available in BV, UB and by colours.
Concerning the determination of the atmospheric parameters of the COROT potential
targets, a result of the present analysis is that all the methods give consistent solutions.
In the context of the further 1000 potential targets of the COROT exploratory programme,
it will be interesting to compare the results of the BaSeL models with those of
automated spectral analysis methods (e.g. Katz et al. 1998, and Bailer-Jones 2000).
Acknowledgements.
We would like to thank J.-L. Vergely for providing extinction calculations as well as J.C. Bouret, C. Catala and D. Katz for their participation in the spectral caracterization of the stars. We are fully indebted to R. Kurucz for all the codes and theoretical data so generously displayed. E.L. and F.L. are supported by PPARC postdoctoral fellowship. Th. Lejeune gratefully acknowledges financial support from the Swiss NSF (grant 20-53660.98 to R.B.), and Th. Lüftinger from the ’Fonds zur Förderung der wissenschaftlichen Forschung’. F.C. thanks FAPERJ for partial funding, through the grant E-26/171.368/1999. This research has made use of the QMW Starlink resource facilities and the SIMBAD database operated at CDS, Strasbourg, France.References
- (1) Baglin A., et al., 1998, IAU Symposium 185, New Eyes to See Inside the Sun and Stars, eds. F.-L. Deubner, J. Christensen-Dalsgaard, and D. Kurtz, p.301
- (2) Bailer-Jones C.A.L., 2000, A&A 357, 197 (astro-ph/0003071)
- (3) Bruzual G., Barbuy B., Ortolani S., Bica E., Cuisinier F., Lejeune T., Schiavon R.P., 1997, AJ1141531
- (4) Buser R., 1978, A&A 62, 411
- (5) Buser R., Kurucz R.L., 1992, A&A 264, 557
- (6) Carlberg R.G., Dawson P.C., Hsu T., Vandenberg D.A., 1985, ApJ294674
- (7) Catala C., Mangeney A., Gautier D., Auvergne M., Baglin A., Goupil M.J., Michel E., Zahn J.P., Magnan A., Vuillemin A., Boumier P., Gabriel A., Lemaire P., Turck-Chieze S., Dzitko H., Mosser B., Bonneau F., 1995, Astronomical Society of the Pacific Conf. Series, Vol. 76, p.426
- (8) Cayrel de Strobel G., Soubiran C., Friel E.D., Ralite N., Francois P., 1997, A&A Suppl. 124, 299
- (9) Cuisinier F., Buser R., Acker A., Cayrel R., Jasniewicz G., Fresneau A., 1994, A&A 285, 943
- (10) Cuisinier F., Lejeune T., Buser R., 1996, IAU Symposium 171, R. Bender and R.L. Davies (eds), p.355
- (11) Donati J.-F., Semel M., Carter B.D., Rees D.E., Cameron A.C., 1997, MNRAS291658
- (12) ESA, 1997, The Hipparcos and Tycho Catalogues (ESA-SP 1200)
- (13) Katz D., Soubiran C., Cayrel R., Adda M., Cautain R., 1998, A&A 338, 151
- (14) Künzli M., North P., Kurucz R.L., Nicolet B., 1997, A&A Suppl. 122, 51
- (15) Kupka F., Piskunov N., Ryabchikova T.A., Stempels H.C., Weiss W.W., 1999, A&A Suppl. 138, 119
- (16) Kurth O.M., Fritze-v. Alvensleben U., Fricke K.J., 1999, A&A Suppl. 138, 19
- (17) Kurucz R.L., 1993, CD-ROM 13, 14
- (18) Lastennet E., Lejeune T., Valls-Gabaud D., 1996, ASP Conf. Ser. Vol.90, 157
- (19) Lastennet E., Lejeune T., Westera P., Buser R., 1999a, A&A 341, 857
- (20) Lastennet E., Valls-Gabaud D., Lejeune T., Oblak E., 1999b, A&A 349, 485
- (21) Lejeune T., 1997, Ph.D. Thesis, Observatoire Astronomique de Strasbourg, France
- (22) Lejeune T., Cuisinier F., Buser R., 1997, A&A Suppl. 125, 229
- (23) Lejeune T., Cuisinier F., Buser R., 1998, A&A Suppl. 130, 65
- (24) Lejeune T., Westera P., Buser R., 2000, in preparation
- (25) Lignières F., Catala C., Katz D., Lastennet E., Lüftinger Th., van ’t Veer-Menneret C., Joint European and National Astronomical Meeting (JENAM 99), 7-11 Sept. 1999, Toulouse (France)
- (26) Maeder A., 1971, A&A 10, 354
- (27) Marsakov V.A., Shevelev Y.G., 1995, Bull. Inform. CDS 47,13 [MS95]
- (28) Michel E., Baglin A., et al., 1998, Structure and Dynamics of the Interior of the Sun and Sun-like Stars, SOHO 6/GONG 98 Workshop Abstract, June 1-4, 1998, Boston, Massachusetts
- (29) Moon T.T., 1985, Com. Univ. London Obs. 78, 1
- (30) Moon T.T., Dworetsky M.M., 1985, MNRAS217305
- (31) Napiwotzki R, Schönberner D., Wenske V., 1993, A&A 268, 653
- (32) North P., Künzli M., Nicolet B., 1994, 22nd GA of the IAU, the Hague
- (33) Perryman M.A.C., et al. 1997, A&A 323, L49
- (34) Piskunov N.E., 1992, in Stellar magnetism, Y.V. Glagolevskij, I.I. Romanyuk (eds.), Nauka, St. Petersburg, p.92
- (35) Sekiguchi M., Fukugita M., 2000, AJ1201072 (astro-ph/9904299)
- (36) van ’t Veer-Menneret C., Mégessier, 1996, A&A 309, 879
- (37) Vergely J.-L., 1998, Ph.D. Thesis, Observatoire Astronomique de Strasbourg, France
- (38) Weiss A., Salaris M., 1999, A&A 346, 897
- (39) Welsh B.Y., Vedder P.W., Vallerga J.V., Craig N., 1991, ApJ381462
- (40) Westera P., Lejeune T., Buser R., 1999, ASP Conf. Series, Hubeny I., Heap S.R. and Cornett R.H (eds.), Vol. 192, p.203 (astro-ph/9906064)
- (41) Zakhozhaj V.A., Shaparenko E.F., 1996, Kinematika Fiz., Nebesn. Tel., 12, part no 2, 20-29, [ZS96]
- (42) Zorec J., 1992, Hipparcos, Goutelas 1992, Benest D., Froeschlé C. eds., p.407