GRB 000301c with peculiar afterglow emission
R. Sagar1, V. Mohan1, S. B. Pandey1, A. K. Pandey1, C. S. Stalin1 and A. J. Castro-Tirado2
1U. P. State Observatory, Manora Peak, Nainital – 263 129, India
2IAA-CSIC, P.O. Box 03004, E-18080, Granada, Spain
Abstract
The CCD magnitudes in Johnson and Cousins and photometric passbands are determined for GRB 000301C afterglow starting 1.5 day after the ray burst. In fact we provide the earliest optical observations for this burst. Light curves of the afterglow emissions in and passbands are obtained by combining the present measurements with the published data. Flux decay shows a very uncommon variation relative to other well observed GRBs. Overall, there is a steepening of the optical and near-infrared flux decay caused by a geometric and sideways expanding jet. This is superimposed by a short term variability especially during early time ( days). The cause of variability is not well understood, though it has occurred simultaneously with similar amplitude in all the filters. After removing the superposed flux due to variability, we derive the early and late time flux decay constants using jet model. The late time flux decay is the steepest amongst the GRB OTs observed so far with . Steepening in the flux decay seems to have started simultaneously around day in all passbands. On the other hand no such variations are observed in the quasi-simultaneous broad-band photometric spectral energy distributions of the afterglow. The value of spectral index in the optical-near IR region is . Redshift determination with indicates cosmological origin of the GRB having a luminosity distance of 16.6 Gpc. Thus it becomes the second farthest amongst the GRBs with known distances. An indirect estimate of the fluence 20 keV indicates, if isotropic, ergs of release of energy. The enormous amount of released energy will be reduced, if the radiation is beamed which is the case for this event. Using a jet break time of 7.6 days, we infer a jet opening angle of 0.15 radian. This means the energy released is reduced by a factor of 90 relative to the isotropic value.
Keywords: Photometry – GRB afterglow – flux decay – spectral index
1 Introduction
Gamma-ray bursts (GRBs) are short and intense flashes of cosmic high energy ( 10 KeV10 GeV) photons. The study of GRBs was revolutionized in 1997 when the Italian-Dutch ray satellite BeppoSAX started providing positions of some GRBs with an accuracy of a few arcminutes within a few hours after the burst. This made the multi-wavelength observations of the long-lived emission, known as afterglow of GRB, at longer wavelengths as a routine. Such observations are of crucial importance for understanding and constraining the active emission mechanisms of GRBs as well as for the study of the nature, structure and composition of surroundings. For this, early light curves of GRB afterglows need to be densely sampled for long time intervals. A huge amount of observing time is therefore required on optical telescopes. Since the optical transient (OT) of a GRB has generally apparent magnitude between 18 to 22, if it is detected within a day or so after the burst, the 1-m class optical telescopes equipped with modern CCD detector are capable of observing them. Such telescopes are not only large in number throughout the world but also less in demand compared to 2-m class or larger size optical telescopes. The large amount of observing time is therefore available on them (cf. Sagar 2000 for detailed discussions). The 1-m class optical telescopes equipped with CCD detector, thus, can contribute to the world-class science in an emerging front-line research area of GRB. We at U.P. State Observatory (UPSO), Nainital, therefore, started the optical follow-up observations of the GRB afterglows in January 1999 under an international collaborative programme coordinated by one of us (AJCT). So far, successful photometric observations have been carried out for 4 GRB afterglows from UPSO, Nainital. The UPSO photometric observations for earlier 3 events namely GRB 990123, GRB 991208 and GRB 991216 have been presented by Sagar et al. (1999, 2000). Such observations for the GRB000301C are presented here. It is worth mentioning here that first earliest optical observations of GRB 000301C have been carried out by us. An introduction to the GRB 000301C studied here is given below.
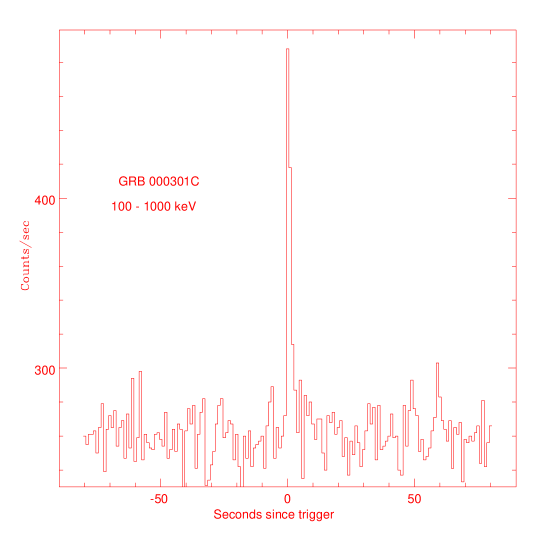
Smith et al. (2000) reported All Sky Monitor (ASM) on the Rossi ray Timing Explorer (RXTE), Ulysses and Near Earth Asteroid Rendezvous (NEAR) detection of a GRB on 2000 March 01 at 09:51:37 UT. GRB 000301C therefore joins the group of GRB 991208 (see Hurley et al. 2000) whose positions were determined only by the Interplanetary Network Localization alone without Compton Gamma-Ray observatory BATSE or BeppoSAX observations within 1.5 day of the event. The positions were of such accuracy (50 arcmin2 in this case) that it led to the successful identification of radio, millimeter, optical and near-IR afterglows, and eventually to the measurement of its redshift. Fig. 1 shows the light curve of the prompt ray emissions of the GRB 000301C detected by NEAR in the energy band 100 – 1000 KeV downloaded from the http://lheawww.gsfc.nasa.gov/. The burst profile is dominated by only one strong peak with no spike type structures generally observed with GRB events. The three ASM energy channels showed the strongest response in the 5 – 12 KeV band, reaching a peak flux of 3.70.7 Crab in 1 s time bin. Jensen et al. (2000) derived a peak flux of 6.3 erg cm-2 in 0.25 s time bin in the 25 – 100 KeV energy range and the hardness ratio for the burst. It has a sharp rise and a relatively slow decline. Duration (full width at half maximum) of the profile at trigger of the burst is only 2 s. The detection of the GRB 000301C OT was reported first by Fynbo et al. (2000a) in and passbands at with an uncertainty of . It was confirmed by Bernabei et al. (2000) on a image and by Stecklum et al. (2000) on a (2.1 m) image. Coincident at the optical position, Bertoldi (2000) detected a flux of 1.90.3 mJy at 250 GHz (1.2 mm) on 2000 March 4.385 UT while Berger & Frail (2000) detected a flux of 300 Jy at 8.46 GHz on 2000 March 5.67 UT. No obvious emission or absorption features are visible in the low resolution spectrum of the OT of GRB 000301C taken on 2000 March 4.41 UT in the wavelength range of 410 – 800 nm by Eracleous et al. (2000). An ultra-violet spectrum of the OT taken on 2000 March 6 with the Hubble Space Telescope (HST) by Smette et al. (2000) indicates a redshift of . It was precisely determined to a value of by Castro et al. (2000) using a moderately high resolution spectra taken with the Keck-II 10-m telescope on 2000 March 4. This determination was also supported by the low resolution spectrum obtained by Feng et al. (2000) on 2000 March 3.47 UT. The value is not too different from 2.04040.0008 determined by Jensen et al. (2000) using absorption features in the spectrum obtained with very large telescope on 2000 March 5 and 6. Rhoads & Fruchter (2000), Masetti et al. (2000) and Jensen et al. (2000) present the near-infrared (IR) and and observations while Berger et al. (2000) provide broad-band (1.4 to 350 GHz) radio and millimeter wave observations. These data indicate that short term achromatic flux variability is superposed on the overall steepening of the light curve. The cause of the short term variability is not understood. However, it makes difficult the determination of break-time while fitting jet model in the light curve of the afterglow emission. Therefore, time scales determined in the published studies range from days. Present observations in combination with data published in the literature are used to study flux decay at optical and near-IR wavelengths and spectral index from ultra-violet to radio regions. These data have been used to determine precise parameters of the light curve. Details of present optical observations etc. are given in the next section while light curves and other results are presented in the remaining sections.
2 Optical observations, data reduction and calibrations
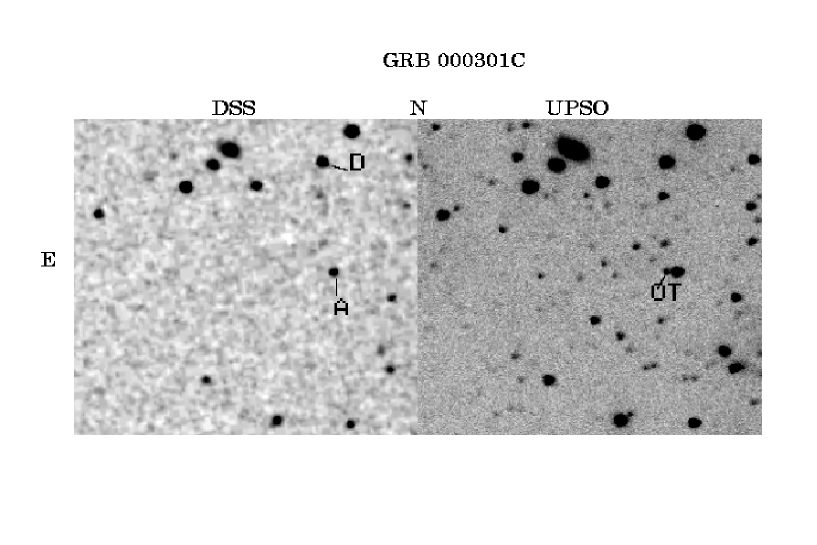
The optical observations of the GRB 000301C afterglow were carried out from 2000 March 2 to 9. We used a 2048 2048 pixel2 CCD system attached at the f/13 Cassegrain focus of the 104-cm Sampurnanand telescope of UPSO, Nainital. All the observations were done in good photometric sky condition, expect for 2000 March 6. One pixel of the CCD chip corresponds to 0.38, and the entire chip covers a field of on the sky. Fig. 2 shows the location of the GRB 000301C afterglow on the CCD image taken from UPSO, Nainital. For comparison, image extracted from the Digital Palomar Observatory Sky Survey (DSS) is also shown where the absence of a GRB OT is clearly seen.
Several short exposures up to a maximum of 15 minutes were generally given. In order to improve the signal-to-noise ratio of the OT, the data have been binned in pixel2 and also all images of a night have been stacked after correcting them for bias, non-uniformity in the pixels and cosmic ray events. Exposure times for the stacked images were 70, 50, 85, 35, 105 and 75 minutes in on 2000 March 2, 3, 5, 6, 7 and 8 respectively. Only one image in each and filters could be taken on 2000 March 3 with corresponding exposure times of 30 and 10 minutes respectively. As the OT is close to a bright star, DAOPHOT profile-fitting technique is used for the magnitude determination. In the field of GRB 000301C, stars (as identified in Fig. 2) are photometrically calibrated in passband by Garnavich et al. (2000a). The quoted uncertainty in the zero-point calibration is 0.05 mag. Henden (2000) provides the photometry for stars fainter than 20 mag in the GRB 000301C field. The magnitudes determined by Garnavich et al. (2000a) agree with an independent measurement reported by Henden (2000). This indicates that photometric calibration used in this work is secure. Present photometric magnitudes are relative to comparison star A and D (see Fig. 2). These along with other photometric measurements of GRB 000301C afterglow published by the time of paper submission are given in Table 1. In order to avoid errors arising due to different photometric calibrations, we have used only those published photometric measurements whose magnitudes could be determined relative to determinations given by either Garnavich et al. (2000a) or Henden (2000). In filters, all published photometric measurements have been used.
Present images have also been independently processed, reduced and calibrated by Masetti et al. (2000). A comparison of their values with ours indicates good agreement. A small difference observed between the two sets of values is, perhaps, due to different data processing and calibration procedures.
Table 1. Photometric magnitues of the GRB 000301C afterglow.
| Time in UT | Passband | Magnitude | Source |
|---|---|---|---|
| Mar 00 02.96 | B | 20.990.20 | Bhargavi & Cowsik (2000) |
| Mar 00 03.18 | B | 21.070.05 | Masetti et al. (2000) |
| Mar 00 03.23 | B | 21.100.12 | Masetti et al. (2000) |
| Mar 00 03.50 | B | 21.110.04 | Veillet (2000a) |
| Mar 00 04.52 | B | 21.410.04 | Halpern et al. (2000c) |
| Mar 00 04.91 | B | 21.310.14 | Bhargavi & Cowsik (2000) |
| Mar 00 05.15 | B | 21.600.20 | Masetti et al. (2000) |
| Mar 00 06.16 | B | 22.450.15 | Masetti et al. (2000) |
| Mar 00 07.15 | B | 22.430.15 | Masetti et al. (2000) |
| Mar 00 14.60 | B | 24.830.12 | Veillet (2000d) |
| Mar 00 03.22 | V | 20.570.05 | Masetti et al. (2000) |
| Mar 00 03.89 | V | 20.950.06 | Present work |
| Mar 00 04.11 | V | 21.100.06 | Gal-Yam et al. (2000) |
| Mar 00 05.17 | V | 21.040.20 | Masetti et al. (2000) |
| Mar 00 06.22 | V | 21.900.15 | Fruchter et al. (2000a) |
| Mar 00 02.93 | R | 20.420.06 | Present work |
| Mar 00 02.96 | R | 20.020.03 | Bhargavi & Cowsik (2000) |
| Mar 00 03.14 | R | 20.250.05 | Masetti et al. (2000) |
| Mar 00 03.17 | R | 19.940.05 | Fynbo et al. (2000b) |
| Mar 00 03.19 | R | 20.160.05 | Masetti et al. (2000) |
| Mar 00 03.21 | R | 20.250.05 | Masetti et al. (2000) |
| Mar 00 03.51 | R | 20.240.05 | Halpern et al. (2000a) |
| Mar 00 03.51 | R | 20.270.04 | Veillet (2000a) |
| Mar 00 03.51 | R | 20.280.05 | Garnavich et al. (2000a) |
| Mar 00 03.93 | R | 20.530.06 | Present work |
| Mar 00 04.00 | R | 20.490.10 | Bhargavi & Cowsik (2000) |
| Mar 00 04.04 | R | 20.530.06 | Masetti et al. (2000) |
| Mar 00 04.08 | R | 20.570.06 | Gal-Yam et al. (2000) |
| Mar 00 04.38 | R | 20.560.05 | Garnavich et al. (2000b) |
| Mar 00 04.46 | R | 20.540.06 | Mujica et al. (2000) |
| Mar 00 04.50 | R | 20.610.04 | Halpern et al. (2000b) |
| Mar 00 04.91 | R | 20.580.05 | Bhargavi & Cowsik (2000) |
| Mar 00 05.14 | R | 20.470.07 | Masetti et al. (2000) |
| Mar 00 05.63 | R | 20.860.04 | Veillet (2000a) |
| Mar 00 05.96 | R | 21.180.07 | Present work |
| Mar 00 06.14 | R | 21.650.20 | Masetti et al. (2000) |
| Mar 00 06.22 | R | 21.500.15 | Fruchter et al. (2000a) |
| Mar 00 06.98 | R | Present work | |
| Mar 00 07.13 | R | 21.630.15 | Masetti et al. (2000) |
| Mar 00 07.65 | R | 21.700.07 | Veillet (2000b) |
| Mar 00 07.93 | R | 21.950.10 | Present work |
| Mar 00 08.15 | R | 21.680.10 | Masetti et al. (2000) |
| Mar 00 08.95 | R | 22.130.10 | Present work |
| Mar 00 09.52 | R | 22.280.09 | Halpern & Kemp (2000) |
| Mar 00 11.63 | R | 23.020.10 | Veillet (2000c) |
| Mar 00 14.60 | R | 23.820.10 | Veillet (2000d) |
| Apr 00 03.90 | R | 26.900.15 | Fruchter et al. (2000b) |
| Mar 00 03.21 | I | 19.940.07 | Masetti et al. (2000) |
| Mar 00 03.96 | I | 19.940.15 | Present work |
| Mar 00 06.19 | I | 20.820.15 | Masetti et al. (2000) |
| Mar 00 07.18 | I | 21.200.15 | Masetti et al. (2000) |
| Mar 00 08.17 | I | 21.610.10 | Masetti et al. (2000) |
| Mar 00 03.55 | J | 18.880.02 | Kobayashi et al. (2000) |
| Mar 00 04.65 | J | 19.060.05 | Rhoads & Fruchter (2000) |
| Mar 00 03.22 | K | 17.510.06 | Rhoads & Fruchter (2000) |
| Mar 00 03.56 | K | 17.520.02 | Kobayashi et al. (2000) |
| Mar 00 04.64 | K | 17.650.04 | Rhoads & Fruchter (2000) |
| Mar 00 05.61 | K | 18.000.07 | Rhoads & Fruchter (2000) |
| Mar 00 06.60 | K | 18.560.12 | Rhoads & Fruchter (2000) |
| Mar 00 08.59 | K | 19.280.09 | Rhoads & Fruchter (2000) |
3 Optical and near-IR photometric light curves
We have used the published data in combination with the present measurements to study the flux decay of GRB 000301C afterglow. Fig. 3 shows the plot of photometric measurements as a function of time. The X-axis is log () where is the time of observation and is the time of GRB burst which is 2000 March 1.411 UT. All times are measured in unit of day. Before deriving the flux decay constants of the OT, it is mandatory to subtract the contributions from foreground/background galaxies, if there is any. Both ground based and the early HST images clearly show that any underlying galaxy would have to be fainter than 25 mag (Fruchter et al. 2000a). In fact, the late-time HST images taken on 2000 April 3.9 UT by Fruchter et al. (2000b) showed that the magnitude of the host galaxy is 27.80.25. We have therefore not applied any correction upto 23 mag of the OT for the contamination by host galaxy.
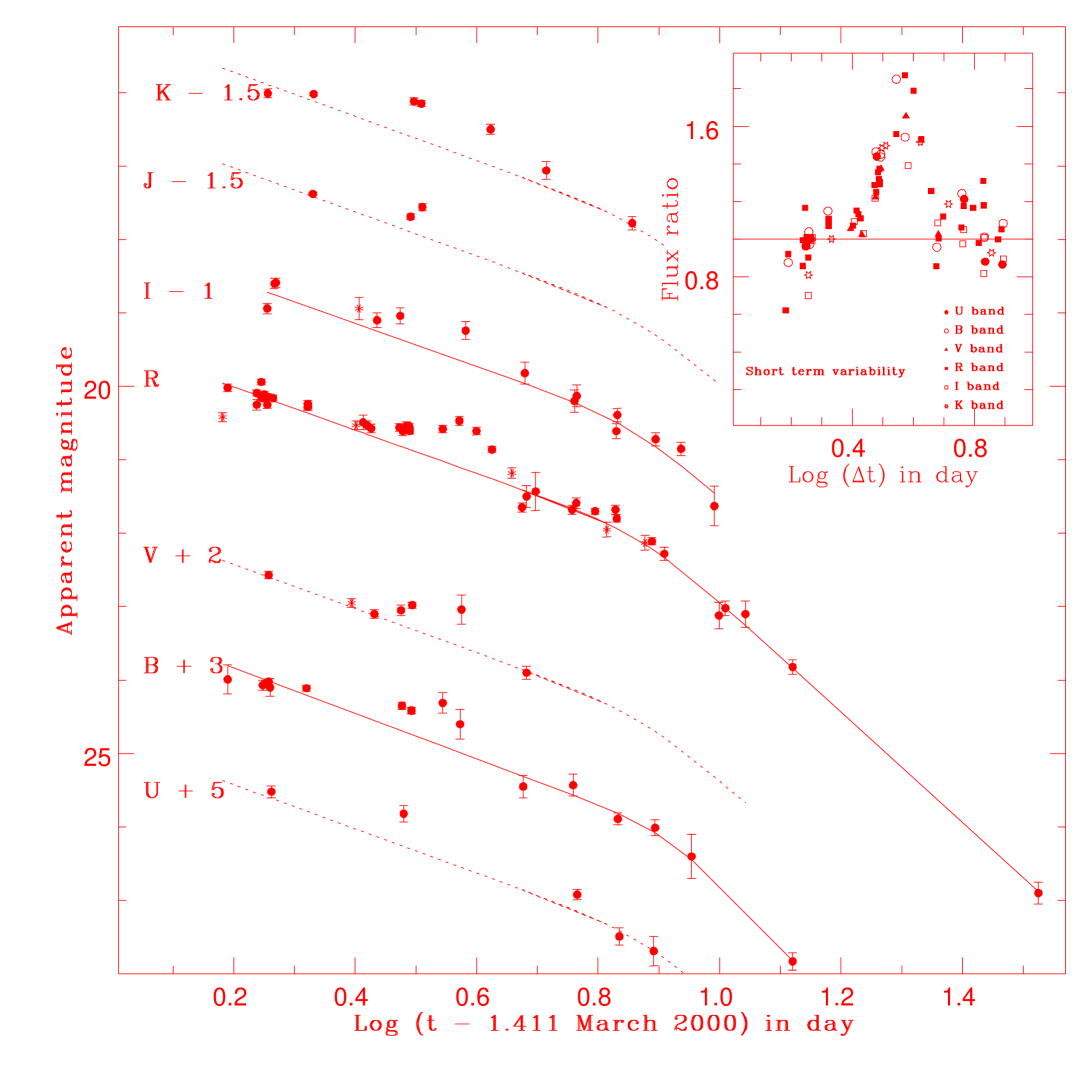
The flux decay of most of the earlier GRB afterglows is generally well characterized by a single power law , where is the flux of the afterglow at time and is the decay constant. However, optical and near-IR light curves of GRB 000301C (Fig. 3) show erratic behaviour with an overall flux decay. Observers therefore took relatively long time to accept it as an OT of the GRB 000301C.
UPSO observation in filter on 2000 March 2.93 UT is the earliest optical observations published so far. Bhargavi & Cowsik (2000) measurements are just after us. Fig. 3 clearly indicates peculiar behaviour of the light curve and perhaps, even shows 0.5 mag brightening of the magnitude with during day. This could be an indication of a rising phase similar to that seen in GRB 970228 (Guarnieri et al. 1997) and GRB 970508 (Castro-Tirado et al. 1998). Contrary to most of the earlier GRB afterglows, light curve of GRB 000301C can not be fitted by a single power-law (see also Masetti et al. 2000, Rhoads & Fruchter 2000, Berger et al. 2000; Jensen et al. 2000). Overall the OT flux decay seems to have broken power-law as expected in GRB afterglows having jet-like relativistic ejecta (Sari et al. 1999; Rhoads 1999). This appears to be superimposed with some shorter time flux variability especially during day. Among equally well monitored GRB afterglows, GRB 000301C appears therefore peculiar. Correlated variability can be clearly noticed in and passbands. The lack of such apparent correlation in the light curves of other passbands is most probably due to non-strict simultaneity of the data points. Broken power-law in these light curves can be empirically fitted by functions of the form (see Rhoads & Fruchter 2000)
,
where and are asymptotic power-law slopes at early and late times with and . controls the sharpness of the break, with larger implying a sharper break. With , this function becomes the same that Stanek et al. (1999) fit the optical light curve of GRB 990510 afterglow. is the flux at the cross-over time . The function describes a light curve falling as at and at . The function can be written in magnitudes as
,
where is the magnitude at time . In jet models, an achromatic break in the light curve is expected when the jet makes the transition to sideways expansion after the relativistic Lorentz factor drops below the inverse of the opening angle of the initial beam. Slightly later, the jet begins a lateral expansion which causes a further steepening of the light curve. Before fitting jet model to the light curve to derive accurate flux decay parameters of the afterglow, it is mandatory to deconvolve the short term variability component. Otherwise, it will confuse the determination of . Perhaps it is the main reason for having a range of values in the literature. The short term variability component of the light curve is determined as described below.
In order to minimize the effects of short term variability on the determination of the parameters of the fireball model, Berger et al. (2000) fitted the entire data set from radio to optical simultaneously and derive days, for and for as global parameters for the jet fireball model. The observed and fluxes are divided by the values obtained from the jet model fit yields, as also is noticed by Berger et al. (2000) that the variability is simultaneous and of similar amplitude in all bands (see upper right corner box in Fig. 3). There is a sharp rise and decline centered on day. Berger et al. (2000) also found similar variability at 250 GHz. All these indicate that variability is the result of a real physical process which produces simultaneously similar level of absolute variation over a large range in frequency. Berger et al. (2000) therefore explain this fluctuation in terms of non-uniform ambient density which varied by about a factor of 3.
We use the densely covered observations in , and to determine the parameters of jet model using the above function. For this, the short term variability was deconvolved from the observed light curves. It has been noticed that the minimum value of is achieved for . This indicates that the observed break in the light curve is sharp and is unlike the smooth break observed in the optical light curve of GRB 990510 (cf. Stanek et al. 1999; Harrison et al. 1999). In order to avoid a fairly wide range of model parameters for a comparable due to degeneracy between and , we have used fixed value of in our further analyses. The least square best fitted parameters and have values 7.510.63, 22.150.15, 1.180.14 and 3.010.53 respectively in . The corresponding values are 8.271.11, 23.200.24, 1.240.20 and 3.482.07 respectively in and 7.271.04, 21.640.26, 1.170.29 and 2.922.93 respectively in . This indicates that average values of and are 7.60.5 day, and respectively. The light curves derived with these averaged parameters using the jet model are shown by dotted curves in the and passbands. This clearly indicates the presence of simultaneous short term variability in all passbands. We therefore conclude in agreement with Masetti et al. (2000) and Rhoads & Fruchter (2000) that optical and near-IR flux decays of GRB 000301C afterglow are peculiar in comparison to other such well observed GRB afterglows.
3.1 Spectral index of the GRB 000301C afterglow
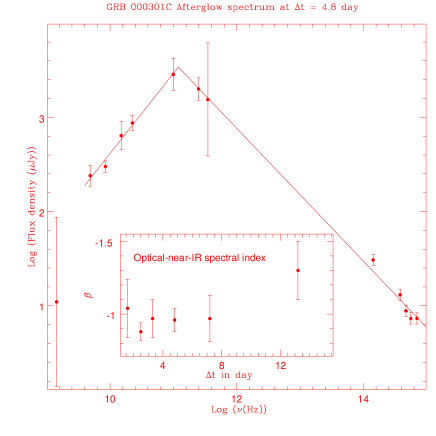
The flux distribution of the GRB 000301C afterglow has been studied using the broadband photometric measurements listed in Table 1 along with the published radio, millimeter and ultra-violet observations. We used the reddening map provided by Schlegel, Finkbeiner & Davis (1998) for estimating Galactic interstellar extinction towards the burst and found a small value of mag. We used the standard Galactic extinction reddening curve given by Mathis (1990) in converting apparent magnitudes into fluxes and used the effective wavelengths and normalisations by Bessell (1979) for and and by Bessell & Brett (1988) for and . The fluxes thus derived are accurate to 10%. Fig. 4 shows the spectrum of GRB 000301C afterglow from optical to radio region. The fluxes closest to day at 1.4 GHz, 4.86 GHz, 8.46 GHz, 15 GHz, 22.5 GHz, 100 GHz, 250 GHz and 350 GHz are taken from Berger et al. (2000). It is observed that as the frequency decreases the flux increases from optical to millimeter wavelengths and then it turns over. The spectrum thus can be described by a single power law in some frequency interval as , where is the flux at frequency and is the spectral index. In the optical to millimeter region, the value of is 0.06 at 4.8 day. The optical-near-IR spectrum has not changed significantly (see Table 2 and Fig. 4) and has average value around . This is in agreement with a single value of derived from the low-resolution spectrum taken on 2000 March 3.47 UT by Feng et al. (2000) in the wavelength range of 0.3 to 0.6 m. The HST observations taken around = 33.5 day by Fruchter et al. (2000b) also indicate similar slope. All these, perhaps, indicate no change in the spectral slope of GRB 000301C at later times. There is thus no evidence for a cooling break passing through the optical band on these time scales. This is unlike GRB 980326 ( Bloom et al. 1999) and GRB 970228 (Fruchter et al. 1999; Galama et al. 2000) where spectral index changed to a value of after 20 days. The spectral slope at radio to millimeter frequencies is generally expected to be at these early times. However, the observed slope is much larger with a value of . The peak frequency seems to lie in millimeter region. This peak frequency is thus similar to that of GRB 970508 (cf. Galama et al. 1998) but different from that of GRB 990123 (Galama et al. 1999) where the peak is in radio region and that of GRB 971214 for which the peak is in optical/near-infrared waveband (Ramaprakash et al. 1998). From this, one may infer that the synchrotron peak frequency may span a large range in GRB afterglows.
4 Comparison with the synchrotron emisson model
It is generally believed that the observed afterglow results from slowing down of a relativistic shell on the external ISM and therefore is produced by external shocks. Recent afterglow observations of GRBs show that a relativistic blast wave, in which the highly relativistic electrons radiate via synchrotron mechanism, provides a generally good description of the observed properties. Here we will discuss briefly the implications of the observed flux decay exponent and the spectral slope index in different wavelength range for such models. All models have the flux as for a range of frequencies and times that contain no spectral breaks. In each model and are functions of only, the power-law exponent of the electron Lorentz factor. The measurement of either one of or therefore fixes and predicts the other one.
In order to study the expected changes in the spectral indices with , we derive the value of in optical to near-IR region at different epochs. They are plotted inside a box in Fig. 4 and listed in Table 2. Where necessary, flux measurements were interpolated between adjacent data points at one wavelength in order to determine a contemporaneous flux with another wavelength using the measurements listed in Table 1. There is no evidence for statistically significant large () variation in the spectral index on these time scales.
Table 2. Spectral slopes of GRB 000301C afterglow at selected epochs, in optical-near-IR region. Filters used in deriving the value of are listed. The values of and predicted for spherical model are also listed.
| Epoch | Filters | Observed | Predicted | |
|---|---|---|---|---|
| ( in days) | ||||
| 1.6 | B, R | 0.20 | 1.560.30 | 3.080.40 |
| 2.5 | B, V, R, I, J, K | 0.06 | 1.320.09 | 2.760.12 |
| 3.3 | B, V, R,I, J, K | 0.13 | 1.460.20 | 2.940.26 |
| 4.8 | B, V, R, I, K | 0.08 | 1.440.12 | 2.920.16 |
| 7.2 | B, R, K | 0.14 | 1.480.21 | 2.940.28 |
| 13.2 | B, R | 0.20 | 1.950.30 | 3.600.40 |
For comparison with model predictions, we assume that our observations are in the slow cooling regime and the has passed optical but not the cooling frequency, which most probably lies above optical region. Following Sari et al. (1999), values of and are predicted using observed value of for the spherical model of the afterglow. They are listed in Table 2. The observed flux decay constant at early times agrees well with the predicted ones given in Table 2 while exactly opposite is the case at late times for spherical afterglow emission. But the value of flux decay constant is expected to approach the electron energy distribution index , when the evolution of the afterglow is dominated by the spreading of the jet. On the other hand, the value of is the same for both spherical and jet models. Since the observed values of for late times agree with the predicted values of and hence to the values of in jet model, we conclude that afterglow emission from GRB 000301C is of jet type and not spherical.
5 The energetics of the GRB 000301C
Redshift determination of (Castro et al. 2000) for the GRB 000301C afterglow yields a minimum luminosity distances of 16.6 Gpc for a standard Friedmann cosmological model with Hubble constant = 65 km/s/Mpc, cosmological density parameter = 0.2 and cosmological constant = 0 (if then the inferred distances would increase). The GRB 000301C thus becomes the second farthest GRB after GRB 971214 (Kulkarni et al. 1998) amongst the GRBs with known redshift measurements so far.
As there is no published observed fluence in any energy range for this GRB, we estimate it indirectly assuming that present GRB event may also have the ratio between optical flux density and gamma-ray energy fluence similar to those observed so far which is (see Table 3 in Briggs et al. 1999). Taking mag at 1 day, this ratio yields an energy fluence of at least ergs/cm2 above 20 KeV. Considering isotropic energy emission and this observed fluence and using the inferred luminosity distances, we estimate the ray energy release to be at least ergs for this GRB. Considering the different fluence energy ranges used, this is not too different from the values ergs and ergs derived by Breger et al. (2000) and Jensen et al. (2000) respectively. Theoretical models predict that brightness of the prompt optical flash can be as bright as 9 – 10 mag (Sari & Piran 1999); as was observed in the case of the GRB 990123, the only prompt optical emission detected so far. At the optical distance of GRB 000301C, this implies a peak optical luminosity of times the solar luminosity, if the prompt optical emission is of similar order. This is about a million times the luminosity of a normal galaxy and about a thousand times the luminosity of the brightest quasars known. The present energy and estimates imply a jet opening angle of radian, where is the number density (in units of cm-3) of the ambient medium. This means that the actual energy released from the GRB 000301C is reduced by a factor of relative to the isotropic value and becomes ergs.
Of the over dozen GRBs with known redshifts, six with total fluence energies 20 keV in excess of 1053 erg (assuming isotropic emission) are GRB 000301C (discussed here); GRB 991216 and GRB 991208 (Sagar et al. 2000); GRB 990510 (Harrison et al. 1999); GRB 990123 (Andersen et al. 1999; Galama et al. 1999) and GRB 971214 (Kulkarni et al. 1998). Recent observations suggest that GRBs are associated with stellar deaths, and not with quasars or the nuclei of galaxies as some GRBs are found off-set from their host galaxy. However, release of huge amount of isotropic energy of erg or more is essentially incompatible with the popular stellar death models (coalescence of neutron stars and death of massive stars). Recent observations seem to indicate non-isotropic emission as the most plausible way to reduce the enormous energy release. Indeed, almost all energetic sources in astrophysics such as pulsars, quasars and accreting stellar black holes display jet-like geometry and hence, non-isotropic emission. Beaming reduces the estimated energy by a factor of 10 - 300, depending upon the size of its opening angle (Sari et al. 1999). The ray energy released then becomes erg, a value within reach of current popular models for the origin of GRBs (see Piran 1999 and references therein).
6 Discussions and Conclusions
Prompt ray emission light curve of the GRB 000301C burst shows, unlike most of the GRB events, only one strong peak with a flux of 3.70.7 Crab in the 5 – 12 KeV energy range. Using optical and near-IR observations, we obtained the values of flux decay constants and spectral indices. Light curves of the GRB 000301C afterglow emissions are peculiar. The light curves show a steepening superposed by a short term flare type variability which could be detected mainly due to the dense observations in filter. A large fraction of these observations have been carried out using the 1-m class optical telescopes. This indicates that in future these telescopes, as large amount of observing time is available on them, will play an important role in understanding the origin of such short term variability in the light curves of GRBs during early times. The overall flux decay in observed light curves are well understood in terms of a jet model. The parameters of the jet model are derived by fitting least square non-linear fit to the light curves obtained after deconvolving the short term variability from the observed light curves. The flux decay constants at early and late times are 1.20.1 and 3.00.5 respectively. The value of jet break time is 7.60.5 day. Before deriving any further conclusions from the light curve of GRB 000301C afterglow, we compare it with other well studied GRBs. Except GRB 990123, GRB 990510 and GRB 991216, all exhibit, at both early and late times a single power-law decay, generally 1.2, a value reasonable for spherical expansion in the fireball synchrotron model. GRB 000301C thus becomes the fourth burst for which a strong break in the light curve is clearly observed. Such breaks were observed first in the optical light curves of the afterglow of GRB 990123 (Castro-Tirado et al. 1999; Kulkarni et al. 1999) and recently in that of GRB 990510 (Harrison et al. 1999, Stanek et al. 1999) and GRB 991216 (Halpern et al. 2000, Sagar et al. 2000). They have generally been considered as evidence for collimation of the jet-like relativistic GRB ejecta in accordance with the prediction by recent theoretical models (Mészáros & Rees 1999; Rhoads 1999; Sari et al. 1999).
The quasi-simultaneous spectral energy distributions determined in optical and near-IR regions for various epochs indicate that spectral index of the GRB 000301C afterglow has not changed significantly during a period of about 35 days after the burst. The value of is . However, the early time flux decay constant has varied from 1.20.1 to 3.00.5. A steepening of flux decay constant with no corresponding change in spectral index is attributed to the presence of a jet in the GRB 000301C OT. The jet breaks around 7.6 days after the burst.
Redshift determination yields a minimum distance of 16.6 Gpc, if one assumes standard Friedmann cosmology with km/s/Mpc, and . GRB 000301C is thus at cosmological distance and becomes the second farthest amongst the GRBs with known distances so far. Considering isotropic energy emission, we estimate enormous amount of the ray energy release ( erg) above 20 KeV. This high energy is reduced to erg when effects of non-isotropic emission are considered due to the presence of a jet of an opening angle of 0.15 radian in the GRB 000301C.
The peculiarity in the light curves of GRB 000301C seems to be due to superposition of a short term achromatic variability over a large frequency range on the overall steepening in the flux of the GRB 000301C. In separating the two components of the observed light curves, dense as well as multi-wavelength observations during early times have played major role. Such observations of recent GRBs have started revealing features which require explanations other than generally accepted so far indicating that there may be yet new surprises in GRB afterglows.
Acknowledgements: Suggestions/comments given by anonymous referee improved the scientific content of the paper significantly. This research has made use of data obtained through the High Energy Astrophysics Science Archive Research Center Online Service, provided by the NASA/Goddard Space Flight Center.
References:
-
Andersen M. I. et al., 1999, Science, 283, 2075
-
Bernabei S. et al., 2000, GCN Observational Report No. 571
-
Bertoldi F., 2000, GCN Observational Report 580
-
Bessell M.S., 1979, PASP, 91, 589
-
Bessell M.S., Brett J.M., 1988, PASP, 100, 1134
-
Bhargavi S.G., Cowsik, R., 2000, GCN Observational Report No. 630
-
Bloom J.S. et al., 1999, Nature, 401, 453
-
Berger E., Frail, D.A., 2000, GCN Observational Report No. 589
-
Berger E. et al., 2000, Astro-ph/0005465
-
Briggs M.S. et al., 1999, ApJ, 524, 82
-
Castro S. M. et al., 2000, GCN Observational Report No. 605
-
Castro-Tirado A. J. et al., 1998, Science, 279, 1012
-
Castro-Tirado A. J. et al., 1999, Science, 283, 2069
-
Eracleous, M., Shetrone M., Sigurdsson S., Meszaros P., Wheeler J.C., Wang L., 2000, GCN Observational Report 584
-
Feng M. et al., 2000, GCN Observational Report No. 607
-
Fruchter A.S. et al., 1999, ApJ, 516, 683
-
Fruchter A.S. et al., 2000a, GCN Observational Report No. 602
-
Fruchter A.S. et al., 2000b, GCN Observational Report No. 627
-
Fynbo J.P.U., Jensen B.L., Hjorth J., Pedersen H., Gorosabel J., 2000a, GCN Observational Report No. 570
-
Fynbo J.P.U., Jensen B.L., Hjorth J., Pedersen H., Gorosabel J., 2000b, GCN Observational Report No. 576
-
Galama, T.J. et al., 1998, ApJ, 500, L97
-
Galama T.J. et al., 1999, Nature, 398, 394
-
Galama T.J. et al., 2000, ApJ Submitted
-
Gal-Yam A., Ofek E., Maoz D., Leibowitz, E.M., 2000, GCN Observational Report No. 593
-
Garnavich P., Barmby P., Jha S., Stanek K., 2000a, GCN Observational Report No. 573
-
Garnavich P., Barmby P., Jha S., Stanek K., 2000b, GCN Observational Report No. 581
-
Guarnieri et al., 1997, A&A, 328, L13
-
Halpern J.P., Mirabal N., Lawrence, S., 2000a, GCN Observational Report No. 578
-
Halpern J.P., Mirabal N., Lawrence, S., 2000b, GCN Observational Report No. 582
-
Halpern J.P., Mirabal N., Lawrence, S., 2000c, GCN Observational Report No. 585
-
Halpern J.P., Kemp J., 2000, GCN Observational Report No. 604
-
Halpern J.P. et al., 2000, ApJ Submitted
-
Harrison F.A. et al., 1999, ApJ, 523, L121
-
Henden A., 2000, GCN Observational Report 583
-
Hurley K., et al., 2000, ApJ Lett (accepted)
-
Jensen B.L. et al., 2000, A&A Submitted/astro-ph/0005609
-
Kobayashi N., Goto M., Terada H., Tokunaga A.T., 2000, GCN Observational Report No. 577
-
Kulkarni S.R. et al., 1998, Nature, 393, 35
-
Kulkarni S.R. et al., 1999, Nature, 398, 389
-
Masetti N. et al., 2000, A&A Submitted/astro-ph/0004186
-
Mathis J.S., 1990, ARAA, 28, 37
-
Mészáros P., Rees M. J., 1999, MNRAS, 306, L39
-
Mujica R., 2000, GCN Observational Report No. 597
-
Piran T., 1999, Physics Reports 314, 575
-
Ramaprakash, A.N. et al., 1998, Nature, 393, 43
-
Rhoads J.E., 1999, ApJ, 525, 737
-
Rhoads J.E., Fruchter A.S., 2000, ApJ Submitted/astro-ph/0004057
-
Sagar R., 2000, Current Science 78, 1076
-
Sagar R., Pandey A.K., Mohan V., Yadav R.K.S., Nilakshi, Bhattacharya D., Castro-Tirado A.J., 1999, BASI, 27, 3
-
Sagar R., Mohan V., Pandey A.K., Pandey S.B., Castro-Tirado A.J., 2000, BASI, 28, 15
-
Sari R., Piran T., 1999, ApJ, 517, L109
-
Sari R., Piran T., Halpern J. P., 1999, ApJ, 519, L17
-
Schlegel D.J., Finkbeiner D.P., Davis M., 1998, ApJ, 500, 525
-
Smette A. et al., 2000, GCN Observational Report No. 603
-
Smith D.A., Hurley K., Cline T., 2000, GCN observational Report No. 568
-
Stanek K. Z. et al., 1999, ApJ 522, L39
-
Stecklum B. et al., 2000, GCN Observational Report No. 572
-
Veillet C., 2000a, GCN Observational Report No. 588
-
Veillet C., 2000b, GCN Observational Report No. 598
-
Veillet C., 2000c, GCN Observational Report No. 610
-
Veillet C., 2000d, GCN Observational Report No. 611