DIRBE Minus 2MASS: Confirming the Cosmic Infrared Background at 2.2 Microns
Abstract
Stellar fluxes from the 2MASS catalog are used to remove the contribution due to Galactic stars from the intensity measured by DIRBE in four regions in the North and South Galactic polar caps. After subtracting the interplanetary and Galactic foregrounds, a consistent residual intensity of kJy sr-1 or nW m-2 sr-1 at 2.2 m is found. At 1.25 m the residuals show more scatter and are a much smaller fraction of the foreground, leading to a weak limit on the CIRB of kJy sr-1 or nW m-2 sr-1 (1 ).
1 Introduction
The Diffuse InfraRed Background Experiment (DIRBE) on the COsmic Background Explorer (COBE, see Boggess et al. (1992)) observed the entire sky in 10 infrared wavelengths from 1.25 to 240 m. Hauser et al. (1998) discuss the determination of the Cosmic InfraRed Background (CIRB) by removing foreground emission from the DIRBE data. This paper detected the CIRB at 140 and 240 m, but only gives upper limits at shorter wavelengths. From 5 to 100 m, the zodiacal light foreground due to thermal emission from interplanetary dust grains is so large that no reliable estimates of the CIRB can be made from a position 1 AU from the Sun (Kelsall et al., 1998). In the shorter wavelengths from 1.25 to 3.5 m, the zodiacal light is fainter, but uncertainties in modeling the foreground due to Galactic stars are too large to allow a determination of the CIRB (Arendt et al., 1998). Recently, Gorjian et al. (2000) removed the Galactic star foreground by directly measuring the stars in a box using ground-based telescopes and then subtracting the stellar contribution from the DIRBE intensity on a pixel-by-pixel basis. This field, a DIRBE dark spot, was selected using DIRBE data to have a minimal number of bright Galactic stars. In addition, Wright & Reese (2000) used a histogram fitting method to remove the stellar foreground from the DIRBE data in a less model-dependent way than that used by Arendt et al. (1998). Gorjian et al. (2000) and Wright & Reese (2000) obtained consistent estimates of the CIRB at 2.2 and 3.5 m. With the recent 2nd incremental release of 2MASS data, it is now possible to apply the direct subtraction method of Gorjian et al. (2000) to four additional DIRBE dark spots scattered around the North and South Galactic polar caps.
Kashlinsky & Odenwald (2000) have claimed a detection of the fluctuations of the CIRB. Kashlinsky & Odenwald (2000) also give the range 0.05 to 0.1 for the ratio of the fluctuations in the DIRBE beam to the mean intensity for the CIRB. But this ratio and fluctuation combine to give a range of CIRB values that is incompatible with the Hauser et al. (1998) upper limits on the CIRB, especially at 1.25 m. Furthermore, the claimed cosmic fluctuations are larger than the residuals in the DIRBE2MASS fits presented in §3. In this paper, Kashlinsky & Odenwald (2000) is treated as an upper limit on the CIRB which is compatible with previous limits and the results found here. Wright (2001) will discuss the possible cosmic fluctuation signal in the DIRBE2MASS residuals in more detail.
2 Data Sets
The two main datasets used in this paper are the DIRBE maps and the 2MASS point source catalog (PSC).
The DIRBE weekly maps were used: DIRBE_WKnn_P3B.FITS for . These data and the very strong no-zodi principle described by Wright (1997) were used to derive a model for the interplanetary dust foreground that is described in Wright (1998) and Gorjian et al. (2000). The zodiacal light model was then subtracted from each weekly map, and the remainders were averaged into mission averaged, zodiacal subtracted maps. At 1.25 and 2.2 m, no correction for interstellar dust emission is needed (Arendt et al., 1998). The pixels in these mission averaged, zodiacal subtracted maps provide the DIRBE data, .
DIRBE has a square beam with a diagonal of . Thus a thick buffer ring is needed around any studied field to keep bright stars outside the field from influencing the measured DIRBE intensity. One can minimize the resulting inefficiency by studying fields with a large area:perimeter ratio. Large circular regions have the largest area:perimeter ratio, and for circles as large as diameter it is still possible to find fields that have no stars brighter than the 2MASS saturation limit. To find such fields, a list of DIRBE dark spots was generated by smoothing the zodi-subtracted 3.5 m map with a kernel given by
| (1) |
where and are unit vectors. This kernel and all of its derivatives are continuous, and it vanishes identically for radii greater than . The FWHM is 3∘. The 20 faintest spots of the smoothed map in the Northern Galactic Hemisphere and the 20 faintest spots in the Southern Galactic Hemisphere were then located. The darkest spot is in the Northern Hemisphere and was studied by Gorjian et al. (2000) using ground-based data.
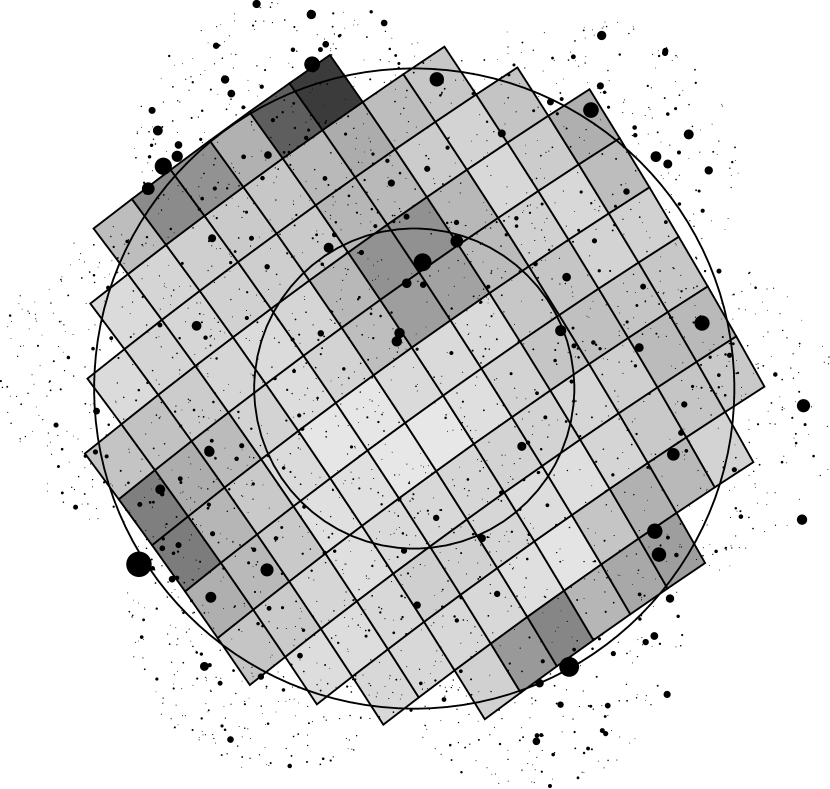
The 2MASS data were obtained over the WWW between 16 Mar 2000 and 23 Mar 2000. The IRSA interface was used to search the catalog. This allows a maximum search area of a 1∘ radius circle, which is too small for a comparison to the DIRBE data taken with a 0.7∘ beam. Therefore, a total of seven cone searches in a pattern consisting of a hexagon plus the central position were made around each DIRBE dark spot. These searches were restricted to stars brighter than . The seven resulting files were combined by stripping the table headers, concatenating, sorting, and then using the UNIX uniq filter. If there are no gaps in the 2MASS coverage near a dark spot, this yields a catalog that covers a 2∘ radius circle around the dark spot plus six small “ears.” Only stars within the circle were used in this analysis. However, there are usually gaps in the 2MASS coverage. Searching the 20 darkest spots in each of the Galactic polar caps produced only four usable fields out of 40 candidates. These are listed in Table 1. is the ecliptic latitude. The combined catalogs for each field were converted into star charts which were checked for missing 2MASS data. Two of these four fields have coverage gaps near the edge of the 2∘ radius circle, and thus have and a smaller but still useful number of pixels. Figure 1 shows the 2MASS catalog stars superimposed on the DIRBE map for the dark spot at .
3 Analysis
The DIRBE data for the pixel is , and should be the sum of the zodiacal light, ; the cataloged stars, ; the faint stars, ; and the CIRB, . The cataloged star contribution is found using the method of Gorjian et al. (2000) on all stars brighter than . In this method, the DIRBE beam center is assumed to be uniformly distributed within the area of the pixel, and the DIRBE beam orientation is assumed to be uniformly distributed in position angle. Under these assumptions, the probability that the star contributes to the signal in the pixel is , and the cataloged star contribution is
| (2) |
where is the flux of the star and is the solid angle of the DIRBE beam.111Gorjian et al. (2000) used instead of in Equation 2: this is appropriate for ’s normalized to the total flux as in Table 5 of Wright & Reese (2000), but for ’s normalized to a peak of unity as in Figure 2 the beam solid angle must be used for the normalization of Equation 2. Figure 2 shows the probability for stars located in the center, near an edge, or near a corner of a pixel located near the center, an edge, or a corner of a cube face in the quadrilateralized spherical cube pixel scheme. The standard deviation of the bright star contribution is given by
| (3) |
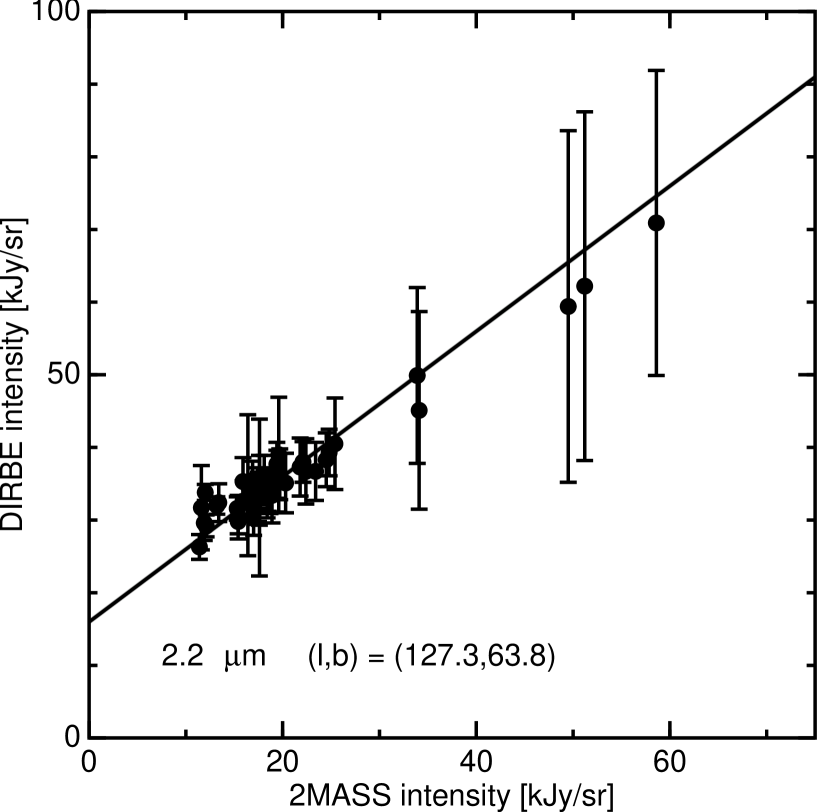
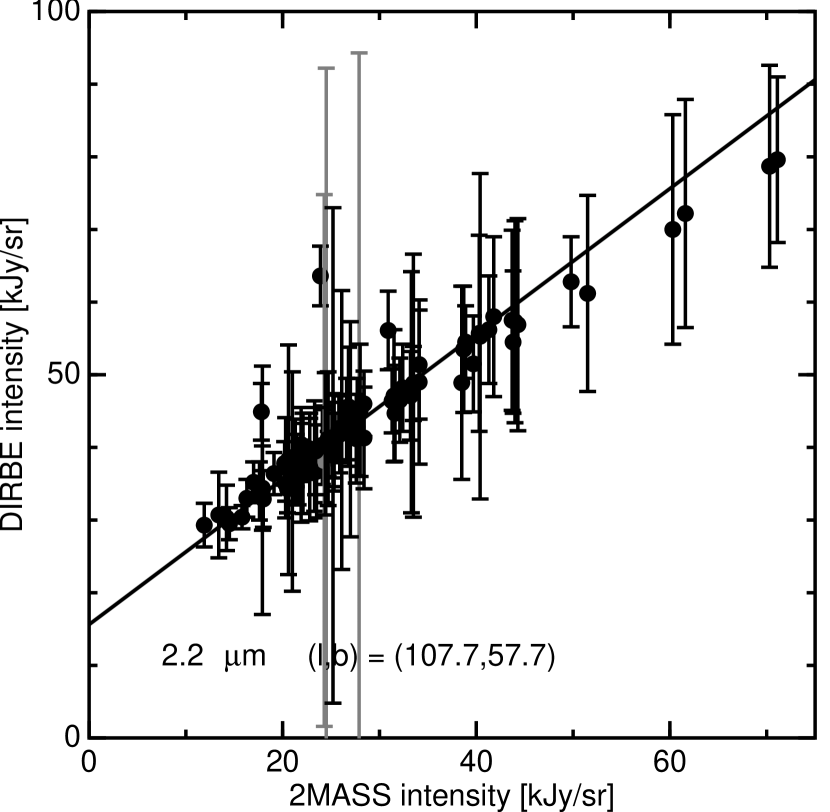
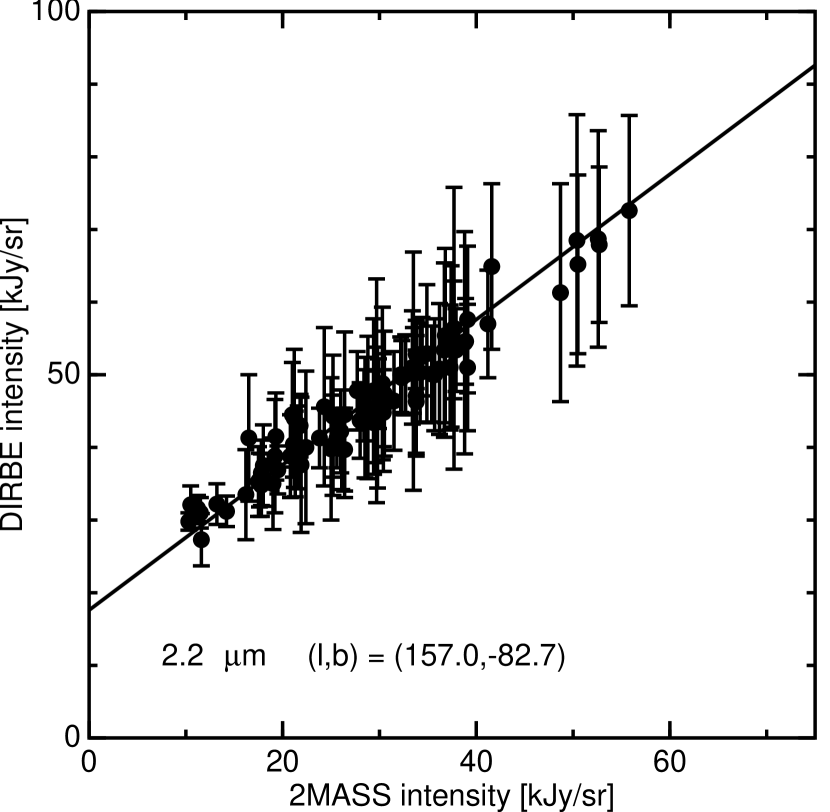
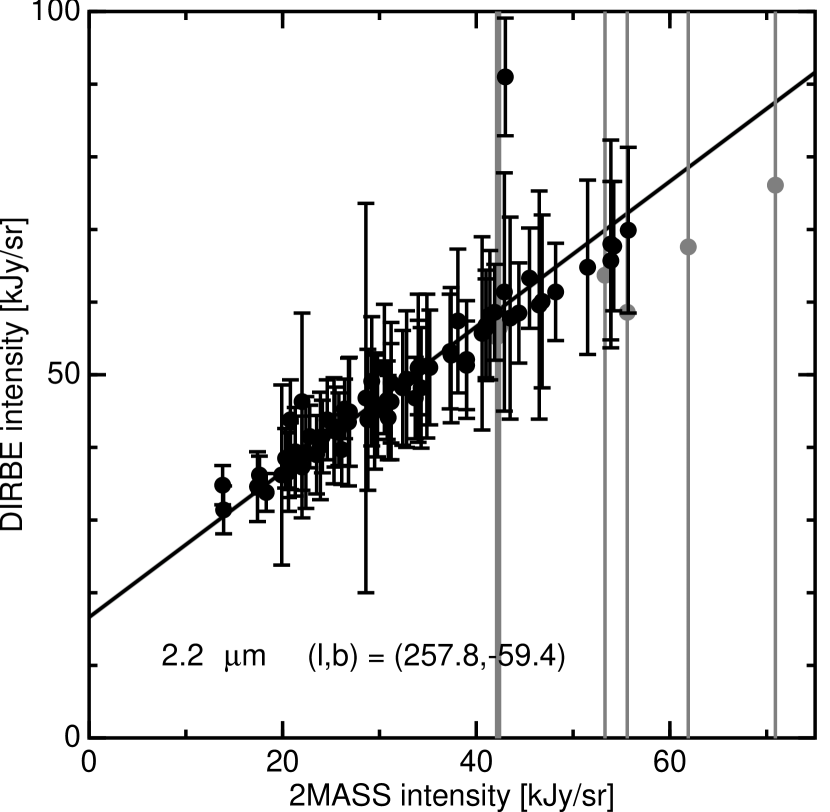
The first term in the ’s in Equation 3 is the “flicker noise” caused by a star that is on the edge of the DIRBE beam. The second term represents the flux error for the star, and it includes a generous allowance for variability between the time of the DIRBE observations and the the time of the 2MASS observations: the “0.1” corresponds to magnitudes. This standard deviation is shown by the error bars in Figures 3 and 4. The actual noise on the DIRBE data is negligible: at and at (Hauser et al., 1998). The uncertainty in the DIRBE zero level, or offset, is also negligible (Hauser et al., 1998). The CIRB should be isotropic, and should vary only slightly within a 2∘ radius of a dark spot. But both the zodi-subtracted data, , and the bright star contribution fluctuate greatly from DIRBE beam to DIRBE beam due to the confusion noise caused by overlapping stars. Figures 3 and 4 show plots of vs. for each of the four fields. The gray points with large error bars are pixels with a bright star at the edge of the beam. These bright stars usually saturate the 2MASS survey, and are assigned a nominal magnitude of 4 and a nominal flux error of a factor of ten. This large flux error guarantees that the pixels affected by saturated stars have no effect on the subsequent analysis. The lines have unit slope with intercepts determined using a weighted median procedure. The average values of the data Di, the zodi-subtracted data DZi, and the derived intercepts DZ(0) for each of the four fields are given in Table 1.

The 2MASS magnitudes were converted to DIRBE fluxes using the derived by Gorjian et al. (2000) from the median of determinations using seven bright red stars. This assumes that there is no significant color difference between the red calibration stars used by Gorjian et al. (2000) and the stars in the dark spots. The 2MASS observations saturate [even in the first read] on stars brighter than magnitude. At this level, the DIRBE data are still substantially affected by confusion noise, so a direct comparison of DIRBE and 2MASS on the same stars will not give a high precision result, but the overall agreement between the unity slope lines and the data in Figures 3 and 4 shows that a direct DIRBE to 2MASS comparison is consistent with the Gorjian et al. (2000) calibration. Figure 5 shows a histogram of the values for the four dark spots combined. Note that the standard deviations derived from the three highest bins of these histograms of the individual histograms are 1.27, 1.93, 2.82, and 2.93 kJy sr-1, while the standard deviation of the Gaussian fit in Figure 5 is 1.81 kJy sr-1. Since this histogram includes the DIRBE detector noise, any small scale errors in the zodiacal light model, any small scale structure in the faint star contribution, a contribution from stellar variability, and a calibration error contribution in addition to any real extragalactic fluctuation, one can take as an upper limit on the extragalactic fluctuation .
| DZ(0) | CIRB | |||||||
|---|---|---|---|---|---|---|---|---|
| [kJy/sr] | [kJy/sr] | [kJy/sr] | [kJy/sr] | |||||
| 127.3 | 63.8 | 50.8 | 1.5 | 44 | 139.65 | 36.77 | 15.98 | 14.50 |
| 107.7 | 57.7 | 61.0 | 2.0 | 86 | 138.85 | 44.61 | 15.62 | 13.85 |
| 157.0 | -82.7 | -26.0 | 2.0 | 86 | 214.58 | 46.22 | 17.60 | 16.20 |
| 257.8 | -59.4 | -57.9 | 1.9 | 78 | 157.73 | 52.78 | 16.62 | 14.69 |
Stars fainter than contribute a small amount which must be subtracted from the intercepts. This contribution was evaluated using the Wainscoat et al. (1992) star count model. But Wright & Reese (2000) and Gorjian et al. (2000) find that this model overpredicts high latitude star counts by 10% in the range. After applying this 10% correction, which assumes that the same ratio applies to , the faint star corrections are , 1.87, 1.50, and 2.03 kJy sr-1 in the four fields. An uncertainty of 10% of the total model prediction is assigned to this correction, and listed in Table 2 under “Faint Source”. Galaxies brighter than may be subtracted incorrectly, and their contribution should be added back into the CIRB. Galaxies with add up to 0.35 kJy sr-1, according to the empirical fits of Gardner et al. (1993). A fraction of these galaxies will be in the 2MASS PSC and, since galaxies should not be subtracted, these incorrectly subtracted galaxies should be added back to the CIRB. The fluxes in the 2MASS Extended Source Catalog objects with add up to 0.25 kJy sr-1, indicating that the correction for galaxies in the PSC should be on the order of kJy sr-1. In addition, 30% of the Extended Source Catalog objects are coincident with PSC objects suggesting that the compact galactic nuclei – which are in the PSC but should not be subtracted from the CIRB – account for 0.1 kJy sr-1. Thus the CIRB estimates shown in Table 1 are given by . An uncertainty of 100% of this correction is included in Table 2 under “Galaxies”.

Note that the statistical uncertainties in the intercepts are all and thus negligible compared to systematic errors in the interplanetary dust model. Gorjian et al. (2000) adopt an uncertainty of 5% of the zodiacal intensity at the ecliptic poles, and this gives an uncertainty of . The effect of a calibration error between the DIRBE flux scale and the 2MASS magnitude scale would be a systematic change in the CIRB. The precision of the Gorjian et al. (2000) calibration of the DIRBE -band fluxes to the standard infrared magnitude is . This DIRBE flux calibration agreed with Arendt et al. (1998) calibration to better than . Thus a uncertainty in the DIRBE vs. 2MASS calibration appears to be conservative. This uncertainty is listed in Table 2 under “Calibration”. The mean of the CIRB estimates in Table 1 is . This standard deviation of the mean of the 4 fields is listed in Table 2 under “Scatter”. Finally, the largest uncertainty is the zodiacal light modeling uncertainty. Adding the errors in Table 2 in quadrature gives a result of kJy sr-1 or nW m-2 sr-1.
| Component | ||
|---|---|---|
| Scatter | 1.49 | 0.51 |
| Faint Source | 0.34 | 0.18 |
| Galaxies | 0.05 | 0.10 |
| Calibration | 3.10 | 2.58 |
| Zodiacal | 5.87 | 3.79 |
| Quadrature Sum | 6.81 | 4.62 |
4 J Band
| DZ(0) | F | CIRB | ||||
|---|---|---|---|---|---|---|
| [kJy/sr] | [kJy/sr] | [kJy/sr] | [kJy/sr] | [kJy/sr] | ||
| 127.3 | 63.8 | 211.19 | 48.23 | 16.67 | 3.08 | 13.64 |
| 107.7 | 57.7 | 205.92 | 58.86 | 16.14 | 3.62 | 12.57 |
| 157.0 | -82.7 | 314.80 | 51.48 | 10.59 | 2.94 | 7.70 |
| 257.8 | -59.4 | 231.47 | 70.01 | 18.13 | 3.92 | 14.26 |
For the -band the contribution from stars with and was calculated on a pixel by pixel basis. This dual wavelength magnitude selection is essentially equivalent to a simple selection. There are very few stars in high Galactic latitude fields with color . Tests in three fields using deeper samples from the 2MASS catalog show that imposing the cut on a sample reduces the intensity by %. Table 3 gives the photometric quantities for the four dark fields at 1.25 m. The correction of the faint star contribution derived from -band star counts has been applied to . Assuming a color of for galaxies gives an estimate of for the improperly subtracted faint galaxy contribution. This has been added to the CIRB estimates in the table. The mean of the CIRB estimates is , and this would change by for changes in the flux of 1512 Jy for magnitude at used in this paper. This value is the median of calibrations based on And, Tau, Aur, Boo, Her, and Peg. This calibration has an uncertainty of and differs from the Arendt et al. (1998) calibration by -2.4%. A uncertainty in the calibration of DIRBE vs. 2MASS has been adopted giving the error listed in Table 2 . The systematic error due to interplanetary dust modeling is 5% of the ecliptic pole zodiacal intensity or . Adding the errors in quadrature gives a result of kJy sr-1 or nW m-2 sr-1. This is obviously not a significant detection due to the large uncertainty in the zodiacal foreground. However, a upper limit is which is a slight improvement on Hauser et al. (1998).
The width of the combined histogram of the residuals for the -band data is or which gives an upper limit on extragalactic fluctuations since it also includes detector noise and star subtraction errors.
A CIRB of kJy sr-1 at 1.25 m is fainter than the prediction of Dwek & Arendt (1998), whose correlation gives for this paper’s -band CIRB. Given the combined uncertainties in the difference, this is higher than the result in this paper.
5 Discussion
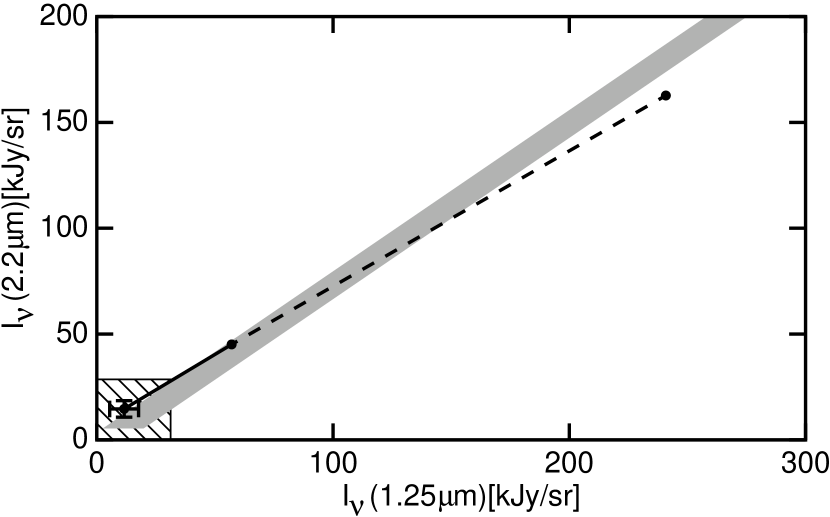
Subtracting the 2MASS catalog from the zodi-subtracted DIRBE data yields a statistically significant, isotropic background at 2.2 m of kJy sr-1 which is consistent with the earlier results from Gorjian et al. (2000) and Wright & Reese (2000) within the systematic error associated with the modeling the zodiacal dust cloud. Averaging the results of Gorjian et al. (2000), Wright & Reese (2000) and this paper gives a CIRB at 2.2 m of . This averaging has not reduced the estimated error which is dominated by systematic effects that affect all three results equally. The foreground due to interplanetary dust at 1.25 m is too large to allow a CIRB detection, but an improved upper limit is found. Note that the Zodi-Subtracted Mission Average maps which used the Kelsall et al. (1998) zodiacal light model give a CIRB that is 13.75 kJy sr-1 larger at 1.25 m and 6.08 kJy sr-1 larger at 2.2 m than results obtained here using the zodiacal light model described in Wright (1998) and Gorjian et al. (2000) based on the very strong no-zodi principle of Wright (1997). Figure 6 shows a plot of the -band intensity vs. -band intensity averaged over the four dark spots analyzed in this paper. Three values are plotted: the average total intensity , the average zodi-subtracted intensity , and the CIRB estimates. The Hauser et al. (1998) upper limits on the CIRB, the Dwek & Arendt (1998) correlation and the error bars from this paper are shown as well. This figure emphasizes the large subtractions that are involved in determining the CIRB from data taken 1 AU from the Sun: the zodiacal light is about 16 times larger than the CIRB at 1.25 m and 8 times larger than the CIRB at 2.2 m. Galactic stars are a problem in the large DIRBE beam, but in the selected dark spots the effect of stars is 4 times less than that of the zodiacal light.
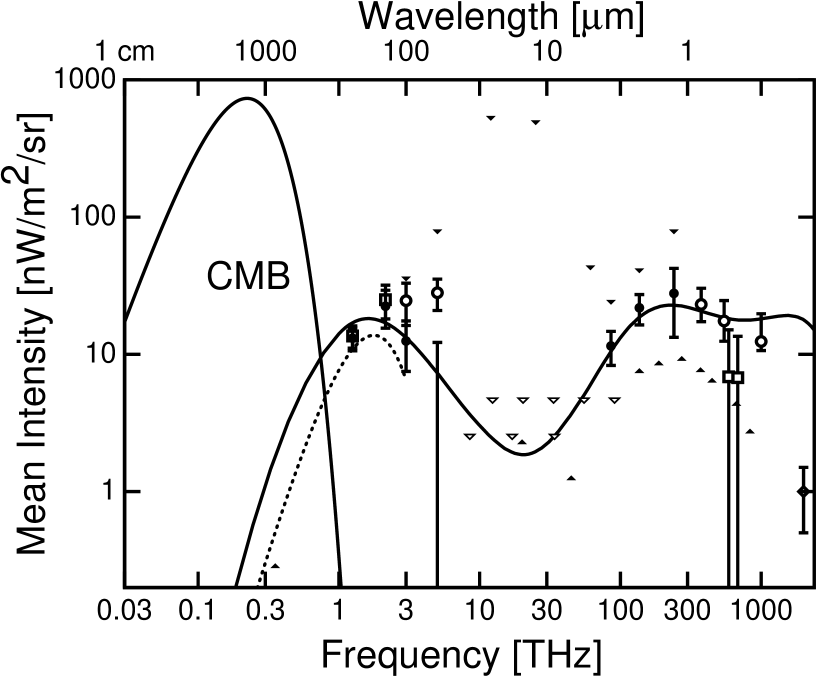
Bernstein (1999) has measured the optical extragalactic background light and obtained results at which are consistent with a reasonable extrapolation through the uncertain -band result found here, as shown in Figure 7. Both Bernstein (1999) and this work face challenging and uncertain corrections for the zodiacal light, but the two papers use very different techniques and should not have systematic errors in common. Thus the lack of a discontinuity in the spectrum between 0.8 and 1.25 m is an indication in favor of the background level reported here. The model shown in Figure 7 is the CDM-Salpeter model from Primack et al. (1999) which appears to fit the observed far IR to near IR to optical ratios. But the model was multiplied by 1.84 to match the level of the observed background.
References
- Arendt et al. (1998) Arendt, R. et al. 1998, ApJ, 508, 74
- Bernstein (1999) Bernstein, R. 1999, in ‘The Hy-Redshift Universe: Galaxy Formation and Evolution at High Redshift’, eds. A. J. Bunker and W. J. M. van Breugel, ASP Conference Proceedings Vol. 193, 487
- Boggess et al. (1992) Boggess, N. W. et al. 1992, ApJ, 397, 420
- Cutri et al. (2000) Cutri, R. et al., 2000, “Explanatory Supplement to the 2MASS Second Incremental Data Release,” http://www.ipac.caltech.edu/2mass/releases/second/doc/explsup.html, viewed 28 March 2000.
- Dwek & Arendt (1998) Dwek, E. & Arendt, R. 1998, ApJ, 508, L9
- Dube, Wicks & Wilkinson (1977) Dube, R. R., Wicks, W. C. & Wilkinson, D. T. 1977, ApJ, 215, L51
- Finkbeiner, Davis & Schlegel (2000) Finkbeiner, D, Davis, M. & Schlegel, D. 2000, ApJ, 544, 81
- Fixsen et al. (1998) Fixsen, D., Dwek, E., Mather, J. Bennett, C. & Shafer, R. 1998, ApJ, 508, 123
- Franceschini et al. (1997) Franceschini, A. et al. 1997, “Source Counts and Background Radiation”, in The Far Infrared and Submillimetre Universe, 159
- Funk et al. (1998) Funk, B., Magnussen, N., Meyer, H., Rhode, W., Westerhoff, S. & Wiebel-Sooth, B. 1998, Astroparticle Physics, 9, 97
- Gardner et al. (1993) Gardner, J. P., Cowie, L. L. & Wainscoat, R. J. 1993, ApJ, 415, L9
- Gorjian et al. (2000) Gorjian, V., Wright, E. & Chary, R. 2000, ApJ, 536, 550
- Hauser et al. (1998) Hauser, M. et al. 1998, ApJ, 508, 25
- Hurwitz, Bowyer & Martin (1991) Hurwitz, M., Bowyer, S. & Martin, C. 1991, ApJ, 372, 167
- Kashlinsky & Odenwald (2000) Kashlinsky, A. & Odenwald, S. 2000, ApJ, 528, 74
- Kelsall et al. (1998) Kelsall, T. et al. 1998, ApJ, 508, 44
- Madau & Pozzetti (2000) Madau, P. & Pozzetti, L. 2000, MNRAS, 312, L9
- Primack et al. (1999) Primack, J., Bullock, J., Somerville, R. & MacMinn, D. 1999, Astroparticle Physics, 11, 93
- Smail et al. (1999) Smail, I., Ivison, R., Blain, A. & Kneib, J. 1999, “After the Dark Ages: When Galaxies were Young (the Universe at )”. 9th Annual October Astrophysics Conference in Maryland held 12-14 October, 1998. College Park, Maryland. Edited by S. Holt and E. Smith. American Institute of Physics Press, 1999, p. 312
- Stanev & Franceschini (1998) Stanev, T. & Franceschini, A. 1998, ApJ, 494, L159
- Toller (1983) Toller, G. 1983, ApJ, 266, L79
- Wainscoat et al. (1992) Wainscoat, R., Cohen, M., Volk, K., Walker, H., & Schwartz, D. 1992, ApJS, 83, 111
- Wright (1997) Wright, E. 1997, BAAS, 29, 1354
- Wright (1998) Wright, E. 1998, ApJ, 496, 1
- Wright & Reese (2000) Wright, E. & Reese, E. 2000, ApJ, 545, 43
- Wright (2001) Wright, E. 2001, in preparation