Interferometric measurement of resonance transition wavelengths in C IV, Si IV, Al III, Al II, and Si II
Abstract
We have made the first interferomeric measurements of the wavelengths of the important ultraviolet diagnostic lines in the spectra C IV near 155 nm and Si IV near 139 nm with a vacuum ultraviolet Fourier transform spectrometer and high-current discharge sources. The wavelength uncertainties were reduced by one order of magnitude for the C IV lines and by two orders of magnitude for the Si IV lines. Our measurements also provide accurate wavelengths for resonance transitions in Al III, Al II, and Si II.
The resonance transitions 2s 2S1/2 – 2p 2P1/2,3/2 near 155 nm in C IV and 3s 2S1/2 – 3p 2P1/2,3/2 near 139 nm in Si IV are among the most important transitions for optical plasma diagnostics of hot plasmas in the interstellar medium, the intergalactic medium and stellar atmospheres. During the past decade, the increasing light gathering power of ground and space based telescopes has made it feasible to observe these lines with high resolution spectrometers. For example, the Goddard High Resolution Spectrograph (GHRS) and the Space Telescope Imaging Spectrograph (STIS) on the Hubble Space Telescope have modes of operation with resolving powers of up to 100000. For a reliable analysis of high resolution spectra from these instruments, transition wavelengths must be known with an accuracy of at least 1 part in 106. We have therefore undertaken new measurements of the C IV and Si IV resonance transition wavelengths. Our results confirm the observation of Smith et al. (1998) that the accuracy of available wavelength data for doubly- and triply-ionized atoms is often very inadequate.
The strongest motivation, at present, for a new measurement of the C IV and Si IV resonance lines came from the recent interest in determining bounds for temporal and/or spatial variations of the fine structure constant. This may be achieved through a measurement of the splitting of spectral lines in fine structure multiplets through spectroscopic observations of distant gas clouds seen against a background quasar. In a series of articles (Webb et al., 1999; Dzuba, Flambaum, & Webb, 1999a, b), a method was suggested that considerably increases the sensitivity of optical measurements to variations of the fine structure constant. A recent analysis of quasar absorption spectra (Webb et al., 1999), based on accurate wavelengths for ultraviolet transitions in Mg II (Pickering, Thorne, & Webb, 1998) and Fe II (Nave et al., 1991), found weak statistical evidence for a smaller fine structure constant in systems with cosmological redshifts . With this paper we intend to contribute accurate measurements of wavelengths for resonance transitions of several important ions in the vacuum ultraviolet to enable the analysis of quasar absorption spectra with much larger cosmological redshifts.
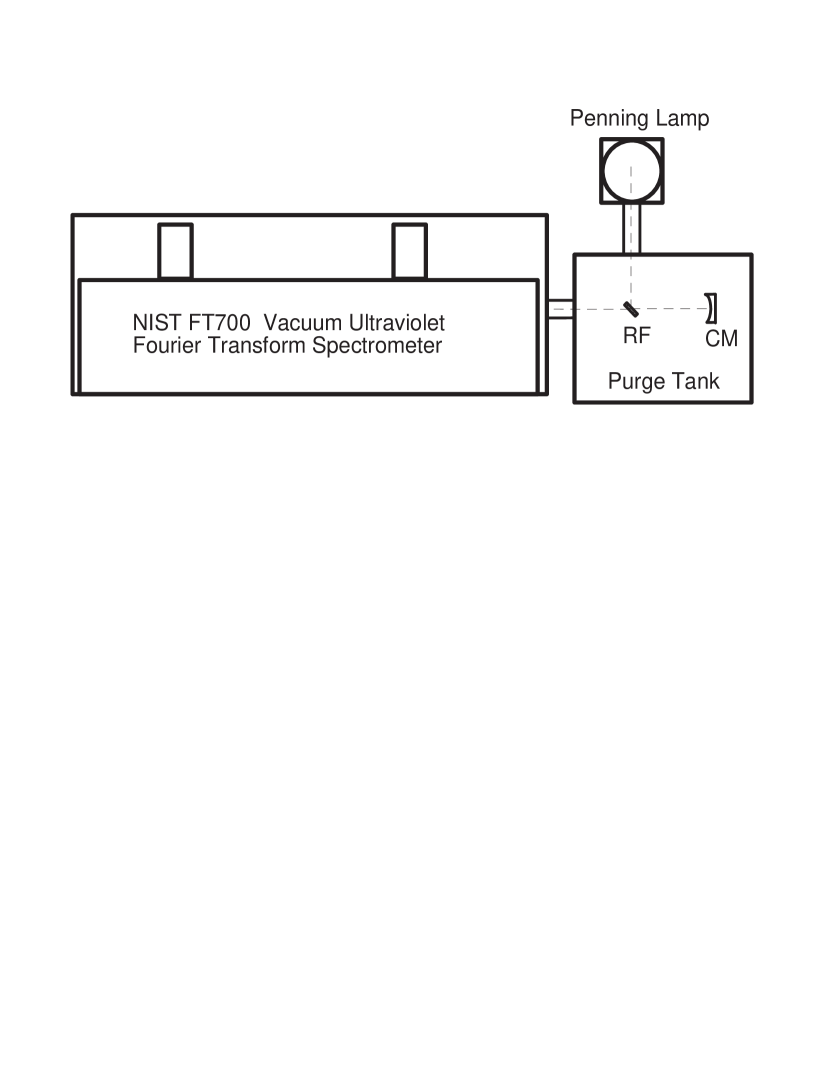
Figure 1 is a block diagram of the experimental setup. The spectra were measured with the FT700 vacuum ultraviolet Fourier transform spectrometer (FTS) at the National Institute of Standards and Technology (NIST) (Griesmann et al., 1999). Photomultipliers with cesium-iodine photocathodes limited the optical bandpass of the spectrometer to wavelengths below 190 nm which was essential to achieve sufficient signal-to-noise ratios in the vacuum ultraviolet. A number of scans were co-added for total observation times of 20 min to 30 min per interferogram. A high-current Penning discharge lamp (Heise et al., 1994) with silicon carbide (SiC) cathodes and Ne as carrier gas was used to excite Si and C spectra. The SiC cathodes of our Penning lamp contained Al as an impurity in sufficient quantity to allow us to measure the wavelengths of the Al III and Al II resonance transitions. High discharge currents up to 2 A and carrier gas pressures as low as 0.2 Pa were needed to excite spectra of triply ionized atoms in the Penning discharge. The radiation emitted from the center of the discharge was imaged near the entrance aperture of the Fourier transform spectrometer with a concave mirror (CM in Figure 1) and a metal-dielectric reflectance filter (RF in Figure 1). To avoid systematic uncertainties resulting from inhomogeneous illumination of the entrance aperture, the location of the discharge image was displaced from the entrance aperture by several cm to achieve a degree of spatial averaging in the plane of the entrance aperture. The aperture ratio of the imaging system was approximately matched to that of the spectrometer. All components of the imaging system were enclosed in a sealed chamber that was continuously purged with Ar gas to replace oxygen in the optical path. The metal-dielectric reflectance filter had a peak transmission of 60% at 160 nm, near the C IV resonance lines, and a bandpass (FWHM) of approximately 30 nm. The purpose of this filter was to reduce the intensity of several very strong Si II lines around 180 nm and thus to increase the signal-to-noise ratio in the spectra. Without this filter the weak C IV resonance lines were not observed. The Doppler width of spectral lines emitted by the Penning lamp under high current conditions was approximately 1 cm and thus a spectral resolution of 0.2 cmwas sufficient to resolve them. The interferograms were phase corrected, transformed and analyzed with the FTS data analysis program “xgremlin” (Nave, Sansonetti, & Griesmann, 1997).
It is one of the greatest strengths of the FTS method that the large optical bandpass allows the wavenumber calibration of VUV spectra with accurate wavenumber standards at much smaller wavenumbers. Wavenumber calibration is global, not local as with grating spectrometers. This leads to short calibration chains and therefore smaller statistical and systematic uncertainties. The wavenumber calibration of our spectra is based on a selection of the Ar II wavelength standard lines near 400 nm which were measured by Whaling et al. (1995). A broad band spectrum of the Penning lamp operating with Ar as a carrier gas and at a relatively low current of 0.5 A was measured. We selected 24 standard lines between 430 nm and 520 nm with signal-to-noise ratios between 200 and 1000 to calibrate the broad band spectrum. All lines had upper levels of low excitation and were free of self absorption. This resulted in very accurate wavenumbers for two Si II lines at 181.693 nm and 180.801 nm (see Table 1). These lines, which have a signal-to-noise ratio of at least 500 in both low and high current spectra, were then used to calibrate the wavenumber scales of the spectra from the high-current measurements in the vacuum ultraviolet.
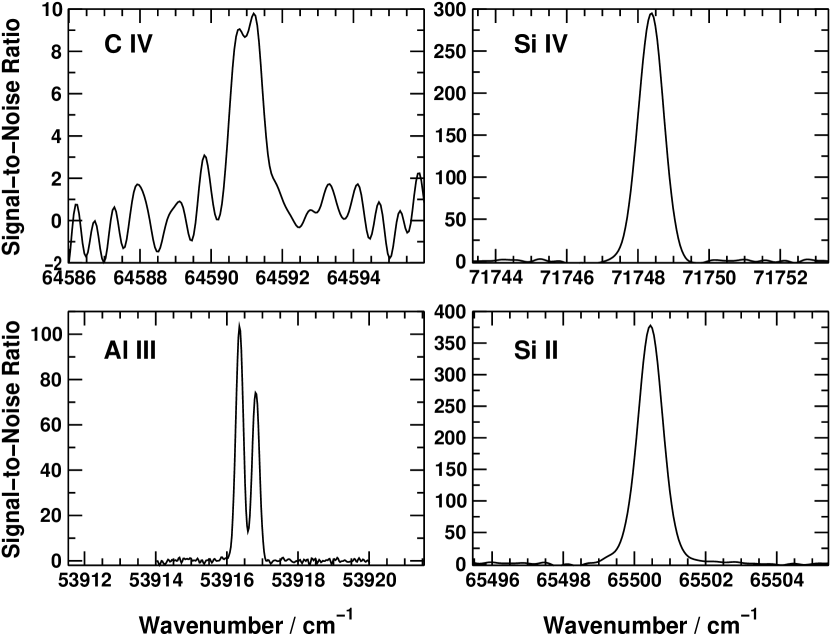
Table 1 contains our results for resonance transition wavenumbers in C IV, Si IV, Al III, Al II, and Si II. The wavenumbers shown are the combined results of several measurements that were made for different Penning discharge conditions. Five interferograms were analyzed for C IV and eight for Si IV. The table includes values from widely used critical compilations of optimized energy levels for comparison (Martin & Zalubas, 1979, 1983; Moore, 1993). For the C IV lines we have given the uncertainty of the best previous measurement by Bockasten, Hallin, & Hughes (1963). Uncertainties of the previous wavenumber data for the other ions can be found in the compilation by Kaufman & Edlén (1974). Figure 2 shows the signal-to-noise ratio that was obtained for several of the transitions. All but the C IV lines have very good signal-to-noise ratios of at least 100. The weakness of the C IV lines reflects the large amount of energy that is required to create C3+ in collisions. Using the ionization potentials for multiply charged ions published in Moore (1949) we estimate that 83.5 eV must be expended to remove three electrons from a C atom whereas only 57.9 eV are needed to remove the same number of electrons from a Si atom. Even without detailed consideration of the cross sections for the ionization processes, a higher density of Si3+ than C3+ is thus expected in the Penning discharge.
Spectral line positions were determined by fitting Voigt functions to the spectral lines. The values in Table 1 are the means of up to eight separate measurements. Uncertainties in Table 1 are reported at a level of one standard deviation. Statistical uncertainties of the line positions were calculated as described by Brault (1988). The total statistical uncertainty of a spectral line position combines the uncertainty in the wavenumbers of the Si II lines that were used to calibrate the spectra in the vacuum ultraviolet and the uncertainties of the wavenumber scale calibrations. In all cases the statistical line position uncertainty of the vacuum ultraviolet lines was the dominant uncertainty component. At first glance, our results in Table 1 are suggestive of systematic errors in our measurements because they are all somewhat smaller than previous data. The two systematic errors that could lead to significant uncertainties are pressure shifts in the discharge and illumination shifts. Learner & Thorne (1988) have investigated both effects in FTS measurements with a hollow cathode lamp and found that they never exceed a few times 10-3cm. Pressure shifts in the Penning discharge lamp are negligible because the pressure in the lamp is at least two orders of magnitude lower than in a hollow cathode lamp. Finally, the Zeeman splitting of the spectral lines emitted in the magnetic field of the Penning lamp (0.09 T) is only 0.1 cm- about an order of magnitude smaller than the Doppler width of the lines. The Zeeman splitting is symmetric and does not shift the line positions.
The Al and Si lines included in Table 1 also allow us to make a strong presumptive case for the absence of significant systematic uncertainties. If the differences in the last column of Table 1 were the result of a calibration error, these differences would be proportional to the wavenumber which, as the numbers clearly show, is not the case. Also, the fact that the Si II lines and the Al II line are in very good agreement with earlier, relatively accurate, measurements precludes the possibility of a scale error due to calibration problems. As an additional test we have measured the Al III resonance lines with a high-current hollow-cathode lamp. In this measurement the Al III lines were measured together with Ar standard lines. The results agreed well with those that were obtained with the Penning lamp. The discharge temperature in the hollow-cathode lamp is much lower than in the Penning lamp which allowed us to resolve the hyperfine structure of the Al III resonance lines. Natural Al consists of a single stable isotope 27Al which has a nuclear spin of . The ground level of Al2+ is split into two levels with total angular momenta and . Table 1 contains wavenumbers for both hyperfine structure components of the Al III resonance lines and their centers of gravity (the wavenumbers were weighted with the integral of the spectral lines) for comparison with measurements in which the hyperfine structure remained unresolved.
We conclude that the reason for the significant discrepancies between our results and previous measurements are the improved experimental methods developed in the intervening years. For example, the last laboratory measurement of the wavelengths of the C IV resonance lines was made nearly four decades ago by Bockasten, Hallin, & Hughes (1963). Tunklev et al. (1997) who recently published a new analysis of the C IV spectrum adopted the wavelengths of Bockasten, Hallin, & Hughes (1963) for the resonance transitions. The only recent measurement of the C IV resonance lines by Rottman et al. (1990) was an observation of the lines in the solar photosphere which may be more susceptible to systematic errors than a laboratory measurement. In general, the older data appear to have considerable systematic wavelength uncertainties and those uncertainties seem to increase with increasing ionization stage. We believe that our new data make a strong case for further interferometric laboratory measurements of vacuum ultraviolet spectral lines that are important for astrophysical plasma diagnostics and for the need to extend the FTS method to even shorter wavelengths.
References
- Bockasten, Hallin, & Hughes (1963) Bockasten, K., Hallin, R., and Hughes, T. P. 1963, Proc. Phys. Soc., 81, 522
- Brault (1988) J. W. Brault 1988, Mikrochim. Acta (Wien) 1987 III, 215-227
- Dzuba, Flambaum, & Webb (1999a) Dzuba, V. A., Flambaum, V. V., and Webb, J. K. 1999a, Phys. Rev. Lett., 82, 888
- Dzuba, Flambaum, & Webb (1999b) Dzuba, V. A., Flambaum, V. V., and Webb, J. K. 1999b, Phys. Rev. A, 59, 230
- Griesmann et al. (1999) Griesmann, U., Kling, R., Burnett, J. H., and Bratasz, L. 1999, “The NIST FT700 Vacuum Ultraviolet Fourier Transform Spectrometer: in Ultraviolet Atmospheric and Space Remote Sensing: Methods and and Instrumentation II”; Eds.: G. R. Carruthers and K. F. Dymond, Proc. of SPIE 3818, 180
- Heise et al. (1994) Heise, C., Hollandt, J., Kling, R., and Kühne, M. 1994, Appl. Opt., 33, 5111
- Kaufman & Edlén (1974) Kaufman, V. and Edlén, B. 1974, J. Phys. Chem. Ref. Data, 3, 825
- Learner & Thorne (1988) Learner, R. C. M. and Thorne, A. P. 1988, J. Opt. Soc. Am. B, 5, 2045
- Martin & Zalubas (1979) Martin, W. C. and Zalubas, R. 1979, J. Phys. Chem. Ref. Data, 8, 817
- Martin & Zalubas (1983) Martin, W. C. and Zalubas, R. 1983, J. Phys. Chem. Ref. Data, 12, 751
- Moore (1949) Moore, C. E. 1949, Atomic Energy Levels Vol. 1, Circular of the National Bureau of Standards 467, U. S. Government Printing Office, Washington, D. C.
- Moore (1993) Moore, C. E., edited by Gallagher, J. W. 1993, “Tables of Spectra of Hydrogen, Carbon, Nitrogen, and Oxygen Atoms and Ions”, CRC Handbook of Chemistry and Physics, Edition 76, CRC Press, Boca Raton, Florida
- Nave et al. (1991) Nave, G., Learner, R. C. M., Thorne, A. P., and Harris, C. J. 1991, J. Opt. Soc. Am. B, 8, 2028
- Nave, Sansonetti, & Griesmann (1997) Nave, G., Sansonetti, C. J., and Griesmann, U. 1997, “Progress on the NIST IR–vis–UV Fourier transform spectrometer”, in Fourier Transform Spectrometry, Vol. 3, OSA Technical Digest Series (Optical Society of America, Washington, DC), 38
- Pickering, Thorne, & Webb (1998) Pickering, J. C., Thorne, A. P., and Webb, J. K. 1998, Mon. Not. R. Astron. Soc., 300, 131
- Rottman et al. (1990) Rottman, G. J., Hassler, D. M., Jones, M. D., and Orrall, F. Q. 1990, ApJ, 358, 693
- Smith et al. (1998) Smith, P. L., Thorne, A. P., Learner, R. C. M., Pickering, J. C., Kling, R., Mende, W., and Kock, M. 1998, in ASP Conf. Ser. 143, The Scientific Impact of the Goddard High Resolution Spectrograph, ed. J. C. Brandt, T. B. Ake, and C. C. Petersen, 395
- Tunklev et al. (1997) Tunklev, M., Engström, L., Jupén, C., and Kink, I. 1997, Physica Scripta, 55, 707
- Webb et al. (1999) Webb, J. K., Flambaum, V. V., Churchill, C. W., Drinkwater, M. J., and Barrow, J. D. 1999, Phys. Rev. Lett., 82, 884
- Whaling et al. (1995) Whaling, W., Anderson, W. H. C., Carle, M. T., Brault, J. W., and Zarem, H. A. 1995, J. Quant. Spectrosc. Radiat. Transfer, 53, 1
| Spectrum | Transition | Wavenumber | Wavelength | Prev. Value | |
|---|---|---|---|---|---|
| cm | nm | cm | cm | ||
| C IV | 2s 2S1/2 – 2p 2P1/2 | 64483.65(9) | 155.0781(2) | 64484.0(4)a | -0.35 |
| 2s 2S1/2 – 2p 2P3/2 | 64590.99(4) | 154.8204(1) | 64591.7(4)a | -0.71 | |
| Si IV | 3s 2S1/2 – 3p 2P1/2 | 71287.376(2) | 140.277291(4) | 71287.5(3)b | -0.16 |
| 3s 2S1/2 – 3p 2P3/2 | 71748.355(2) | 139.376018(4) | 71748.6(3)b | -0.29 | |
| Al III | 3s 2S1/2 – 3p 2P1/2 | 53682.6692(12) | 186.279858(4) | ||
| 53683.1953(15) | 186.278033(5) | ||||
| 53682.884(2) | 186.279113(7) | 53682.93(6)c | -0.046 | ||
| 3s 2S1/2 – 3p 2P3/2 | 53916.3574(6) | 185.472470(2) | |||
| 53916.8149(8) | 185.470896(3) | ||||
| 53916.544(1) | 185.471829(3) | 53916.60(6)c | -0.056 | ||
| Al II | 3s2 1S0 – 3s 3p 1P1 | 59851.976(4) | 167.07886(1) | 59852.02(4)c | -0.044 |
| Si II | 3p 2P1/2 – 3p 2D3/2 | 55309.3404(4) | 180.801288(1) | 55309.35(3)b | -0.0096 |
| 3p 2P1/2 – 4s 2S1/2 | 65500.4538(7) | 152.670698(2) | 65500.47(4)b | -0.0138 |
Note. — The wavenumbers of the Al III resonance lines were measured with a hollow-cathode lamp; the hyperfine structure of the lines is discussed in the paper. In the table, the center of gravity of the hyperfine structure components is given in italics. This value should be used for comparison with previous measurements which did not resolve the hyperfine structure. Previous experimental data referred to in column five are taken from the following compilations: a Moore (1993), b Martin & Zalubas (1983), c Martin & Zalubas (1979).