Cold dust in the starburst galaxy M 82
Abstract
The starburst galaxy M 82 has been mapped at 1.2 mm using the IRAM 30–m telescope and the MPIfR 19–channel bolometer. The influence of the sidelobe pattern and the 12CO(21) line has been carefully analyzed. Based on this analysis, we conclude that the cold dust does not extend far into the halo as has been previously claimed. The total mass of dust in the inner 3 kpc of the galaxy is M⊙. Assuming a solar gas-to-dust ratio, the inferred total mass of gas is M⊙ .
Unlike in any other galaxy we find the CO(21) line emission to be clearly more extended than the 1.2 mm dust emission. A likely explanation for this exceptional behaviour, seen for the first time in galaxies, is heating of molecular gas by low–energy cosmic rays and soft X–rays in the halo of M 82.
Key Words.:
dust – galaxies: individual: M82 – galaxies: ISM – galaxies: starburst – radio continuum: galaxies – radio continuum: ISM1 Introduction
The prototypical starburst galaxy M 82 is the prime example of a galaxy in which the violent star formation activity gives rise to the formation of a bipolar outflow and an associated extended halo, which is visible in various regimes of the electro–magnetic spectrum. Outflowing material was first evident in the H light (Lynds & Sandage 1963, McCarthy et al. 1987, Bland & Tully 1988). The kinematics of the outflowing material and the geometry of the cone have been thoroughly worked out by McKeith et al. (1995). The recent detection of H emission 11 kpc away from the plane of M 82 (Devine & Bally 1999) determines the cap of this outflow. The whole scenario is further corroborated by the existence of vertical magnetic field lines (Reuter et al. 1994), along which relativistic particles partake in the outflow, thus forming a radio halo (Seaquist & Odegard 1991). This halo exhibits a filamentary structure away from the plane (Reuter et al. 1992). Hot gas has been also found in some kind of halo which extends for several arcminutes along the minor axis (Fabbiano 1988, Schaaf et al. 1989, Bregman et al. 1995). This X–ray emission correlates well with the H if observed with sufficiently high angular resolution (Watson et al. 1984).
In this context, the search for neutral gas and dust away from the plane of M 82 has seen a number of attempts. Owing to the close interaction between M 81 and M 82, neutral hydrogen is seen enveloping M 82, but whether this gas stems from the M 81 or has been expelled from M 82 is still a matter of debate (Yun et al. 1994). Molecular gas associated with the dusty filaments outside the plane of M 82 has been reported by Stark & Carlson (1984) and has been observed by Sofue et al. (1992) out to a projected distance of 2 kpc. Clear evidence for the existence of scattering dust away from the plane of M 82 comes from measurements of optical polarization (Bingham et al. 1976, Notni et al. 1981, Neininger et al. 1990).
Owing to its high luminosity in all spectral bands, M 82 has been a prime target for first–light experiments in the mm– and submm–regime (Elias et al. 1978, Jura et al. 1978). With the improvement of bolometric measurements detailed studies of the distribution of the cold dust in this galaxy have become feasible; thus the recent past has seen an increasing number of such investigations (2 mm: Kuno & Matsuo 1997; 1 mm: Thronson et al. 1989, Hughes et al. 1990, Krügel et al. 1990a, Alton et al. 1999; 0.5 mm: Jaffe et al. 1984, Smith et al. 1990, Alton et al. 1999). Carlstrom & Kronberg (1991) have shown that at 3 mm thermal free–free emission still dominates the overall spectrum.
Apart from these dedicated bolometric measurements, continuum maps at millimeter wavelengths have been produced as by-products in various observations of spectral lines (e.g. Neininger et al. 1998). As a result of the discoveries of a galactic wind and halo in M 82, the more recent bolometric measurements aimed at detecting a dust halo at mm wavelengths. CO emission away from the plane was reported by Stark & Carlson (1984), Nakai et al. (1986) and by Sofue et al. (1992). An outflow of molecular gas was claimed by Nakai et al. (1987). A dust continuum halo was first mentioned by Hughes et al. (1990). Observations with higher resolution (Kuno & Matsuo 1997) suggest emission at 2 mm out to 400 pc from the plane. Recently Alton et al. (1999) reported a dust outflow from the central region of M 82, based on their sub-mm images.
Here we report observations of M 82 in the mm continuum performed with the MPIfR 19-channel bolometer at the IRAM 30-m telescope. In Sect. 2 we describe the observations and data analysis, with consideration of the possible influence of the error beam. In Sect. 3 the distribution of the cold dust in M 82 will be presented, with a discussion conducted in Sect. 4, along with a comparison with other published measurements. In Sect. 5 we give a short summary of our results.
2 Observations and data reduction
2.1 Observations
We used the 19-channel bolometer of the MPIfR (Kreysa et al. 1993) in the Nasmyth focus of the IRAM 30-m telescope during the spring session in 1997. The weather conditions were fair during our night-time runs, with rather stable zenith opacities between 0.2 and 0.3 at 230 GHz.
The 19 channels of the bolometer are arranged in a closely packed hexagonal array, with beamsizes of 11′′ FWHM and spacings of 20′′. The calibration was performed by mapping Uranus every morning. The pointing and focus checks were made at regular intervals during the observations using nearby quasars (in particular 1308+326). The map was centered on the near–infrared peak at , (Joy et al. 1987). The data were taken in the standard mapping mode where the field is scanned at a constant speed of 4′′ per second in azimuth, with subsequent scans being spaced by 4′′ in elevation. The map size was chosen large enough (320′′ 270′′) to assure a good baseline determination in the presence of extended emission. We thus made sure that the field was mapped sufficiently far out perpendicular to the major axis of M 82, such as to trace the full extent of any dust component in the halo. While scanning the subreflector was wobbled at a 2 Hz rate with an amplitude of 45′′, which is small enough to ensure a stable beam pattern. Due to the small wobbler throw the OFF position was not necessarily free of emission, but using the algorithm of Emerson et al. (1979) this should have no effect on the resulting map. We also mapped Mars once and the point source 3C 273 twice each in order to obtain a detailed beam pattern. In addition, more maps of Mars and other calibration sources were used to properly check the calibration.
2.2 Standard data reduction
The whole field was covered six times. For each coverage we performed the data reduction separately using NIC (GILDAS software package), starting with the subtraction of a third–order baseline.
The scanning mode described in the previous section leads to maps which contain a superposition of a positive and a negative image of the source (double-beam maps). In principle the deconvolution can be done by dividing the Fourier transform (FT) of the measured intensity distribution by the FT of the wobble function and transforming back to image space. As the FT of the wobble function is a sine wave with zeroes at the origin and at harmonics of the inverse wobbler throw, it would cause problems at these spatial frequencies. To avoid these problems we used the algorithm of Emerson et al. (1979) to restore the double–beam maps into equivalent single–beam maps.
Thereafter we combined the 19 channels and calibrated the resulting map with respect to Mars and Uranus (assuming brightness temperatures of 198.5 K and 97.2 K respectively). In a last step the four best coverages were averaged and regridded onto equatorial (B1950) coordinates. (Two coverages were ignored because of bad S/N ratios.) This final map has a sensitivity of 5 mJy per beam and a angular resolution of 12′′ (HPBW).
2.3 Influence of the error beam
In order to check the influence of the error beam on the extended emission we applied a CLEAN algorithm developed for single–dish maps (Klein & Mack 1995) to each coverage using a radially symmetric antenna pattern. This pattern was obtained in the following way: A field of 45 35 size was mapped centred on 3C 273. This antenna pattern was then rotated in small steps (), and these individual (rotated) maps were averaged to yield a nearly radially symmetric pattern. The subtraction of the CLEANed map from the original one showed that the error beam contributes less than 25% of the rms noise level to the extended emission (′′ away from the central position).
Even the sidelobes can be ignored in our case, because at 1.2 mm they are of the order of 2%, corresponding to roughly 5 mJy/beam in the M82 maps. Averaging four coverages with different parallactic angles (and accordingly different positions of the sidelobes) the effect of the antenna pattern on the extended emission falls well below the rms noise of our final map.
This extra analysis make sure that the extended emission seen in our map is real and not affected by the error beam.
2.4 Correction for CO emission
Using the 19-channel bolometer, with its central frequency of 240 GHz and its effective bandwidth of 80 GHz, the 12CO(21) line at 230 GHz might noticeably contribute to the total intensity in the bandpass. To get a reliable information on the distribution of the cold dust, we applied the following correction to our continuum map:
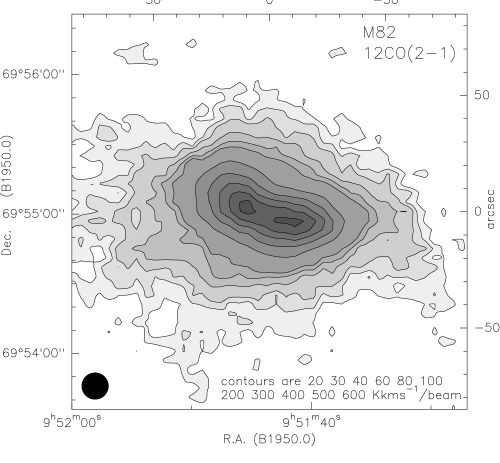
We used a map of M 82 made with the same telescope in the 12CO(2-1) line (obtained to provide the zero spacings for an investigation with the Plateau de Bure interferometer, Weiß et al.in prep.). This map was measured in the on–the–fly mode. The on–the–fly technique ensures a uniform sampling of the emission over the whole field with good signal-to-noise ratio. Since we knew from our continuum map that the effects of the error beam can be neglected at a frequency of 240 GHz, we did not apply any error beam correction to the CO map.
Integrating over the effective bandwidth of the bolometer, the total continuum flux in the beam at the peak position is given by
where mJy is the peak flux at 240 GHz.
The integrated intensity of the 12CO(21) line at the same position was taken from our CO map. Expressing this in terms of frequency instead of velocity, the integrated intensity reads .
To obtain the total flux in the 12CO(21) line we used the Rayleigh–Jeans Approximation and assumed that T:
With the beam solid angle sr and the integrated 12CO(21) intensity from above we get . Thus, at the position of the continuum peak.
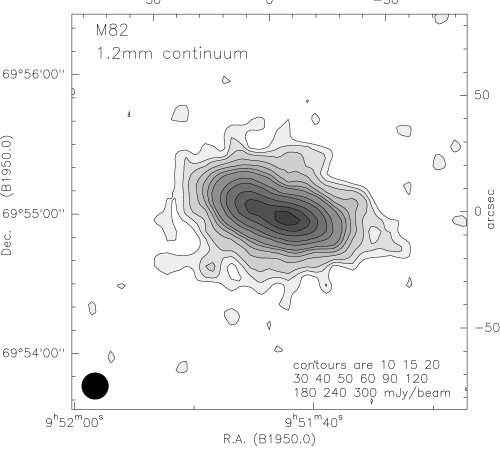
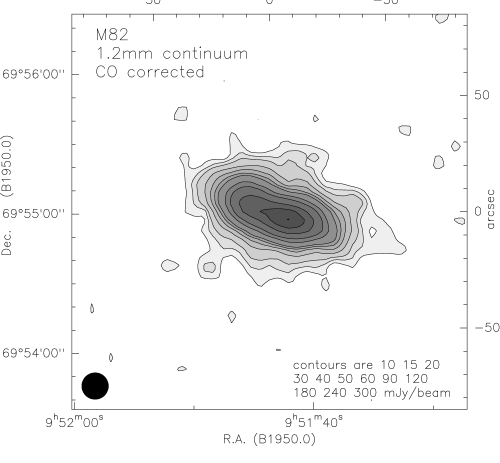
If we assume that this value holds for the whole galaxy, which of course is a simplification, we can obtain a CO–corrected continuum map by subtracting the appropriately scaled CO map from our continuum map. The uncorrected and the corrected map are shown in Fig. 1.
3 Results
3.1 Overall distribution of the dust emission
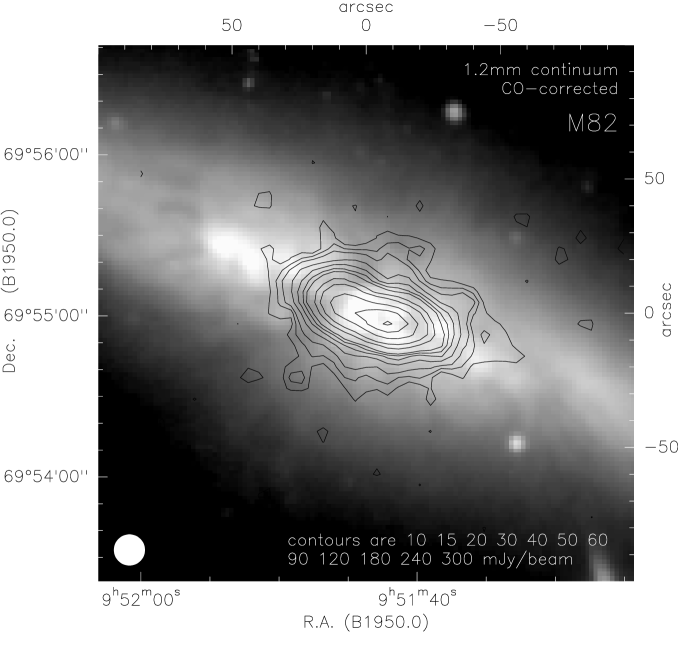
Fig. 2 shows the CO-corrected continuum map of M 82 at 1.2 mm, superimposed onto an optical image. At 1.2 mm M 82 has a more or less oval shape (ellipticity e 0.6), with the major axis parallel to the galactic plane (molecular gas). This corresponds to a position angle of approximately 70∘. The maximum of the continuum emission is located at , ∘54′55′′. Within the errors this position is identical to the peaks of the distributions at 800 m and 1.1 mm (Hughes et al. 1990). Besides this regular shape there are some spur–like features extending above and below the galactic plane, which might be associated with the outflow seen at optical and IR wavelengths.
3.2 Major– and minor–axis profiles


The contours in Fig. 2 indicate some extended emission also along the minor axis of the galaxy, but at first glance the extent in this direction is not as large as suggested by the maps of Kuno & Matsuo (1997) and Alton et al. (1999). We have therefore computed the intensity as a function of distance from the galactic center along the minor (major) axis, averaging over some 30′′ in the major-axis (minor-axis) direction. These profiles are displayed in Fig. 3. For comparison the 12CO(21) line intensity, the 850 m (Alton et al. 1999) and 20 cm continuum profiles are shown, too.
The 1.2 mm emission shows the most concentrated distribution, significantly smaller than that at 850 m. Especially the scale height along the minor axis is very small with respect to the other wavelengths and the molecular emission.
Contrary to the expectation the molecular emission is the most extended component. Possible explanations for this phenomenon are discussed in Sect. 4.2.
3.3 Integrated flux density
| /GHz | Sν/Jy | Ref. |
|---|---|---|
| 0.038 | 233 | Kellermann et al. 1969 |
| 0.178 | 15.30.7 | Kellermann et al. 1969 |
| 0.75 | 10.70.5 | Kellermann et al. 1969 |
| 1 | 8.60.4 | Kellermann et al. 1969 |
| 1.415 | 8.20.4 | Hummel 1980 |
| 2.695 | 5.70.3 | Kellermann et al. 1969 |
| 4.75 | 3.30.1 | Klein et al. 1988 |
| 5 | 3.90.2 | Kellermann et al. 1969 |
| 10.63 | 2.30.08 | Doherty et al. 1969 |
| 10.7 | 2.250.06 | Klein et al. 1988 |
| 14.7 | 1.790.04 | Klein et al. 1988 |
| 22.8 | 1.360.07 | Kronberg et al. 1979 |
| 24.5 | 1.190.03 | Klein et al. 1988 |
| 31 | 0.960.05 | Kellermann et al. 1971 |
| 33.3 | 1.00.2 | Klein et al. 1988 |
| 86 | 0.60.1 | Kellermann et al. 1971 |
| 92 | 0.70.1 | Seaquist et al. 1996 |
| 92 | 0.590.09 | Carlstrom & Kronberg 1991 |
| 110 | 0.550.05 | Neininger et al. 1998 |
| 115 | 1.70.5 | Kuno & Matsuo 1997 |
| 230 | 2.10.2 | Krügel et al. 1990a |
| 230 | 1.910.13 | this paper |
| 273 | 2.40.4 | Hughes et al. 1990 |
| 300 | 2.70.7 | Elias et al. 1978 |
| 375 | 4.90.7 | Hughes et al. 1990 |
| 667 | 416 | Hughes et al. 1994 |
| 667 | 4921 | Smith et al. 1990 |
| 750 | 3010 | Jaffe et al. 1984 |
| 2130 | 63024 | Telesco & Harper 1980 |
| 3000 | 1400690 | Harper & Low 1973 |
| 3000 | 1350200 | Rice et al. 1988 |
| 3850 | 125534 | Telesco & Harper 1980 |
| 4615 | 2800220 | Harper & Low 1973 |
| 5000 | 1270190 | Rice et al. 1988 |
| 5170 | 106644 | Telesco & Harper 1980 |
| 6383 | 1400690 | Harper & Low 1973 |
| 7320 | 63551 | Telesco & Harper 1980 |
| 12000 | 28543 | Rice et al. 1988 |
| 14286 | 1208 | Rieke & Low 1972 |
| 25000 | 6710 | Rice et al. 1988 |
| 28571 | 2727 | Rieke & Low 1972 |
| 60000 | 8.41.5 | Rieke & Low 1972 |
| 136364 | 2.50.1 | Rieke & Low 1972 |
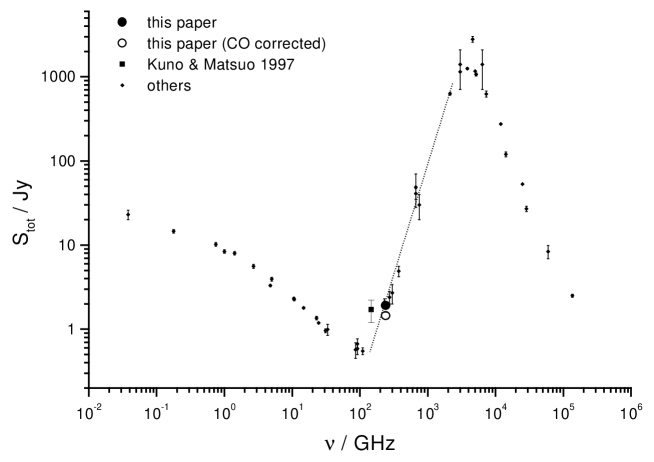
Integrating over the continuum map we obtain a total flux density of S Jy. This is lower than the value measured by Krügel et al. (1990a), but their flux density was much more uncertain, owing to the lower sensitivity of their 1-channel bolometer.
Fig. 4 shows a radio-to-IR spectrum of M 82 with the individual values listed in Tab. 1. Our new 240 GHz measurement is completely consistent with the slope of the spectrum at this frequency (indicated by the dotted line), whereas the value derived by Kuno & Matsuo (1997) at 157 GHz lies much too high with respect to all adjacent data points.
The CO–corrected flux density is significantly lower than the flux density in our original map. This demonstrates that a line correction for continuum measurements in the relevant bands is indispensible.
The total flux can be turned into a gas mass via
With a distance of D = 3.25 Mpc, and using the same parameters as Krügel et al. (1990a), i.e. a dust temperature of Td = 30 K (Chini et al. 1989) and a dust absorption coefficient (Krügel et al. 1990b), we derive a gas mass of . If we adopted the Draine & Lee value (Draine & Lee 1984) the resulting gas mass would be somewhat lower ().
In this calculation we assumed a gas-to-dust ratio of approximately Mg/M. The corresponding dust mass is M.
4 Discussion
4.1 A dust halo?
The 2 mm map (Kuno & Matsuo 1997) shows continuum emission with a box–like shape, indicating a dust halo around M 82. Although the emission at 1.2 mm and 2 mm should be similar, we do not see any /*-evidence for a significant halo contribution to the cold dust. This difference could be due to the error beam of the Nobeyama 45-m telescope.
Effects of the error beam and the antenna pattern have been investigated and largely removed from our map (see Sect. 2.3), while this is not mentioned in case of the Nobeyama measurements. The total flux density in the Nobeyama map is 1.7 Jy, which is much more than expected at this wavelength (see Fig. 4). This extra flux might be due to emission entering through sidelobes and the error beam.
The 850 m map made by Alton et al. (1999) with the JCMT shows continuum emission at the 50 mJy level up to 40′′ above the galactic plane. This translates to 15 mJy at 1.2 mm, corresponding to the second contour (3) in our map. Considering only the overall extent of the emission, the JCMT map is consistent with ours. The different shapes might be due to problems with the baseline subtraction, because the area mapped by Alton et al. is only slightly larger than the extent of the continuum emission.
4.2 Comparison of dust and CO
In non–active galaxies like NGC 4565 (Neininger et al. 1996) and NGC 5907 (Dumke et al. 1997) the molecular line emission is more concentrated towards the central region than the thermal dust emission. As can be seen from Fig. 3 and 5 the galaxy M 82 exhibits the opposite behaviour. The CO emission appears to be much more extended than the continuum. Since the maps in Fig. 5 are made with the same telescope at the same frequency, the difference can not be due to different beam patterns and error beams.
The dust is heated by the UV radiation field, which is concentrated towards the dense central region, because the UV photons can hardly escape without being absorbed. Only a small fraction of the UV photons makes its way out to kpc distances from the galactic plane, where it might contribute to the observed polarized radiation.
The molecular gas can be excited by the radiation field, but also by low–energy cosmic rays and by soft X–ray photons (see e.g. Glassgold & Langer 1973), which have a much larger scale height than the UV photons (Shopbell & Bland-Hawthorn 1998).
Fig. 3 shows that the synchrotron intensity at 20 cm drops faster with distance from the galaxy plane than the CO and even the dust emission. However, at low radio frequencies there may be a significant radio halo (low–energy cosmic rays have longer lifetimes), which is already indicated by the 327–MHz map of Reuter et al. (1992). Hence, there may be abundant cosmic rays for heating. Such cosmic rays (E 100 MeV) remain, however, invisible in the radio window, since even in the strong (G) magnetic field of M 82 they produce synchrotron radiation at frequencies below about 10 MHz. Soft X–rays are also seen far out of the plane of M 82 (e.g. Bregman et al. 1995). These circumstances altogether provide the likely heating sources for any molecular material transported out of the disk of M 82 into the halo, rendering the CO ”overluminous”. This is also indicated by the low conversion ratio of CO line intensity to molecular gas column density, X derived by Smith et al. (1991). The existence of a soft X–ray and a low–frequency radio halo around M 82 readily explains the larger extent of the CO emission as compared to the cold dust.

5 Summary
In this paper we presented a new high–sensitivity map of the continuum emission at 1.2 mm in the starburst galaxy M 82. To get a reliable map of the extended thermal dust emission we applied a CLEAN algorithm to our map (error beam correction) and subsequently subtracted the 12CO(2-1) line emission. Besides this the contribution of the sidelobes of the IRAM 30-m telescope has been estimated.
The total mass of dust in the inner 3 kpc of the galaxy derived from the integrated 1.2 mm flux density is M⊙, the inferred total mass of gas is M⊙ .
Although the continuum emission is not confined to the galactic disk, our map rules out the existence of any pronounced halo of cold dust around M 82. We find the CO(21) line emission to be clearly more extended than the 1.2 mm dust emission. This unexpected observational result now waits for a conclusive theoretical explanation.
Acknowledgements.
We thank Dr. A. Sievers from IRAM (Granada) for his support with additional calibration. We are very grateful to Dr. P.B. Alton for making his JCMT data available to us.References
- (1) Alton P.B., Davies J.I., Bianchi S., 1999 A&A 343, 51
- (2) Bingham R.G., McMullan D., Pallister W.S. et al., 1976, Nat 259, 463
- (3) Bland J., Tully R.B., 1988, Nat 334, 43
- (4) Bregman J.N., Schulman E., Tomisaka K., 1995, ApJ 439, 155
- (5) Carlstrom J.E., Kronberg P.P., 1991, ApJ 366, 422
- (6) Chini R., Krügel E., Kreysa E., Gemünd H.-P., 1989, A&A 216, L5
- (7) Devine D., Bally J., 1999, ApJ 510, 197
- (8) Doherty L.H., MacLeod J.M., Purton C.R., 1969, AJ 74, 827
- (9) Draine B.T., Lee H.M., 1984, ApJ 285, 89
- (10) Dumke M., Braine J., Krause M. et al., 1997, A&A 325, 124
- (11) Elias J.H., Ennis D.J., Gezari D.Y. et al., 1978, ApJ 220, 25
- (12) Emerson D. T., Klein U., Haslam C.G.T., 1979, A&A 76, 92
- (13) Fabbiano G., 1988, ApJ 330, 672
- (14) Glassgold, A.E., Langer, W.D., 1973, ApJ 186, 859
- (15) Harper D.A. Jr., Low R.J., 1973, ApJ 182, L89
- (16) Hughes D.H., Gear W.K., Robson E.I., 1990, MNRAS 244, 759
- (17) Hughes D.H., Gear W.K., Robson E.I., 1994, MNRAS 270, 641
- (18) Hummel E., 1980, A&AS 41, 151
- (19) Jaffe D.T., Becklin E.E., Hildebrand R.H., 1984, ApJ 285, L31
- (20) Joy M., Lester D.F., Harvey P.M., 1987, ApJ 319, 314
- (21) Jura M., Hobbs R.W., Maran S.P., 1978, AJ 83, 153
- (22) Kellermann K.I., Pauliny-Toth I.I.K., 1971, Ap. Letters 8, 153
- (23) Kellermann K.I., Pauliny-Toth I.I.K., Williams P.J.S., 1969, ApJ 157, 1
- (24) Klein U., Mack K.-H., 1995, in ”Multi-feed Systems for Radio Telescopes, ed. D.T. Emerson, ASP Conf. Ser., p. 318
- (25) Klein U., Wielebinski R., Morsi H.W., 1988, A&A 190, 41
- (26) Kreysa E., Haller E.E., Gemünd H.-P. et al., 1993, Conf. Proc. of Fourth Int. Symp. on Space Terahertz Technology, UCLA, Los Angeles
- (27) Kronberg P.P., Emerson D.T., Klein U., Wielebinski R., 1979, ApJ 230, L149
- (28) Krügel E., Chini R., Klein U. et al., 1990a, A&A 240, 232
- (29) Krügel E., Steppe H., Chini R., 1990b, A&A 229, 17
- (30) Kuno N., Matsuo H., 1997, PASJ 49, 265
- (31) Lynds C.R., Sandage A.R., 1963, ApJ 137, 1005
- (32) McCarthy P.J., Heckman T., van Breugel W., 1987, AJ 93, 264
- (33) McKeith C.D., Greve A., Downes D., Prada F., 1995, A&A 293, 703
- (34) Nakai N., Hayashi M., Handa T. et al., 1986, PASJ 38, 603
- (35) Nakai N., Hayashi M., Handa T. et al., 1987, PASJ 39, 685
- (36) Neininger N., Beck R., Backes F., 1990, in R.Beck et al. (eds.) ”Galactic and Intergalactic Magnetic Fields”, IAU Symp. 140, p. 253
- (37) Neininger N., Guélin M., Klein U. et al., 1996, A&A 310, 725
- (38) Neininger N., Guélin M., Klein U., García-Burillo S., Wielebinski R., 1998, A&A 339, 737
- (39) Notni P., Tiersch H., Bronkalla 1981, Astron. Nachr. 4, 157
- (40) Reuter H.–P., Klein U., Lesch H., Wielebinski R., Kronberg P.P., 1992, A&A 256, 10
- (41) Reuter H.–P., Klein U., Lesch H., Wielebinski R., Kronberg P.P., 1994, A&A 282, 724
- (42) Rice W., Lonsdale C.J., Soifer B.T. et al., 1988, ApJS 68, 91
- (43) Rieke G.H., Low R.J., 1972, ApJ 176, L95
- (44) Schaaf R., Pietsch W., Biermann P. L., Kronberg P. P., Schmutzler T. 1989, ApJ 336, 722
- (45) Seaquist E.R., Odegard N., 1991, ApJ 369, 320
- (46) Seaquist E.R., Carlstrom J.E., Bryant P.M., Bell M.B., 1996, ApJ 465, 691
- (47) Shopbell P.L., Bland-Hawthorn J., 1998, ApJ 493, 129
- (48) Smith P.A., Brand P.W.J.L., Puxley P.J., Mountain C.M., Nakai N., 1990, MNRAS 243, 97
- (49) Smith P.A., Brand P.W.J.L., Mountain C.M., Puxley P.J., Nakai N., 1991, MNRAS 252, 6
- (50) Sofue Y., Reuter H.–P., Krause M., Wielebinski R., Nakai N., 1992, ApJ 395, 126
- (51) Stark A.A., Carlson E.R., 1984, ApJ 279, 122
- (52) Telesco C.M., Harper D.A., 1980, ApJ 235, 392
- (53) Thronson H.A., Walker C.K., Walker C.E., Maloney P., 1989, A&A 214, 29
- (54) Watson M.G., Stanger V., Griffiths R.E., 1984, ApJ 286, 144
- (55) Yun M.S., Ho P.T.P., Lo K.Y., 1994, Nat 372, 530