email: agata@camk.edu.pl
Vertical structure of the accreting two-temperature corona and the transition to an ADAF
Abstract
We investigate the model of the disc/corona accretion flow around the black hole. Hot accreting advective corona is described by the two-temperature plasma in pressure equilibrium with the cold disk. Corona is powered by accretion but it also exchanges energy with the disk through the radiative interaction and conduction. The model, parameterized by the total (i.e. disk plus corona) accretion rate, and the viscosity parameter, , uniquely determines the fraction of energy released in the corona as a function of radius and, in particular, the transition radius to the single-phase flow.
Self-consistent solutions with the mass exchange between phases display radial dependence of the parameters qualitatively different from the ’static’ case, without the mass exchange. Corona covers the entire disk. The character of the radial dependence of the fraction of energy dissipated in the corona is qualitatively different for low and high total accretion rate.
If the total accretion rate is low, the corona becomes stronger towards the central object, and finally the disc completely evaporates, changing the accretion pattern into the single hot advection-dominated accretion flow (ADAF). For intermediate accretion rates the reverse process - condensation - becomes important, allowing possibly for a secondary disc rebuilding in the innermost part of the system. High accretion rates always prevent the transition into ADAF, and the cold disk extends down to the marginally stable orbit.
The transition radius, , between the outer, two-phase flow and the inner, single-phase, optically thin flow, is equal to for and then contracts to the marginally stable orbit in a discontinuous way above this critical value of ..
This model reproduces all characteristic luminosity states of accretion black hole without any additional ad hoc assumptions. In particular. the mechanism of the disk evaporation leads to a new, almost horizontal branch on the accretion flow’s stability curve (i.e. the dependence of accretion rate on surface density) at the critical accretion rate. This branch, together with the upper, advection dominated branch for optically thick disks, form boundaries for the time evolution of unstable, radiation pressure dominated disk. Therefore the disk at high accretion rates, corresponding to Very High State in GBH and perhaps to Narrow Line Seyfert 1, and quasar stage may oscillate between the disk dominated state and the evaporation branch state, with only a weak contribution from the cold disk emission. The position of this branch for with respect to the gas pressure dominated branch is consistent with the presence of only weakly variable High State in GBH and the absence of a similar state in AGN: all the quasars vary considerably if monitored in timescales of years. We also suggest a new interpretation of the Intermediate State, consistent with the presence of the strong reflected component.
Key Words.:
Radiative transfer, Accretion disks, Galaxies:active, Galaxies:Seyfert, X-ray:stars, X-rays:galaxies1 Introduction
There are strong observational evidence for the existence of the hot plasma K in the neighborhood of the accretion disc in active galactic nuclei (AGN) and galactic black holes (GBH). Soft disc photons are Compton upscattered by this optically thin plasma and form an approximately power law hard X-ray spectral component. The presence of the Compton reflection hump and the cold iron line in the hard spectrum is a signature of strong illumination of cold disc matter by X-ray radiation (for a review see Mushotzky, Done & Pounds 1993, Tanaka & Lewin 1995, Madejski 1999).
The location of the hot plasma is still under debate, but one of the attractive models postulated by Liang & Price (1977) and Paczyński (1978) introduces hot dissipative corona above accretion disc following the example of the solar corona. via magnetohydrodynamic waves, jets or other nonthermal energy transport, and then thermalized in corona. But such ways of energy transport occurred to be inefficient, only of energy generated in the disc can be carried out towards corona. Within the frame of such geometry, observations seem to require that in some sources and/or some spectral states the innermost part of the disk is either disrupted and replaced by an optically thin flow or there is a strong coronal outflow (e.g. Esin, McClintock & Narayan 1997, Zdziarski, Lubiński & Smith 1999, Beloborodov 1999). Therefore, it is important to determine whether any of such effects are expected on the basis of the physical description of the accretion flow (Narayan 1997).
The disc/corona models were recently investigated following two basic lines.
The first group of models does not explain the mechanism which heats up the plasma in the disk/corona part of the flow. The fraction of energy generated in the corona is treated as a free parameter of the model (Haardt & Maraschi 1991, Svensson & Zdziarski 1994) or changes according to the artificial formula being inversely proportional to the distance form a central object (Esin et al. 1997). By changing and the geometrical shape of the hot region (continuous, patchy or clumpy corona), such models can be fitted to the observed X-ray spectra (for review see Pountanen 1999). The main conclusion from those models is that static corona agrees with observations only when it does not cover the whole disc. However, more accurate considerations of the reflection, taking into account the optical depth of the Compton heated zone (Różańska & Czerny 1996, Nayakshin, Kazanas & Kallman 1999) or an outflow (Beloborodov 1999) may influence this result to some extent.
The second group of models follow Shapiro, Lightman & Eardley (1976) solution when hot optically thin flow exists in the inner part of the cold disc. They assume both cold and hot flow to be driven via accretion and depending on the model they take into account mechanical energy transport in the radial direction: like advection (Ichimaru 1977; Narayan & Yi 1994, 1995a, 1995b; Abramowicz et al. 1995; Chen et al. 1995; for review see Narayan, Mahadevan & Quataert 1998 and Kato, Fukue & Mineshige 1998), turbulent diffusion (Honma 1996), hydrodynamical inflow/outflow (Narayan & Yi 1994, 1995a; Blandford & Begelman 1999) and/or in the vertical direction: thermal conduction, evaporation or coronal wind (Meyer & Meyer-Hofmeister 1994 hereafter MMH94, Meyer-Hofmeister & Meyer 1999 Liu et. al 1999, Turolla & Dullemond 2000).
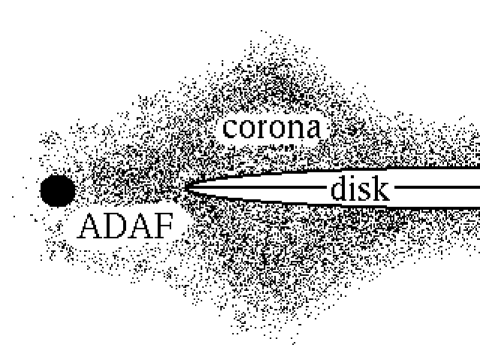
In both groups of models the crucial thing is the transition between the hot and the cold phase. In general picture such a transition occurs in two directions: vertical transition when corona accretes above a cold disc, and radial transition when disk/corona system is replaced with a single optically thin flow close to the black hole (Fig. 1). Therefore, as was pointed by MMH94, in general picture both radial and vertical structure of the hot and cold phase should be considered.
In this paper we present the simplest disc/corona model which is the combination of two groups of models described above. The similar model was presented by Esin et al. (1997) with better description of ADAF region, and with non-local radiative interaction between the hot flow and cold disc. Nevertheless, they were not able to determine self consistently the transition between disc/corona flow, since they did not calculate its vertical structure. Also MMH94 stressed that thermal conduction and mass exchange between disc and corona in vertical direction are important do determine the transition. However, in their model (Meyer-Hofmeister & Meyer 1999 Liu et. al 1999) the radiative interaction between phases was neglected, an assumption of a single-temperature plasma was used, and the conductive flux on the bottom of the hot phase was artificially taken from the solar corona.
Our model takes into account radiative coupling between phases, thermal conduction and evaporation in vertical direction, and radial energy transport via advection. The mass exchange rate is calculated self-consistently from the physical conditions in the transition zone. Hot corona is treated as two temperature plasma and, similarly to the disc, it is powered by accretion (Witt, Czerny & Życki 1997; hereafter WCŻ97, Esin et al. 1997).
On each radius the vertical structure is calculated depending on comparison of accretion and vertical evaporation timescales. When accretion time scale is long enough, the mass exchange can be neglected and the ’static’ equilibrium is achieved. In such a case, for vertical transition we use the condition based on considerations of Krolik (1998), Dullemond (1999), and Różańska & Czerny (2000) which is relevant to the dissipative corona. When accretion time scale is short mass exchange cannot be neglected, and we determine the evaporation rate through the disc/corona transition.
Vertical properties are used to compute the radial trends solving continuity equation. The aim of this paper is to determine the radial dependence of the fraction of energy liberated in the corona for a given accretion rate, viscosity and a mass of the black hole and to check when the disk evaporation leads to a transition from disc/corona flow to the single optically thin flow. The radial transition occurs at the radius when all the mass starts to be carried by the corona.
Observational consequences of our model occur in the dependence of the transition radius on accretion rate, which can be seen in different shapes of the reflected component (Done & Życki 1999). Also the evaporation leads to the new stable branch on the accretion flow’s stability curve ( i.e. ), allowing for new evolution cycle to exist. If accretion rate is too low optically thick disk can evaporate completely in the innermost parts and the position of transition radius moves outward. This can explain the different luminosity states in AGNs and GBHs
2 Model
The basic problem in modeling the two-phase accretion flow onto a black hole is the determination of the relative importance of the hot optically thin flow and cold optically thick flow. It was shown by MMH94 in the case of dwarf novae that such estimates have to be based on the study of the vertical structure of such a flow since only in that case we can determine the mass exchange between the phases and the conditions of their coexistence. Therefore we follow this basic approach but we adjust the physical input to the conditions appropriate for the accretion close to the black hole.
The main difference from a dwarf novae is that in the case of inner regions of the accretion disc in AGNs and GBH, two-temperature plasma should be taken into account (Narayan & Yi 1995b). This is easy to see from the following simple argument. With the assumption of local viscous heating of ions, the total flux generated locally in the standard disk is:
| (1) |
where is the Keplerian angular frequency equal to , is the viscosity, is the height scale of the flow and P is the pressure.
On the other hand, the total flux dissipated locally in a stationary Keplerian disk can be described as:
| (2) |
where represent the inner boundary condition, in our case taken from the Newtonian approximation, .
The optical depth of the flow can be described by , where is the opacity coefficient for electron scattering and is the density. We use also following equation of state: , with the value of molecular weight for cosmic chemical composition. Boltzmann constant is denoted as and the mass of hydrogen atom as .
Combining these equations, we can estimate the temperature of the optically thin flow as:
| (3) |
We use accretion rate in units of Eddington accretion rate described as:
| (4) |
with accretion efficiency . Thus the temperature does not depend on the mass of the black hole , and can be computed for assumed value of Eddington accretion rate, radius and viscosity. Taking a realistic value , and the distance appropriate for dwarf nowae which is we obtain the temperature equal to K, reasonable for the single temperature plasma. But, for , the temperature attains the value of K, far too high for electrons, according to the observational data, and two-temperature plasma should be considered.
2.1 Basic assumptions and model parameters
In the present paper we consider the case of stationary accretion onto a non-rotating black hole. We assume that accreting material forms an optically thick disk underlying an optically thin hotter skin - a corona. The flow is described as a continuous medium so a possible clumpiness of either the disk or the corona are neglected. The transition of the flow in the vertical direction from a corona to a disk is gradual and corresponds to a change of the cooling mechanism with an increasing density and pressure towards the equatorial plane. Since the computations of the optically thick part of the flow required another approach than the optically thin parts we still introduce a formal division of the flow into a disk and the corona but the physical parameters at the bottom of the corona (pressure, density and temperature) are equal to the disk values so there is no discontinuity between the two media.
We assume that both the disk and the corona are powered directly by the release of the gravitational energy due to accretion. Viscous torque is parameterized as in the standard disk of Shakura & Sunyaev (1973). This approach is supported to some extent by the magnetohydrodynamical simulations of Hawley, Gammi & Balbus (1996). Such assumption was used e.g. by MMH94 and WCŻ97. Since the corona is accreting we assume the direct heating of ions and the subsequent energy transfer to electrons through the Coulomb coupling. Therefore, the corona is basically a two-temperature medium unless the Coulomb coupling is efficient enough to equalize the temperatures. This assumption is a simple, well determined starting point but in the future the ion-electron energy exchange should be considered more closely. Proton heated plasma, adopted in our paper, is hardly thermalised (Gruzinov & Quataert 1999). Spruit & Haardt (2000), motivated by large mean free path of ions considered the disk heating not as conduction due to electrons, but conduction due to the ions. Another point is that protons are heated efficiently only in the case of a weakly magnetized plasma; in a plasma with field in equipartition heat goes to electrons (Quataert & Gruzinov 1999). Also Ohmic heating stressed by Bisnovatyi-Kogan & Lovelace (1997) can efficiently heat up the electrons and advection may be not important. Diminishing the role of advection may have further consequences for the efficiency of mass exchange between the disk and the corona (Różańska & Czerny 2000).
We take into account the radial advection, Compton and bremsstrahlung cooling and the conduction due to electrons and the vertical mass exchange, which are important at the basis of the corona. Disk and corona are radiatively coupled, as in the classical paper of Haart & Maraschi (1991) although the cooling process is now treated locally. We assume that, the cold disc is the origin of the seed photons at a given radius. We neglect the contribution of the synchrotron radiation to the seed photons for Comptonization (Narayan & Yi 1994), as well as non-local photons which were included in the study of Esin et al. (1997). We also neglect the formation of wind at the top of corona discussed in some papers (e.g. Begelman, McKee & Shields 1983, Begelman & Blandford 1999).
In flows cooled by advection, the motion may be not Keplerian and proper calculation of equation of motion should be done to describe this effect. Nevertheless, the aim of this paper is to calculate properly the vertical structure while the radial one is computed less carefully. Therefore, together with hydrostatic equilibrium in vertical direction, we assume the Keplerian motion of the material.
The model parameters are: mass of the black hole, , accretion rate, , and the viscosity parameter , assumed here for simplicity to be the same both in the disk and in the corona. All other quantities, including their radial dependences, are uniquely determined by those global parameters for a stationary flow. Corona model does not actually depend on but there is a weak dependence of the cold disk properties on the mass of the black hole itself so this parameter cannot be entirely neglected.
2.2 Vertical structure of the corona at a given radius
In the present study we simplify the problem of hydrostatic equilibrium. Instead of solving complex differential equations as in MMH94, we simply study algebraic dependences of various quantities on the pressure which is a monotonic function of the distance from equatorial plane. With such assumption the local viscous heating of ions can be described following the Eq. 1:
| (5) |
A fraction of this energy is carried by advection. This fraction is proportional to the ratio of the ion temperature to the virial temperature with the coefficient determined by the radial derivatives of thermodynamical quantities (e.g. Ichimaru 1977, Muchotrzeb & Paczyński 1982, Abramowicz et al. 1995, Janiuk, Życki & Czerny 2000). At present we simply assume but in principle this value should be determined iteratively.
Remaining fraction of energy is transfered to electrons via Coulomb coupling
| (6) |
where is the electron temperature, and D is the Coulomb coupling constant equal (in s-1). At this exploratory stage, we neglect relativistic corrections to this equation given by Stepney & Guilbert (1983).
In the upper layers of the corona the electrons cool down radiatively, i.e.
| (7) |
The processes included are the Compton cooling due to the presence of soft photons from the disk and through the bremsstrahlung cooling
| (8) |
Here is the soft radiation flux coming from the disk due to the energy generation in the optically thick part of the flow as well as due to interception and reemission of the coronal emission (Haardt & Maraschi 1991)
| (9) |
- mass of the electron, - light velocity, and - bremsstrahlung cooling constant equal erg s-1cm-2 g-2. We assume that half of the coronal flux , illuminates the disc and all of this is absorbed and subsequently reemited, so albedo is equal to zero.
In Eq. 8 we include only the Compton cooling and we neglect, for simplicity, the Compton heating term which may be important within the transition zone where the electron temperature drops below K.
Equations 6 and 8 determine the temperature profile in the upper part of the corona, or more precisely, the dependence of the ion and electron temperature on the gas pressure which we identify with the ion pressure for simplicity, .
At some depth, however, a transition to a cool disk is expected. Within such a transition zone the essential role is played by conduction, neglected so far. Here we assume that the transition from hot to cold gas happens very sharply, under the constant pressure, , so the drop in the temperature is simply compensated by the increase in the density. Determination of this pressure is the key element of the model since the value of this pressure uniquely determines the fraction of the energy liberated in the corona in the following way.
Since the ion temperature is close to the virial temperature, the pressure scale high is roughly of the order of the radius, , so instead of solving precisely the hydrostatic equilibrium we can estimate the total energy flux generated in the corona as
| (10) |
and the flux emitted by corona as
| (11) |
The total energy dissipated due to accretion both in the disk and the corona is given by formula:
| (12) |
which relates to the accretion rate both within the disk and the corona due to the assumption of stationarity and Keplerian motion and given by Eq. 2.
In the accreting corona model, the fraction of energy dissipated in the corona corresponds to the same fraction of the mass accreting through the hot phase, i.e.
| (13) |
In this way the determination of the pressure at the basis of the corona allows to determine its structure at a given radius from the global model parameters, , , and . Therefore the way how we determine this value is a crucial element of the model itself which removes arbitrariness from the disk/corona accretion flow present in most models apart from MMH94, Życki, Collin-Souffrin & Czerny (1995), WCŻ97 and the directly related papers.
The computations of the vertical structure of the optically thick part of the flow are not necessary for the computation of the corona. However, when the corona structure is determined the disk structure is calculated, with the boundary conditions imposed by the presence of corona, as described by Różańska et al. (1999). No iterations between the disk and the corona computations are needed.
The properties of the transition zone are calculated following the approach of Krolik (1998), Dullemond (1999), and Różańska & Czerny (2000). We consider two cases: a ’static’ balance solution without the mass exchange between the disk and the corona and the self-consistent case based on the continuity equation of the coronal flow.
2.2.1 Equilibrium solutions without mass exchange
Interesting and important solutions are obtained under an assumption that the accretion flow is slow in comparison with the timescale of exchange of the mass between the disk and the corona. In that case the equilibrium solution is defined by the condition that there is no mass exchange between the disk and the corona (see Różańska & Czerny 2000).
To describe the equilibrium solution we integrate the energy balance equation as shown in Appendix A, with velocity in vertical direction equal zero (see Eq. 34). It meant, that the heat flux which is transported via electrons from hot upper corona towards the cold matter is balanced by radiative cooling operating in the disc. Since the transition is described under constant pressure the appropriate criterion reduces to an integral (Różańska & Czerny 2000)
| (14) |
where is the cold disk temperature and is the electron temperature within the upper corona part determined at the pressure P and satisfying the heating/cooling balance formulated by Equation 7. Here, is thermal conductivity coefficient in and conductivity constant is assumed to be equal . The ion temperature in this equation has to be determined from the Coulomb coupling equation (Eq. 6) and the density from the value of the (constant) pressure and the ion temperature.
Equation 14 determines the pressure of the transition zone, thus closing up the set of equations determining the disk/corona flow.
2.2.2 Solutions with evaporation/condensation
The mass exchange between the disk and the corona cannot be neglected if the timescale of accretion is short so the ’static’ type of equilibrium cannot develop. It is also necessary if we want to describe the process of corona formation. This approach is more appropriate but more complex since it is essentially non-local and requires a global solution for all radii. Here we basically follow an approach of MMH94 by finding a family of numerical solutions at a single radii, determining their scaling properties with the radius and finally finding unique global solution at the basis of this scaling.
Therefore we allow the Equation 14 to be not satisfied which means that we have to solve the vertical energy transfer in the transition zone allowing for evaporation or condensation, depending on the choice of the pressure . If radiative processes are to low to balance the heat flux, the disc will evaporate as shown by Dullemond (1999). However, radiative cooling may overwhelm the heat flux if pressure at the base is high enough (higher than the pressure under which mass exchange equals to zero, as shown by McKee & Begelman in 1990), and in such situation matter will condense.
To determine the mass exchange rate we integrate the energy balance equation (32) in the way detaily presented in Appendix A. Combining equations (35) and (38) the evaporation rate across the disk/corona boundary is given by the formula.
| (15) |
The sign of this quantity is either positive (disk material evaporates into the corona) or negative (coronal material condensates into the disk), depending on the net effect of the electron heating and cooling balance.
The radial dependence of is subsequently determined from the continuity equation (see Section 2.3.2).
2.3 Radial component of the continuity equation and global solutions
2.3.1 Solutions without mass exchange
In this case the equilibrium is built locally so the determination of the disk/corona structure at a given radius is completed if the local solution at this radius is found. The accretion rate within the corona is determined at each radius separately and the mass exchange between the disk and the corona account for its dependence on the disk radius, i.e. its evolution with the flow. All parameters, like accretion rate in the corona, soft X-ray flux from the disk, the ion and electron temperature profile, the density profile and the corona optical depth as well as the pressure at the basis of the corona where the temperature drops down to match the disk values are determined by the choice of the radius and the three global model parameters, , and .
2.3.2 Solutions with evaporation/condensation
If the timescale of building the evaporation/condensation equilibrium is long in comparison with the viscous timescale in the corona we have to describe the build-up process of the corona, i.e. the accretion rate in the corona at any radius will reflect the amount of material which evaporated from the disk at all radii larger and equal to .
The change of the accretion rate in the corona is therefore due to the mass exchange with the disk
| (16) |
which in dimensionless units reduces to
| (17) |
where and .
In order to solve this equation we follow the approach of MMH94. We find a family of solutions at a given radii for a set of values of the pressure . We express those solutions through the computed , thus obtaining a numerical relation . We study the scaling of this relation with radius, thus finding an analytical expression valid in the entire disk. This analytical expression is supplied to Equation 17 and the final analytical result for the dependence is found.
2.4 Cold disk structure
Determination of the corona properties, i.e. the fraction of energy dissipated in the corona and the pressure at the corona basis provides the boundary conditions necessary to calculate the vertical structure of the cold disk flow (e.g. Rȯżańska et al. 1999). Therefore, the description of the hot flow influences the properties of the cold part of the flow to their strong coupling through these boundary conditions.
In the present paper we concentrate mostly on the hot flow properties and the cold disk properties are only required for the qualitative discussion of the connection between the single phase hot flow and disk/corona flow (see Section 3.3) so we simplify the description of the cold flow. We apply the vertically averaged approach but we determine the dimensionless coefficients involved in this process on the basis of full computations of the disk vertical structure, as in Janiuk et al. (2000) (see also Muchotrzeb & Paczyński 1982, Abramowicz et al. 1988).
We assume the same value of the viscosity coefficient in the hot and in the cold flow although they may in principle be considerably different due to the different plasma properties. We include advection in our description of the flow, and the appropriate coefficients used are: , and . The disk is assumed to be optically thick so the current approach does not allow yet to follow the final transition from the disk/corona flow to a single phase optically thin accretion.
3 Results
3.1 Solutions without mass exchange
3.1.1 Vertical structure of the flow at a given radius
We first discuss the vertical ion and electron temperature and density profiles at a representative radius for mass of the black hole equal and the viscosity parameter . The virial temperature corresponding to this radius is equal K.
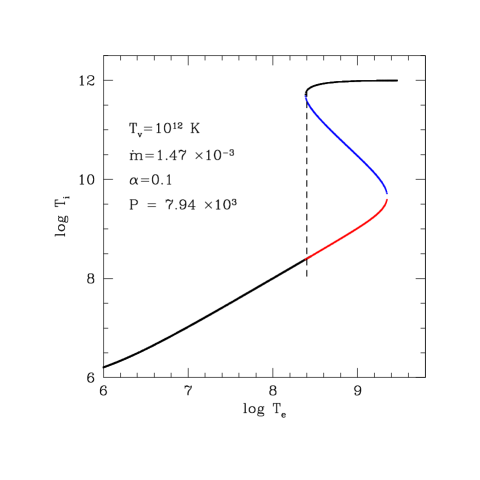
The set of algebraic equations (Eq. 2 and Eqs. 5 - 12) describing the upper layers of the corona formally posses two solutions for a given pressure (corresponding to a certain distance from the equatorial plane): one solution is mostly advection-dominated, low density branch and the other one is high density, mostly radiatively cooled branch. This property, found also by Dullemond (1999), is a direct analogy of the vertically averaged optically thin solutions found by Abramowicz et al. (1995). Both solutions exists for low values of the pressure but they approach each other and finally merge at a certain value of the pressure, corresponding to an ion temperature . Dipper inside there are no solutions, as in the case of too high accretion rate in optically thin flows.
However, the situation of the disk/corona accretion is not the same as in the case of a single phase flow. Only one of the above solutions is acceptable. At the advection-dominated branch the ion temperature decreases with the increase towards the midplane and the density increase thus opening a possibility to match this solution to the cool disk part of the flow. The other branch shows opposite trends and therefore we reject it as unphysical in the case of two-phase accretion.
The fact, that the algebraic solution does not extends very deeply does not pose a problem since we have now to take into account the transition to the disk flow under no evaporation conditions. The value of the pressure which allows the coexistence of the disk and coronal flow under no evaporation/condensation condition given by Equation 14 is always smaller than the value of the pressure at which the two solutions merge.
The example of the change of the ion and electron temperature with a pressure increasing towards the equatorial plane is shown in Fig. 2 for the accretion rate in units of Eddington accretion rate. The ion temperature is very close to the virial value, most of the heat generated in the corona is advected towards smaller radii. The electron temperature is always significantly lower than the ion temperature since the Coulomb coupling is nor very efficient but it slowly increases towards the equatorial plane (i.e. increasing ). For the assumed parameters the equilibrium pressure is equal g cm-3.
The fraction of energy generated in the corona is equal 0.89, so the soft photon flux is predominantly due to the fraction of corona emission absorbed by the disk (erg s-1cm-2). The optical depth of the corona is very low, and the density at the upper edge of the transition zone is equal g s-2 cm-1.

The transition zone itself is also complex. We assumed that the transition happens at a constant pressure so its structure cannot be shown in Fig. 2. Instead, we draw the relation between the ion and electron temperature within this zone, as predicted, neglecting thermal conduction (only for radiative processes and advection), in Fig. 3.
In the upper part of the transition zone itself the ion temperature is still very close to the virial temperature, with advection as a dominant cooling mechanism for ions. However, deeper inside the ion temperature decreases and the density increases. Radiative cooling becomes more efficient. The advection-dominated flow is replaced by the radiatively cooled flow, basically of the type studied by Shapiro, Lightman & Eardley (1976). This branch was found to be unstable (Piran 1978, Narayan & Yi 1995b) and it does not provide us with a monotonic decrease of the electron temperature so we assume that actually a sharp transition takes place along a vertical line, as marked in Fig. 3. Our integral of the difference between the heating and cooling multiplied by the conduction flux (Equation 14) is calculated applying such a profile. Full solution of differential equations with the conduction due to electrons as well as ions would produce a smooth solution matching the upper and lower branch without the third, intermediate branch. We intend to study this problem in the future but for the determination of the basis solution properties the detailed knowledge of the transition zone is not necessary as the optical depth of this zone is generally very small.
The fraction of the energy generated in the corona for an accretion rate of is high but generally this is not the case. In Fig. 4 we show the dependence of this value on the accretion rate at the radius 10 . For large accretion rates the corona is weak and its strength increases rapidly when the accretion rates drops down to . Below there are no solutions for disk/corona equilibrium without the mass exchange. Solutions with negative value of are unphysical. Those results are qualitatively very similar to the results obtained by WCŻ97 which were based on approximate description of the disk/corona equilibrium through the condition on the value of the ionization parameter (shown in Fig. 4 as a dashed line).


Since the corona is not isothermal there is no single value of the ion and electron temperature for a given radius. However, the representative values are those at the top of the transition zone, at . We plot them also as functions of the accretion rate (Figs. 5). We see that the trends are similar to those determined by WCŻ97 but there are quantitative differences. The ion temperature is always very close to the virial temperature and, at that radius, it never approaches the electron temperature. Finally, we plot the optical depth of the corona at the same radius (Fig. 6). The corona is much thinner than predicted by WCŻ97, its optical depth strongly depends on the accretion rate.

3.1.2 Radial trends
All quantities depend not only on the accretion rate but also on the disk radius. Therefore we study now the radial dependences of the coronal parameters for a representative value of the accretion rate .


There is an essential, qualitative change with respect to the results obtained by WCŻ97.
In WCŻ97 the strength of the corona increases outwards: corona is weak close the black hole while all energy is generated within the corona at a certain critical distance . Beyond this radius the disk/corona configuration does not exists. According to our new description of the disk/corona transition under no evaporation condition the solutions at radii larger than a certain also do not exists but at a radius only marginally smaller than the fraction of energy generated in the corona is not 1, but about 0.5 (Fig. 7). In a very narrow radial region below two solutions exist: one with weaker corona and the other one with strong corona, which merge at . The strong corona solution reaches the value at a radius not much lower than and the solution does not continue down to smaller radii (mathematically, it exists as unphysical solution with ). Therefore this branch of solution does not offer a global solution for the corona. On the other hand the weak corona branch continues down to the marginally stable orbit and this branch represents the solution acceptable under adopted conditions (no evaporation/condensation). The nature of this multiple branch solutions is connected with the presence of advection, as studied for the case of WCŻ97 condition of disk/corona transition by Janiuk, Życki & Czerny (2000). The advection dominated branch tends to vanish if the solution is computed more accurately by determination of the coefficient iteratively from the radial derivatives of physical quantities.
Therefore, according to our model, the corona in equilibrium with the disk covers only a finite part of the disk, its strength increases outwards but it never dissipates more than about a half of the gravitational energy available at a given radius (Fig. 8). The transition from outer part without a coronal solution to the inner part with corona is sharp if studied within the frame of solutions with no disk/corona mass exchange and the true nature of this transition can be understood only within the frame of the solutions with evaporation (see Section 3.2).

The ion temperature at the top of the transition zone is always quite close to the local virial temperature so it clearly decreases with the radius (Fig. 9). On the other hand the electron temperature at increases outwards on the basic branch, as in WCŻ97. Its value at the outer edge of the coronal solution is of the same order as predicted by WCŻ97 but closer to the central object is much cooler.

The optical depth of the corona is not constant, as in WCŻ97, but it strongly decreases inwards along the basic branch (Fig. 10). Therefore, the effect of Comptonization apart from the very outer edge of the coronal solutions is completely negligible as long as the inner disk is not evaporated (see Section 3.2). In this paper we neglect Compton heating, since the accretion is a main source of heating. However, Compton heating may increase the optical depth of the base of the corona and we plan to study this effect in a future work.
The radial trends change with the accretion rate is a way similar to that described by WCŻ97. The extension of the corona, , is large for large accretion rate and decreases with decreasing accretion rate. For accretion rates below no equilibrium solutions are obtained. Again, the nature of this phenomenon can be understood by analyzing the solutions which allow for mass exchange in the disk/corona system (see Section 3.2).
3.2 Solutions with evaporation/condensation
Construction of those solutions is more complex as the solutions have global character, i.e. the results at a given radius are coupled to those at other radii through the continuity equation for the corona (Equation 17). Since we follow semi-analytical approach to solution of Eq. 17 we first present local numerical solutions which are parameterized by the coronal accretion rate, , in addition to global parameters , and , and we give the analytical formulae approximating the relation between and .
The vertical structure of the disk/corona system with evaporation is qualitatively similar to the case without mass exchange. However, the global trends are essentially different so in this section we concentrate on those aspects of the model.


In Fig. 11 we show the dependence of the evaporation rate of the cool disk on the accretion rate in the corona at for a small value of the total accretion rate (). From Fig. 4 we see that we should not expect an equilibrium solution without evaporation so it is not surprising that the evaporation rate is positive for all values of the accretion rate within the corona from 0 to the total accretion flux.
The relation is well approximated by an analytical formula
| (18) |
Here, viscosity is described in dimensionless units: . This formula neglects the effect of condensation and it is a good approximation of the solution only for very low accretion rates . Applicability of this asymptotic expression will be qualitatively discussed at the end of this Section.
Such an analytical expression can be now conveniently used to determine the global solution by substituting it to the continuity equation 17.
The radial dependence of the coronal accretion rate and evaporation rate are therefore:
| (19) |
| (20) |
These formulae are qualitatively similar to the formulae derived by MMH94 in the case of a single-temperature plasma and no condensation condition at the basis of the corona. The fraction of mass carried by the corona increases inwards. Finally, at a certain radius all the mass is in the coronal flow due to the complete disk evaporation: (Fig. 7 long dashed line). Its value
| (21) |
is surprisingly similar to the value determined by Liu et al. (1999) on the basis of Mayer & Mayer-Hoffmeister’s results. The only essential difference is the dependence on the viscosity present in our approach but absent in theirs. This is basically the result of our different description of the conduction flux close to the disk surface and the presence of the additional step in energy transfer in the form of ion-electron coupling which results in the electron temperature much lower than the virial temperature, depending also on the viscosity.
Assuming the viscosity parameter we obtain practically the same results as Liu et al. (1999) but larger (smaller) viscosity in our case result in larger (smaller) purely ’coronal’ region. The dependence on the accretion rate is almost identical in both cases (see also Section 4.1.2).
We now proceed to the case of large accretion rate. From Fig. 4 we see that for large accretion rate at 10 there is an ’static’ equilibrium solution so generally we can expect either evaporation, or condensation, depending on the value of the accretion rate within the corona itself. Fig. 12 confirms those expectations. For extremely low values of coronal accretion rate is still well approximated by the analytical formula (Eq. 18) but a turnover appears at larger values and finally evaporation is replaced with condensation, as becomes negative.
Therefore we need to replace Equation 18 with more general formula able to represent both evaporation and condensation phenomenon.
| (22) | |||||

This formula is oversimplified as it does not take into account the non-monotonic two-value dependence of on the radius for models in equilibrium, for which (see Fig. 8). However, it reproduces accurately enough the extension of the strong condensation zone. More accurate description would require numerical computations of the vertical structure of the corona together with integration of Eq. 17.
Previously found global solution based solely on evaporation applies everywhere in the disk down to the marginally stable orbit if the second term in Eq. 22 is smaller than 1, i.e. when the total accretion rate is below the limiting value for . In objects with such a low accretion rate the corona formation proceeds monotonically, corona carry an increasing fraction of mass as the flow approaches a black hole and finally, at radius given by Eq. 21 the disk disappears, as it is replaced by an optically thin flow of ADAF type.
In objects with significantly higher accretion rate the situation is more complex than in low accretion rate case. The equations 22 and 17 have to be now solved numerically. An example is shown in Fig. 13 (thick continuous line). At the outermost part of the disk the corona formation proceeds according to Equation 19, as before. Closer in the cooling becomes more efficient and the corona formation proceeds more slowly than predicted by Equation 19. When we approach the radius for which an equilibrium solution exists (i.e. possible balance between the disk and the corona without evaporation, see Sect. 3.1) the corona reaches its maximum strength. In the innermost part of the disk the corona strength decreases as the evaporation is replaced by condensation. The radial dependence of the fraction of energy generated in the corona in this region is qualitatively similar to the result given under assumption of no mass exchange between the disk and the corona. Trends are the same as those given by WCŻ97 although the actual radial dependence is much steeper.
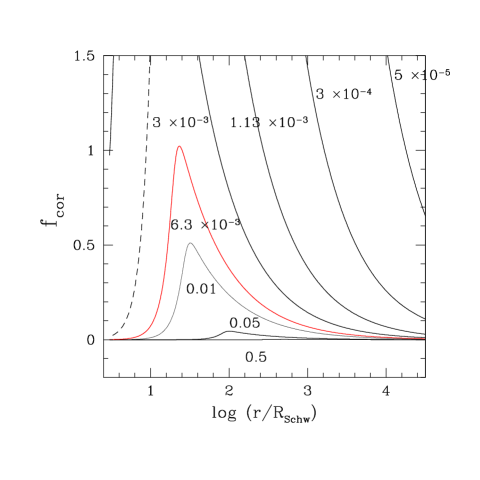
A sequence of solutions showing the radial dependence of the fraction of the energy generated in the corona for several values of the accretion rate is shown in Fig. 14. For significantly higher accretion rates the maximum strength of corona never approaches the value of 1, so the two-phase flow extends to the marginally stable orbit. When the total accretion rate is intermediate the evaporation is efficient enough to cause a transition to an optically thin flow () at a radius approximately given by Eq. 21. However, in the innermost region the condensation is efficient if there is large soft photon flux available to cool electrons through Comptonization. We expect that it might lead to cool clump formation or even a reconstruction of the disk in this region. Such a secondary disk rebuilding is now present in our model for accretion rates higher than . More accurate numerical results for an accretion rate which leads to an ADAF type flow in the innermost part give the value
| (23) |
However, the current version of our model does not allow to describe yet the details of the transition from optically thick disk through optically thin disk to complete disappearance of the disk flow and eventual reverse of this process in the innermost part of the flow. Therefore, at present, we usually assume that once the transition occurs from the flow from disk/corona geometry to an optically thin flow at a certain radius it means that there is no disk flow closer to a black hole. However, we also discuss an opposite case in Section 3.3.
Further decrease of the accretion rate results in a smooth expansion of the ADAF zone. In all other models the first appearance of the single phase hot flow is expected at the marginally stable orbit (e.g. Esin et al. 1997). In our model the disk either extends to the marginally stable orbit or down to a radius larger than the minimum radius dependent on the viscosity, with no solutions for the transition radius ever expected between these two radii. This property of our solutions is caused by the domination of the condensation over evaporation in the innermost part of the disk where the pressure is large.

The dependence of the transition radius on the accretion rate is shown in Fig. 15. We see that for low accretion rates the position of the transition radius depends on the accretion rate and the relation is well described by Eq. 21, as expected. However, at a certain value of the accretion rate the condensation takes over and the coronal dissipation decreases in the innermost part of the disk enough to prevent the transition to an ADAF flow. This critical accretion rate is well described by the two analytical conditions: Eq. 21 and (see Eq. 22) which leads to
| (24) |
This accretion marks the formation of the evaporation branch of the disk/corona solution which is essential for explanation of specific luminosity states of accreting black holes and time-dependent behaviour of X-ray sources (see also Sec. 3.3).
However, the essential point which directly results from radial computations is the understanding of the inner region without disk/corona solutions. What WCŻ97 interpreted as a ’bare’ disk is actually a ’bare corona’, or ADAF type of flow.
Determination of the coronal accretion rate as a function of the total accretion rate is a starting point of the discussion of the stability of solution and eventual time-dependent evolution.
3.3 Expected time-dependent behaviour
3.3.1 Surface density of the accretion flow
The stability and time evolution of the accretion flow is most conveniently discussed on the plot showing the accretion rate, , and the surface density of the flow, , at a representative radius.
We calculate the fraction of the energy generated in the corona at by numerical integration of Eq. 17, assuming the analytical formula for the local evaporation/condensation rate given by Eq. 22. Knowing the corona properties we solve the cold disk structure at this radius, with the appropriate boundary conditions (see Sec. 2.4).
Generally, for the strength of corona is small and the solution is practically the same like in the thin disc without corona. However, when approaches this is no longer true and the solution starts to depart horizontally from standard – curve (Fig. 16). The plot depends on a distance from the black hole, i.e. whether it is higher or lower than the critical radius for which the curve in Fig. 14 has maximum at . The critical radius can be determined analytically by combining Eq. 21 and Eq. 24 which gives
| (25) |
For , increases with decreasing , and finally for a certain value of accretion rate smaller then . As , the disc surface density drops with .
For the plot depends on the assumption of considering or rejecting the solutions representing the secondary disc condensation (see dashed line in Fig. 14 and Sec. 3.2). In Fig. 16 we show the relation between the accretion rate and the surface density for and .
If we assume that once the disk is evaporated it never forms again closer to the black hole, then the transition radius between the disk/corona and single-phase ADAF, suddenly drops to the marginally stable orbit. In such case, when decreasing accretion rate attains the value of , the discontinuous jump in the corona strength occurs from to . This sharp transition is marked as a horizontal line called evaporation branch. In time-dependent solution the disc structure may actually follow this branch if decreases suddenly.
On the other hand, if we allow for existence of the reconstructed branch of the disk at the innermost part of the disk, whenever it is allowed, the solution enters the evaporation branch gradually, it is shallow and positioned at much lower accretion rate (long dashed line). However, such a solution has ’an ADAF hole’ for a certain range of radii. In further considerations we adopt the first solution as the correct one since the inner secondary disk formation is not consistently described within the frame of our model and may not represent a physically acceptable solution.

The mechanism of disk evaporation leads to departure from standard optically thick solution in the form of practically horizontal branch which develops at intermediate accretion rates. For the position of this branch is approximately at the same value of the accretion rate as the maximum of the accretion rate at the optically thin branch, as described by Narayan & Yi (1995b), Abramowicz et al. (1995) and Chen et al. (1995), but this is not the case for other values of since the optically thin branch was computed for a fixed assumed value of the Compton parameter characterizing the cooling of the optically thin flow. Correct solution should be obtained taking into account the actual soft X-ray flux coming from outer parts of the disk and should be a natural extension of the two-phase solution in the case of cold disk absence. At present we cannot extend our horizontal branch to the low surface density range and to reproduce the solution for a single phase medium since the present model is based on assumption that the underlying disk is optically thick and absorbs half of the X-ray radiation emitted by the corona at a given radius and reemits this radiation in the form of soft flux. The description of the transition from a two-phase flow to a single-phase optically thin flow would require relaxation of this assumption and a number of other modifications, like non-local description of the soft photon radiation field since the outermost part of the ADAF flow will be predominantly cooled by soft photons emitted by the outer parts (e.g. Esin et al. 1997) and/or soft photons originating from synchrotron radiation. We plan to study this problem in the future, in order to give a complete view of the transition between those two branches.
The position of evaporation branch in our model depends on the viscosity - lower viscosity parameter corresponds to lower accretion rate at this branch. For and large black hole mass it joins the (almost) standard Shakura-Sunyaev branch just below the turning point marking the gas pressure dominated branch. Therefore, the transition practically happens from unstable radiation pressure dominated branch to evaporation branch with a very narrow range of accretion rates in between. Adopting lower value of viscosity, however, broaden this range considerably. For low mass of the black hole the stable gas dominated branch exists even for since the position of the transition from radiation pressure to gas pressure dominated solution in Shakura-Sunyaev disk depends on the mass of the c entral object.
As seen from Fig. 15, the position of the evaporation branch does not depend on radius in the innermost part of the disk. At the position of the evaporation branch is given by Eq. 24 while for this position is determined by Eq. 21. This property has important consequences for the limit cycle evolution expected for a range of accretion rates corresponding to the unstable radiation pressure dominated branch of thick disk solution.
3.3.2 Stationary solutions and outbursts
This diagram (Fig. 16), although not complete, shows the importance of the evaporation branch for stationary solutions and time-dependent evolution of accretion disk. If the accretion rate is larger than the Eddington limit the model is located on the stable optically thick ADAF branch. Stationary solution well represents an accretion process at this parameter range. When the accretion rate is very low, below the evaporation branch, the flow is described by the optically thin stable ADAF solution in the innermost part, and a disk/corona flow in the outer part. The solution should be also well represented by a stationary model,unless the disk/corona interaction lead to some instabilities.
However, for intermediate accretion rates, the disk/corona flow, as the classical radiation pressure dominated model, may display a complex limit cycle, as already studied, without taking into account the evaporation branch, by Szuszkiewicz & Miller (1998), Honma, Matsumoto & Kato (1991) and Janiuk et al. (2000). The solution would oscillate between the upper branch during the eruption and and the evaporation branch between the outbursts. Actual position of the upper branch may be at lower accretion rates, if the strong outflow in addition to radial advection, is included (e.g. Nayakshin, Rappaport & Melia 1999, Janiuk et al. 2000). The timescale for such evolution is shorter than the viscous timescale of the standard Shakura-Sunyaev stationary disk at this radius because of the reduced surface density. The exact prediction of the global outburst involves the entire unstable part of the disk so, without actual computations, the exact timescale and the amplitude cannot be determined but order of magnitude timescales involved are seconds for galactic sources and months/years for AGN.
The character of this evolution would depend significantly on the radial extension of the instability zone. If this extension is below the position of the evaporation branch is the same for all radii and the entire disk will oscillate between the upper (advection or outflow) dominated branch and the evaporation branch so the optically thick disk will be present during the entire cycle. However, if the radial extension is larger than the evaporation branch at the outermost radius involved in the outburst is lower than evaporation branch inside. The accretion rate in low luminosity phase of the outburst is then too low for optically thick disk in the innermost part, the transition to ADAF takes place so the optically thick disk will be temporarily evacuated during such a cycle. It is interesting to note that probably both kinds of outbursts are seen in the case of microquasar GRS 1915+105, as two distinct kind of spectral behaviour and of the relation between the length of outburst and the frequency of QPO phenomenon are observed (Trudolyubov, Churazov & Gilfanov 1999). Also the observed X-ray delay in the outburst of soft X-ray transient GRO J1655-40 shows that most probably the system made the transition from an inner ADAF/outer disc/corona state to a pure disc/corona state Hameury et al. (1997). The same transition is seen in Cyg X-1 (Esin et al. 1997).
The expected amplitude of the outburst is considerably reduced by the presence of the evaporation branch - expected luminosity changes are by an order of magnitude while, if the gas pressure dominated branch is the lower branch of the limit cycle the outburst of up to four orders of magnitude would be expected, against any observational evidence for the timescales involved.
According to our model, there are strong systematic differences expected between the AGN and GBH since the range of the radiation pressure instability depends on the central mass while the position of the evaporation branch does not. If the evaporation branch is positioned significantly below the radiation pressure dominated branch we can also expect a stable accretion flow in the accretion rate range corresponding to the gas pressure dominated solution. It means that, independent on the viscosity, the range of accretion rates corresponding to stable, gas dominated solution is always broader for galactic black holes than for AGN. In particular. no such range at all is predicted in AGN for since this solution is entirely replaced by evaporation branch and ADAF.
4 Discussion
4.1 Comparison to other models
4.1.1 Underlying assumptions
Our approach to modeling the disk/corona structure follows the MMH94 attitude. We also model the energy dissipation within a corona as due to the accretion flow, we take the transition between the disk and the corona which allows to determine the fraction of energy generated in the corona as a function of radius as well as the transition radius to the optically thin flow as a function of the mass of the black hole, accretion rate and the viscosity parameter in the corona.
There are, however, major important differences between our model and MMH94: (i) our corona is basically a two-temperature medium with energy dissipation due to ion collisions and the Coulomb transfer of energy from ions to electrons, as in SLE and ADAF models (ii) apart from bremsstrahlung we allow also for Compton cooling (iii) we determine the conductive flux at the basis of the corona for the adopted heating/cooling mechanism instead of using the scaled prediction from solar corona. This last modification is responsible for the dependence of the accretion rate in the corona on the viscosity parameter in the case of our model and the lack of such dependence in MMH94 and subsequent papers (Liu, Meyer & Meyer-Hofmeister 1995, Liu et al. 1999, Meyer, Liu & Meyer-Hofmeister 2000). The predicted dependence of the coronal accretion rate on the radius is qualitatively similar in both papers in the case of low accretion rate but not in the case of large accretion rate when the condensation, neglected by MMH94, is important. Our approach to conduction is therefore the same as of Dullemond (1999) but he did not consider a two-temperature plasma and Compton cooling.
Two-temperature accreting corona was discussed by WCŻ97 but their condition of disk/corona transition based on analogy with Compton heating medium was not accurate numerically and missed an important insight on corona formation in the innermost and outermost parts of the flow.
4.1.2 Transition radius to ADAF-type flow
The transition from an outer optically thick disk flow to an inner optically thin ADAF was predicted by a number of models. In some models the transition was based on ADAF principle (i.e. the transition happens whenever an ADAF solution is possible), but in other cases the necessity of the transition resulted from the model itself (MMH94 and applications, our model). It is therefore interesting to compare quantitatively those estimates as they may in principle be estimated observationally.
Condition based on the strong ADAF principle, i.e. on the absence of ADAF solutions:
| (26) |
(Abramowicz et al. 1995, Honma 1996, Kato & Nakamura 1998).
Approximation to the results of Esin et al. (1997) for and :
| (27) |
Liu et al. (1999) gives:
| (28) |
Our results:
| (29) |
All those conditions are roughly in agreement with observational requirement that transition between the high and low state happens at luminosity erg s-1 (Tanaka 1999). The accurate dependence of the transition radius on the accretion rate can in principle be determined from the shape of the reflected component (Done & Życki 1999) in X-ray novae but the errors are considerable and the presence of the hot Compton heated skin on the disk surface further complicates the interpretation of the data. However, high precision spectroscopy from new X-ray satellites should give stronger constraints on the available models.

4.2 Observational consequences
4.2.1 Luminosity states
The transition from optically thick flow to ADAF, i.e. the accretion rate at the evaporation branch marks the transition between the hard state and soft state in accreting binaries, according to a number of suggestions (e.g. Narayan 1996, Esin et al. 1997, Zdziarski, Lubiński & Smith 1999). When the accretion rate is high enough and two-phase flow exists up to the marginally stable orbit then the soft flux is always dominant, cooling of corona is efficient and produces soft X-ray spectrum. Such a solution is stable in GBH for moderate accretion rates and may correspond to the soft (high) state. If the accretion rate is very high the disk is unstable and evolving between the evaporation branch and advection-dominated optically thick branch - such a parameter range may be appropriate for a Very High State, with its complex spectral behaviour (e.g. Takizawa et al. 1997, Revnivtsev et al. 2000). On the other hand, when the accretion rate is very low, the innermost part of the disk is an optically thin ADAF, dominating the spectrum, so such a case corresponds to the Low (or Hard) State.
In our model, the position of horizontal evaporation branch does not depends on the mass of the black hole (Fig. 17). Nevertheless the turning point between the unstable radiation pressure branch and the stable evaporation branch is different for AGNs and GBHs and the possibility of formation of the High State in AGN is strongly suppressed.
Since most of the energy generates at about 10 we can roughly identify the accretion rate ranges for various luminosity states on the basis of Fig 17. Assuming we obtain:
| (30) |
However, we stress that those limits depend significantly on the adopted value of the viscosity parameter .
4.2.2 The nature of the Intermediate State in GBH
The transition of X-ray novae from soft state with the dominant disk emission to a hard state with the dominant thin plasma (e.g. ADAF) contribution proceeds through the Intermediate State. The analysis of the Nova Musca revealed that in the intermediate state the reflection component is seen with an amplitude of order of 1 while the kinematical determination of the inner disk radius from Doppler shifts of the reflected component show disk disruption (Życki, Done & Smith 1998). We can interpret such a state within the frame of our model as corresponding to an accretion rate for which a strong corona forms at intermediate radii. In this case the reflection is strongly biased towards larger radii instead of towards innermost disk radius. Also very high values of the ionization parameter may be consistent with the irradiating source being directly above an accretion disk. Our interpretation is therefore different from that of Esin et al. (1997) since in their approach the intermediate state corresponds to a disrupted disk with an innermost ADAF flow instead of the two-phase disk/corona flow.
4.2.3 Variability
The lack of High State in AGN, as predicted by our model for the viscosity parameter may offer an explanation why the observed variability properties of AGN and GBH are not the same. GBH, when in their High State, dominated by disk emission, are only weakly variable in X-rays in the timescales of about a second, with rms amplitude of order of a percent (e.g. Takizawa et al. 1997). Spectrally, such states are basically similar to quasar spectra. However, quasars are strongly variable, with rms amplitude in the optical band dominated by the disk emission is of order of 15 per cent (e.g. Giveon et al. 1999) in the timescales of years, so the simple scaling with the mass of the black hole does not seem to hold. It may mean that quasars are actually counterparts of the GBH in their Very High State. Since the spectra of GBH in Very High State are quite complex and not always dominated by the disk emission we can also expect such weak disk spectral states among the quasar/Seyfert class. Well studies source MCG-6-15-30 (Tanaka et al. 1995 and subsequent papers) may be an example, due to its exceptionally low mass and consequently high luminosity to the Eddington luminosity ratio (Nowak & Chiang 1999).
4.2.4 Broad Line Region and LINERs
Nicastro (2000) proposed a very interesting model of the Broad Line Region based on the disk/corona model of WCŻ97. The basic idea is that the strong outflow develops at radii where the corona strength reaches its maximum and cool clouds forming in this disk wind are responsible for the emission of broad lines. Predictions based on our new model does not alter presented estimates significantly. The radius of the maximum corona strength in the new model can be determined from the condition (see Eq. 22), using the result with negligible evaporation to determine the local coronal accretion rate (Eq. 19) which gives the dependence
| (31) |
smaller by a factor of few than the WCŻ97 formula (see Eq. 3 of Nicastro 2000). On the other hand the new corona efficiency is now roughly symmetric around this point so the weighted formula for the outflow used by Nicastro would not decrease this radius, as it did in the case of sharp edge corona of WCŻ97 so the net effect will be roughly the same as before.
It was suggested by Lasota et al. (1996), that LINERs may represent the systems with ADAFs. The transition from objects with broad emission lines to LINERs happens, according to Nicastro (2000), due to the switch off the outflow if the accretion rate is too low for the existence of the radiation pressure dominated zone. The most efficient part of the corona, however, is located in the gas pressure dominated region so this connection is not clear. On the other hand, for very small accretion rate, within the frame of our new model, there is a transition from secondary disk rebuilding phase to a definite ADAF flow in the innermost part (see Eq. 23). Such a change may be important from the point of view of the radiative cooling, the efficiency of advection and, consequently, the mass outflow. The mass loss through the wind as a function of radius is not calculated yet in the present model but this can be done in the future, following the method of e.g. Meyer & Hoffmeister (1994) and WCŻ97.
Acknowledgements.
We are grateful to Drs R. Narayan and A. Esin, for their helpful comments and suggestions on the original version of our paper. We thank A. Zdziarski for his computer program generating optically thin solutions used in Fig. 16 and to Piotr Życki for helpful discussions. Part of this work was supported by grant 2P03D01816 of the Polish State Committee for Scientific Research.Appendix A Evaporation/condensation rate at the basis of the corona
The electron temperature profile within the transition zone is determined by the effect of heating, radiative cooling, conduction and the vertical motion of the material (e.g. Begelman & McKee 1990, McKee & Begelman 1990, MMH94). The general form of this equation in a plane parallel geometry is the following
| (32) |
where the conduction flux due to electrons is given by
| (33) |
Here we included the effect of radial advection into the cooling term and we neglected the conduction due to ions.
Following McKee & Begelman (1990) we multiply the Equation 32 by and integrate in the vertical direction across the transition zone:
| (34) | |||||
The conduction flux at the upper and lower point of the transition zone vanishes which is used as a boundary condition in full numerical computations (e.g. Dullemond 1999) so the second term on the left hand side of the equation vanishes thus leaving a relation between the mass transfer (first term) and the integral on the right hand side.
We assume that the transition from hot coronal to cold disk material in the vertical direction takes place in a very narrow geometrical zone so any change of the pressure across this zone can be neglected. This allows to calculate the right hand side integral conveniently, using algebraic expressions for the density, ion temperature and the heating and cooling as functions of the electron temperature.
The left hand side can be approximately expressed by estimating first the Field length (Field 1965) measuring the thickness of the transition zone
| (35) | |||||
We now estimate the typical value of the conductive flux within the transition zone as
| (36) |
which allows us to express the left hand side term as
| (37) |
Therefore the approximate formula for the condensation/evaporation rate at the disk/corona boundary reads
| (38) |
References
- (1) Abramowicz M.A., Chen X., Kato S., Lasota J.-P., Regev O., 1995, ApJ, 438, L37
- (2) Abramowicz A., Czerny B., Lasota J.-P., Szuszkiewicz E., 1988, ApJ, 332, 646
- (3) Begelman M.C., McKee C.F., 1990, ApJ, 358, 375
- (4) Begelman M.C., McKee C.F., Shields G.A., 1983, ApJ, 271,70
- (5) Beloborodov A.M., 1999, ApJ, 510, L123
- (6) Bisnovatyi-Kogan G.S., Lovelace R.V.E., 1997, ApJ, 486, L43
- (7) Blandford R.D., Begelman M.C., 1999, MNRAS, 303, L1
- (8) Chen X, Abramowicz M.A., Lasota J.-P., Narayan R., Yi I., 1995, ApJ, 443, L61
- (9) Done C., Życki P.T., 1999, MNRAS, 305, 457
- (10) Dullemond C.P., 1999, A&A, 341, 936
- (11) Esin A.A., McClintock J.E., Narayan R., 1997, ApJ, 489, 865
- (12) Field G.B., 1965, ApJ, 142, 531
- (13) Gruzinov A., Quataert E., 1999, ApJ, 520, 849
- (14) Haardt F., Maraschi L., 1991, ApJ, 380, L51
- (15) Hameury J.-M., Lasota J.-P., McClintock J. E., Narayan R., 1997, ApJ, 489, 234
- (16) Hawley J.F., Gammie C.F., Balbus S.A., 1996, ApJ, 464, 690
- (17) Honma F., 1996, PASJ, 48, 77
- (18) Honma F., Matsumoto R., Kato S., 1991, PASJ, 43, 147
- (19) Ichimaru S., 1977, ApJ, 214, 840
- (20) Janiuk A., Czerny B., Siemiginowska A., Abramowicz M.A., 2000 ApJ (to be submitted)
- (21) Janiuk A., Życki P.T., Czerny B., 2000, MNRAS (in press)
- (22) Kato S., Fukue J., Mineshige S., 1998 “Black-Hole Accretion Discs”, Kyoto University Press
- (23) Kato S., Nakamura K.E., 1998, PASJ, 50, 559
- (24) Krolik J.H., 1998, 498, 213
- (25) Lasota J.-P., Abramowicz M. A., Chen X., Krolik J., Narayan R., Yi I. 1996, ApJ, 462, 142
- (26) Liang E.P.T., Price R.H., 1977, 218, 247
- (27) Liu B.F., Meyer F. Meyer-Hofmeister E., 1995, A& A., 300, 823
- (28) Liu B.F., Yuan W., Meyer F. Meyer-Hofmeister E., Xie G.Z., 1999, ApJ, 527, L17
- (29) Maciołek-Niedźwiecki A., Krolik J.H., Zdziarski A.A., 1997, ApJ, 483, 111
- (30) Madejski G.M., 1999, in Abramowicz M., Bjórnsson G. & Pringle J., Eds., “Theory of Black Hole Accretion Disks”, Cambridge University Press
- (31) McKee C.F., Begelman M.C., 1990, ApJ, 358, 392
- (32) Meyer F., Liu B.F., Meyer-Hofmeister E., 2000, astro-ph/0002053
- (33) Meyer F., Meyer-Hofmeister E. 1994, A&A, 288, 175 (MMH94)
- (34) Meyer-Hoffmeister E., Meyer F., 1999, astro-ph/9906305
- (35) Muchotrzeb B., Paczyński B., 1982, Acta Astron. 32, 1
- (36) Mushotzky R.F., Done C., Pounds, K.A., 1993, ARA&A, 31, 717
- (37) Narayan, R., 1996, ApJ, 462, 136
- (38) Narayan, R., 1997, in “Unsolved Problems in Astrophysics”, eds. J.N. Bahcall & J.P. Ostriker, Princeton University Press, p. 301
- (39) Narayan R., Yi I., 1994, ApJ, 428, L13
- (40) Narayan R., Yi I., 1995a, ApJ, 444, 231
- (41) Narayan R., Yi I., 1995b, ApJ, 452, 710
- (42) Narayan R., Mahadevan R., Quataert E., 1999, in “The Theory of Black Hole Accretion Disks”, eds. M.A. Abramowicz, G. Bjórnson, and J.E. Pringle, Cambridge University Press
- (43) Nayakshin S., 1999, astro-ph/9912455
- (44) Nayakshin S., Kazanas D., Kallman T.R., 1999, astro-ph/9909359
- (45) Nayakshin S., Rappaport S., Melia F., 1999, astro-ph/9905371
- (46) Nicastro F., 2000, ApJ, 530, L65
- (47) Nowak M., Chiang J., 2000, ApJ, 531, L13
- (48) Paczyński B., 1978, Acta Astr. 28, 241
- (49) Piran T., 1978, ApJ, 221, 652
- (50) Poutanen J., 1999, in “The Theory of Black Hole Accretion Disks”, eds. M.A. Abramowicz, G. Bjórnson, and J.E. Pringle, Cambridge University Press
- (51) Quataert E., Gruzinov, A., 1999, ApJ, 520, 248
- (52) Revnivtsev M.G., Trudolyobov S.P., Borozdin K.N., 2000, MNRAS, 312, 151
- (53) Różańska A., 1999, MNRAS, 308, 751
- (54) Różańska A., Czerny B., 1996, Acta Astr., 46, 233
- (55) Różańska A., Czerny B., 2000, MNRAS (in press)
- (56) Różańska A., Czerny B., Życki P.T., Pojmański G., 1999, MNRAS, 305, 481
- (57) Shakura N.I., Sunyaev R.A., 1973, A&A, 24, 337
- (58) Shapiro S.L., Lightman A.P., Eardley D.M., 1976, ApJ, 204, 187
- (59) Spruit H.C., Haardt F., 2000, astro-ph/0001458
- (60) Stepney S., Guilbert P.W., 1983, MNRAS, 204, 1269
- (61) Svensson R., Zdziarski A., 1994, ApJ, 436, 599
- (62) Szuszkiewicz E., Miller J.C., 1998, MNRAS, 298, 888
- (63) Takizawa M., Dotani T., Mitsuda K. et al., 1997, ApJ, 489, 272
- (64) Tanaka Y., Nandra K., Fabian A.C., et al., 1995, Nature, 375, 659
- (65) Tanaka Y., Lewin W.G.H., 1995, in Lewin W.G.H., van Paradijs J., van den Heuvel E.P.J., eds., Cambridge Astrophys. Ser. Vol. 26, “X-ray binaries”, Cambridge University Press, Cambridge, p. 126
- (66) Tanaka Y., 1999, in “Disk instabilities in Close Binary System”, eds. S. Mineshige and J.C. Wheeler, Universal Academic Press, Kyoto, p.21
- (67) Trudolyubov S., Churazov E., Gilfanov M., 1999, A&A, 351, L15
- (68) Turolla R., Dullemond C.P., 2000, astro-ph/0001114
- (69) Witt H.J., Czerny B., Życki P.T., 1997, MNRAS, 286, 848 (WCŻ97)
- (70) Zdziarski A.A., 1998, MNRAS, 296, L51
- (71) Zdziarski A.A., Lubiński P., Smith D.A., 1999, MNRAS, 303, L11
- (72) Życki P.T., Collin-Souffrin S., Czerny B., 1995, MNRAS 270, 70
- (73) Życki P.T., Done C., Smith D.A., 1998, ApJ, 496, L25