A deep X-ray observation of NGC 4258 and its surrounding field
Abstract
We present a deep X-ray observation of the low-luminosity active galactic nucleus in NGC 4258 (M 106) using the Advanced Satellite for Cosmology and Astrophysics (ASCA). Confirming previous results, we find that the X-ray spectrum of this source possesses several components. The soft X-ray spectrum () is dominated by thermal emission from optically-thin plasma with . The hard X-ray emission is clearly due to a power-law component with photon index absorbed by a column density of . The power-law is readily identified with primary X-ray emission from the AGN central engine. Underlying both of these spectral components is an additional continuum which is possibly due to thermal emission of a very hot gaseous component in the anomalous arms and/or the integrated hard emission of X-ray binaries in the host galaxy. We also clearly detect a narrow iron K emission line at . No broad component is detected. We suggest that the bulk of this narrow line comes from the accretion disk and, furthermore, that the power-law X-ray source which excites this line emission (which is typically identified with a disk corona) must be at least in extent. This is in stark contrast to many higher-luminosity Seyfert galaxies which display a broad iron line indicating a small () X-ray emitting region. It must be stressed that this study constrains the size of the X-ray emitting corona rather than the presence/absence of a radiatively efficient accretion disk in the innermost regions. If, instead, a substantial fraction of the observed narrow line originates from material not associated with the accretion disk, limits can be placed on the parameter space of possible allowed relativistically broad iron lines. We include a discussion of various aspects of iron line limb-darkening for highly inclined sources, including the effect of gravitational light-bending on the apparent limb-darkening law. By comparing our data with previous ASCA observations, we find marginal evidence for a change in absorbing column density through to the central engine, and good evidence for a change in the AGN flux. We conclude with a brief discussion of two serendipitous sources in our field of view; the QSO Q1218+472 and a putative cluster of galaxies.
Subject headings:
accretion, accretion disks - black hole physics - galaxies: active - galaxies: individual: NGC 4258 - X-rays:galaxies1. Introduction
The nearby low-luminosity active galactic nucleus (AGN) in NGC 4258 (M 106) has become crucially important in our understanding of accreting supermassive black holes. Exquisite position and velocity measurements of the H2O megamasers in NGC 4258 reveal that the masing material resides in a very thin and slightly warped disk that is in almost perfect Keplerian motion about a central black hole with a mass of (Nakai, Inoue & Miyoshi 1993; Greenhill et al. 1995a; Miyoshi et al. 1995). Detailed studies of the maser proper motions and centripetal accelerations confirm this interpretation (Greenhill et al. 1995b) and allow us to measure the distance to this source independently of the Hubble constant (; Herrnstein et al. 1999).
Sensitive X-ray observations provide a powerful means of probing both large scale and small scale structures within NGC 4258. X-ray emission was first detected in a short Einstein observatory high resolution imager (HRI) observation (Fabbiano et al. 1992). More sensitive soft X-ray data collected by the ROSAT position sensitive proportional counters (PSPC) and HRI found an extended halo of hot () gas around NGC 4258 (Pietsch et al. 1994; Vogler & Pietch 1999) as well as X-ray emission associated with the well known helically twisted jets (the anomalous arms; Pietsch et al. 1994; Cecil, Wilson & De Pree 1995; Vogler & Pietch 1999). None of these soft X-ray observations penetrated the column of absorbing gas that obscures the AGN itself. This had to await ASCA observations (Makishima et al. 1994; hereafter M94). M94 found that the central X-ray source was well described by a power-law with photon index , and was absorbed by a column density of . The soft X-ray spectrum was found to be complex with components arising from thermal plasma emission and, possibly, contributions from the underlying X-ray binary population in NGC 4258. A marginal detection of an iron line was claimed with an equivalent width of .
Of great importance is the opportunity that NGC 4258 gives us to study accretion physics when the mass accretion rate is potentially very low. The significance of this issue is highlighted when it is realized that most of the (quiescent) supermassive black holes in the universe are inferred to accrete matter at rates which are comparable to, or less than, that in NGC 4258. It was realized by several authors that when the accretion rate is low (relative to the Eddington rate), an accretion disk may switch into a hot, radiatively-inefficient mode (Ichimaru 1977; Rees 1982; Narayan & Yi 1994; Narayan & Yi 1995). In essence, the plasma becomes so tenuous that the timescale for energy transfer from the protons to the electrons (via Coulomb interactions) becomes longer than the inflow timescale. The energy remains as thermal energy in the protons (which are very poor radiators) and gets advected through the event horizon of the black hole. These are the so-called Advection Dominated Accretion Flows (ADAFs). ADAFs are to be contrasted with ‘standard’ radiatively-efficient accretion disks in which the disk remains cool and geometrically thin all of the way down to the black hole (Shakura & Sunyaev 1973; Novikov & Thorne 1974).
X-ray observations of broad iron lines have shown that higher luminosity systems do indeed accrete in the radiatively-efficient mode (Tanaka et al. 1995; Fabian et al. 1995). However, the basic nature of the accretion disk when the mass accretion rate is low is still far from clear. The existence of the ADAF solution is at the mercy of poorly known physics such as the strength of the electron-ion coupling and the fraction of the viscous energy that is deposited into the electrons (Quataert & Gruzinov 1999). Also, Blandford & Begelman (1999) have suggested that the ADAF solutions discussed by Narayan & Yi (1994, 1995) are physically inconsistent and necessarily drive powerful outflows (producing the so-called Adiabatic Inflow-Outflow Solutions; ADIOS). Even if ADAF-type solutions exist, it remains an open question as to whether real disks can make a transition to this mode when the outer regions of the disk are cold and geometrically-thin (as they clearly are in systems such as NGC 4258). NGC 4258 provides a laboratory in which we can examine all of these issues.
This dichotomy in possible accretion disk physics has produced two models for the central regions of NGC 4258. By modeling the observed water maser emission in this system, Neufeld & Maloney (1995) conclude that the accretion disk in NGC 4258 has a high efficiency (), and a low accretion rate (, where is the standard viscosity parameter of accretion disk theory). Furthermore, the observed maser emission in part traces out a warp in the disk. Modeling this warp as being driven by radiation pressure from the central X-ray source (Pringle 1996) also implies a radiative efficiency (Maloney, Begelman, & Pringle 1996). On the other hand, Lasota et al. (1996) use ADAF models of the 2-10 keV X-ray power law slope and continuum radio data to argue that the system has low efficiency () and high accretion rate (, ). While the original model of Lasota et al. (1996) postulated a large ADAF region (), recent radio data constrain the ADAF region to be smaller than (Herrnstein et al. 1998).
In this paper, we report a deep ( ksec of good exposure time) X-ray observation of NGC 4258 with ASCA (Ohasi et al. 1996; Makishima et al. 1996; Yamashita 1997). We also obtained simultaneous hard X-ray data with the RXTE satellite but, due to a gain change prior to our observation, there are currently no robust response matrices or background models for these particular RXTE data. A presentation of these RXTE data must await these developments in calibration. In section 2, we describe the data reduction before discussing the X-ray spectrum of NGC 4258 in Section 3. Section 4 focuses on the properties of the observed iron line and the implications of this line for the nature of the accretion disk. Section 5 presents a brief discussion of the other interesting objects in the field of view of the ASCA Gas Imaging Spectrometer (GIS). Our results are summarized in Section 6.
2. Data reduction and the X-ray image
The NGC 4258 field was observed by ASCA on 1999 May 15–20. The SIS data were cleaned in order to remove the effects of hot and flickering pixels and subjected to the following data-selection criteria : i) the satellite should not be in the South Atlantic Anomaly (SAA), ii) the object should be at least 7 degrees above the Earth’s limb, iii) the object should be at least 25 degrees above the day-time Earth limb and iv) the local geomagnetic cut-off rigidity (COR) should be greater than 6 GeV/c. We also applied a standard grade selection on SIS events in order to further minimize particle background. The GIS data were cleaned to remove the particle background and subjected to the following data-selection criteria : i) the satellite should not be in the SAA, ii) the object should be at least 7 degrees above the Earth’s limb and iii) the COR should be greater than 7 GeV/c. SIS and GIS data that satisfy these criteria shall be referred to as ‘good’ data.
After the above data selection, there are 170 ksec of good data per SIS detector and 185 ksec of good data per GIS detector. Images were then extracted from these good data for each of the four instruments (two SIS and two GIS).
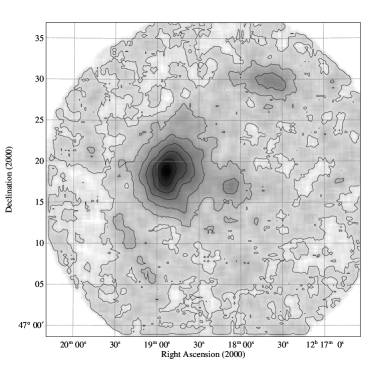
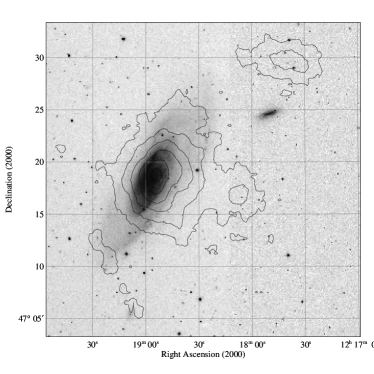
Fig. 1 shows the GIS2 image for this observation. The nucleus of NGC 4258 is the brightest X-ray source in this field. Two other sources are also detected: (a) one point-like source arcmins to the west of NGC 4258, and (b) another slightly extended source arcmins to the north-west of NGC 4258. Both of these sources were clearly detected and studied with ROSAT by Pietsch et al. (1994). Source (a) can be readily identified as the quasar Q1218+472 (Burbidge 1995; Burbidge & Burbidge 1997). The identification of source (b) is less secure, but Pietsch et al. argue that it is a background () cluster of galaxies on the basis of a possible galaxy over-density on a deep optical plate.
We have extracted spectra and lightcurves for all three sources in our field. Unless otherwise stated, source counts were extracted from a circular region centered on the source with radii of 3 arcmin and 4 arcmin for the SIS and GIS respectively. Background spectra were obtained from blank regions of the same field (using the same chip in the case of the SIS). No temporal variability was observed in any of these sources. In order to facilitate spectral fitting, all spectra were rebinned so as to contain at least 20 photons per spectral bin. In order to avoid poorly calibrated regions of the spectrum, the energy ranges considered were 1.0–10 keV for the SIS detectors, and 0.8–10 keV for the GIS detectors. Note that we use a lower-energy cutoff for the SIS that is considerably higher than the ‘standard’ 0.6 keV cutoff in order to avoid the effects of “residual dark current distribution”, or RDD, which is known to plague recent ASCA observations.
3. A detailed X-ray study of NGC 4258
We now discuss the X-ray properties of NGC 4258. The two serendipitous sources, Q1218+472 and the putative galaxy cluster, will be addressed in Section 5.
3.1. Fitting the soft X-ray spectrum
3.1.1 The inclusion of ROSAT data
M94 showed that the soft X-ray spectrum of NGC 4258 is complex, with components arising from thermal plasma emission and, possibly, the integrated emission of the X-ray binary population. Since we do not consider ASCA data below 0.8 keV, spectrum models of this region will be poorly constrained with many different models able to explain the soft spectrum. To break these degeneracies, we included an archival ROSAT PSPC spectra in our analysis. We chose to use the longest single ROSAT PSPC integration of NGC 4258. This observation, which was performed on 1990-Jun-1, has about 25 ksec of good exposure time. This dataset was obtained from the heasarc archive at the NASA Goddard Space Flight Center and reduced using the ftools routine xselect v1.4b. ROSAT-PSPC data were used in the range 0.2–2 keV. Good agreement was obtained between the ASCA SIS/GIS and the ROSAT PSPC in the overlap band between 1–2 keV, thereby alleviating concerns that our analysis will be severely affected by poor ROSAT-ASCA cross-calibration.
| Model | Components | /dof | |||||||||
| NHgal | (keV) | (keV) | (keV) | (keV) | (eV) | ||||||
| (NH(PO)+) | |||||||||||
| A | MEKAL1 | 1930/1506 | |||||||||
| B | BREMS+ | 1627/1504 | |||||||||
| MEKAL1 | |||||||||||
| C | MEKAL2 | 1784/1505 | |||||||||
| D | PO2+ | 1634/1504 | |||||||||
| MEKAL2 | |||||||||||
| E | BREMS+ | 1627/1503 | |||||||||
| MEKAL2 | |||||||||||
| F | BREMS+ | 1557/1503 | |||||||||
| MEKAL3 | |||||||||||
| G | BREMS+ | 1609/1500 | |||||||||
| MEKAL2+ | |||||||||||
| GAU |


3.1.2 Characterizing thermal plasma emission
Table 1 details our spectral analysis of NGC 4258 (excluding our detailed analysis of the iron line which will be addressed in Section 4). As is evident from our spectrum and the previous work of M94, the spectrum has both hard and soft components. The simplest model that we attempted to fit consists of an absorbed power-law with an additional bremsstrahlung component, all absorbed by the Galactic column density of . This was a dreadful fit to the spectrum, giving . Large residuals exist with the model under-predicting the data in the 0.7–1.5 keV range. Since this is the energy range in which powerful line emission can occur from a thermal plasma with , we next replaced the bremsstrahlung components with the thermal plasma model mekal (Mewe, Gronenschild & van den Oord 1985; Arnaud & Rothenflug 1985; Mewe, Lemen & van den Oord 1988; Kaastra 1992). Initially, we consider a thermal plasma model in which all metals are assumed to have the same fractional elemental abundance relative to the cosmic abundances of Anders and Grevesse (1989). The inclusion of the thermal plasma component (model-A in Table 1) leads to a dramatic improvement in the goodness of fit with . However, several line-like residuals in the X-ray spectrum (including one at iron K energies), as well as a general curvature of the spectrum, prevent this model from being an adequate fit to the data. We now discuss extensions of this basic spectral model which can adequately explain the observed spectrum.
3.1.3 An additional Bremsstrahlung-like component
The curvature in the spectrum requires us to consider an additional continuum component. M94 include an additional bremsstrahlung component in order to model the diffuse and off-nuclear emission in this object. Including a bremsstrahlung component (model B) accounts for this curvature and leads to a dramatic improvement in the goodness of fit (compare models A and B; for 2 additional degrees of freedom). This additional component is required even if we allow for abundance variations in the thermal plasma component (compare models B and C; also see below). For completeness, we also investigated the possibility that this additional continuum component is a power-law that does not suffer any intrinsic absorption (model D). Scattering of the AGN power-law emission around the absorbing material, or non-thermal spatially-extended emission from the galaxy or jet would be possible sources of such a component. This provides a marginally worse fit than the bremsstrahlung-based model, and implies large scattering fractions () or powerful distributed non-thermal emission ( in the 0.5–10 keV range). Hence, we think this power-law alternative to be unlikely.
3.1.4 Constraints on the plasma abundance
Whether this additional continuum is modeled as a bremsstrahlung or a power-law component has little influence on the best-fit parameters for the direct AGN component (i.e. it does not significantly affect the photon index or normalization of the AGN power-law emission, nor the inferred absorbing column through to the power-law source). However, it does effect the best-fit abundances of the soft thermal plasma component (compare models C and B in Table 1). In this section, we attempt to constrain the abundances of the thermal plasma under the assumption that this additional component has a bremsstrahlung form. We also make the assumption that the thermal plasma emission can be characterized by a single temperature. We make these assumptions here in order to be able to make progress with these data. Both of these assumptions may be invalid. We must await future high-resolution, high signal-to-noise data in order to test and relax these assumptions through the use of direct emission line diagnostics.
We investigated the plasma abundances in a two step process. Firstly, the metals were split into two classes with iron and nickel in one class, and all of the lighter metals in the other class. The relative abundances were fixed within each class, but the relative abundance of each class was allowed to vary independently. This had no effect on the goodness of fit, with the best-fit relative abundances of each class being very similar (compare models B and E). Since soft X-ray line-like residuals still persist in these fits, the relative abundances of all of the light elements were then allowed to vary independently. This leads to a further improvement in the goodness of fit (compare models E and F; for 10 additional degrees of freedom). After fitting model F (which includes an additional bremsstrahlung component; see below) it can be seen from Table 1 that the abundances of C, Ne, Na, Al, and Ar are poorly constrained with only weak upper limits possible. This is due to the lack of strong emission lines from these elements in the well-calibrated region of the ASCA-SIS/GIS. On the other hand, the abundances of Mg and Fe are well constrained (with and ) due to the detection of fairly strong emission line complexes associated with these elements. It is worth noting the apparent extreme overabundance of Calcium (). This result must be viewed with suspicion since the dominant Calcium emission lines emerge just below our usable ASCA band (which has a lower-energy cutoff at 0.8 keV for the GIS and 1.0 keV for the SIS). Hence, any slight ASCA/ROSAT cross-calibration problem might be manifested as an extreme Calcium abundance.
3.1.5 Fluxes and luminosities
| parameter | value |
|---|---|
| observed 0.5–10 keV flux | |
| observed 2–10 keV flux | |
| power-law 0.5–10 keV luminosity | |
| thermal plasma 0.5–10 keV luminosity | |
| thermal plasma bolometric luminosity | |
| bremsstrahlung 0.5–10 keV luminosity |
Using model F from Table 1, and assuming a distance of 7.2 Mpc, we can compute the absorption-corrected luminosities in each spectral component. The result is shown in Table 2. It can be seen that the power-law component dominates the energetics of the X-ray band by almost an order of magnitude. On energetic grounds, the thermal plasma emission can be powered via the absorption and re-emission of 10–25% of the hard power-law component (depending upon how low in energy the power-law component extends). Our data cannot probe the nature and origin of this thermal emission beyond pointing out the basic energetics. However, future observations with Chandra and XMM will be able to study the spatial distribution of the various spectral components that we have noted. One will then be able to address whether the thermal emission is located in the immediate vicinity of the AGN (as, for example, if it originated from an accretion disk wind) or distributed on scales of 100 pc or greater (as in the case of a galactic superwind).
3.2. Characterizing the iron K emission line
Residuals due to the iron line are clearly visible when models A–E are fit to these data (see Fig. 2b). We choose to use model D of Table 1 as a base model for our iron line investigation. We do not use model E (i.e. the best fitting model from Table 1) because the excessive number of free parameters makes the iron line error analysis unnecessarily difficult. We have verified that our iron line results are not affected in any significant manner by the choice of using model D as a base model rather than model E. We initially fit this line by adding a Gaussian emission feature (model F of Table 1). The improvement in the goodness of fit is significant at more than the 90 per cent level ( for 3 additional degrees of freedom). The full-width half maximum (FWHM) of the line is constrained to be less than , and is consistent with being zero (i.e. the line is unresolved). The inferred centroid energy of is consistent with the K line energy from iron with an ionization state of less than Fexvii. The equivalent width of the line is .
We discuss the origins of this emission line and the possible implications for the nature of the accretion disk in Section 4.
3.3. The long term variability of NGC 4258
| Obs. | 5-May-93 | 23-May-96 | 5-June-96 | 18-Dec-96 | 15-May-99 |
|---|---|---|---|---|---|
| MJD | 49122 | 50226 | 50239 | 50435 | 51313 |
| SIS Exposure (1000 s) | 39 | 23 | 31 | 26 | 170 |
| 111Bremsstrahlung and thermal plasma parameters allowed to be free during this fit. | |||||
| GIS2 5-10 keV flux () | 5.1 | 8.3 | 8.8 | 9.5 | 4.0 |
| /dof | 652/511 | 639/542 | 909/728 | 828/632 | 1627/1504 |
ASCA observed NGC 4258 on 4 previous occasions, thereby allowing us to examine the variability of this AGN on timescales of several years. We retrieved all of the available ASCA data on NGC 4258 from the heasarc public database located at the NASA Goddard Space Flight Center. These data were reduced in the same manner as described in Section 2, and then fitted with spectral model B from Table 1. Since these archival data possess significantly lower signal to noise, the temperatures of the thermal plasma and bremsstrahlung components were fixed to the best fit values from Table 1. The normalization of the bremsstrahlung component was also fixed. Thus, this investigation is probing changes in the AGN power-law and absorbing column density. Note that only GIS data were included for the 5-May-93 observation, since NGC 4258 falls very close to the SIS chip boundaries in this observation.
Table 3 summarized the results of this study. The photon index of the power-law emission is consistent with being constant over the 6 years covered by these data. However, there are indications of variations in both the absorbing column density (which seems to decrease by between the 1993 and 1996 observations) and the 5–10 keV flux (which almost doubles from the 1993 to the 1996 observations, and then drops back to the 1993 level by the time of the 1999 observation). The flux in the 5–10 keV range is dominated by the AGN power-law component and is little affected by the absorbing column.
4. Implications of the iron line in NGC 4258
4.1. Pure accretion disk models for the iron line


The interest in the iron line lies in its ability to diagnose the nature of the accretion disk. Suppose that the only significant source of iron K line emission in NGC 4258 is the AGN accretion disk. We can then model the observed iron line as being from the surface of the accretion disk around a non-rotating (Schwarzschild) black hole by using the diskline model within the xspec software package. We will make the assumption that the disk is flat inside of the masing radii and so set the inclination of the inner disk to be . The outer radius of the iron line emitting region is set to (the radius of the maser disk; note that the iron line fits are very insensitive to the actual value of provided it is sufficiently large). The line energy was fixed at the value appropriate for K emission from weakly ionized iron, . Free parameters in the fit are the inner radius of the line emitting region , the index describing line emission as a function of radius (where the surface emissivity ), and the normalization of the line. Figure 3a reports the confidence contours that result when this accretion disk model is fit to the iron line. It can be seen that the narrowness of the line requires either flat emissivity as a function of radius () or an inner edge to the line emitting region at greater than a hundred gravitational radii.
If the X-ray emission traces the viscous dissipation in the disk, and the disk is geometrically-thin and radiatively-efficient so that it can be described by a Novikov & Thorne (1973) model, the emissivity index should tend to outside of the inner 20 gravitational radii or so. In this case, and given the assumption that the observed iron line is from the accretion disk, we are led to the conclusion (at the 90% confidence level) that the line emitting region has an inner edge at . Such an inner edge may correspond to the point at which the disk surface becomes ionized, or where the disk undergoes a transition to a hot (possibly advection dominated) state. On the other hand, if the X-ray source is in the form of a geometrically-thick corona with size , the emissivity index will be fairly flat for , and will tend to for . In this case (and again, with the assumption that the observed iron line is from the accretion disk), we must conclude that the corona is large .
4.2. Hybrid disk/non-disk iron line models
An alternative that we must explore is one in which a some fraction of the observed narrow iron line is produced by distant material not directly related to the accretion disk. In this case, any broad emission line from the accretion disk would be blended with this narrow line and, possibly, buried in the noisy continuum spectrum. To investigate this possibility, we suppose that a narrow iron line from some non-disk origin contributes to the observed spectrum with an equivalent width of . Fixing the line emissivity profile of the disk to the canonical case, Fig. 3b shows the confidence contours on the plane. It can be seen that the line emission needs an inner edge or break at unless the additional narrow line source contributes at the level .
We cannot rule out, in any rigorous sense, the possibility that most (or all) of the observed iron line originates from matter that is not associated with the accretion disk. However, simple arguments lead us to disfavor such a scenario. Consider iron line emission in a geometrically-thick torus surrounding the accretion disk of NGC 4258. An upper limit to the column density of this structure along our line of sight to the AGN is given by the observed column density of . If we suppose that this torus is in the same plane as the accretion disk (so that we are also viewing it edge-on), it is plausible to assume that we are looking through the optically-thickest part of the torus. By considering the case in which the torus completely surrounds the AGN with uniform column density along all radii, an upper limit to the equivalent width of the iron line is given by:
| (1) |
where is the energy of the emission line, is the fluorescent yield of the transition, is the density of iron relative to hydrogen, and is the energy dependent photoionization cross section for ionization from the shell. Here, we have approximated the photon index of the ionizing AGN power-law to and assumed that the central X-ray source is isotropic. Using the photoionization cross-sections for neutral iron of Verner & Yakovlev (1994), this yields
| (2) |
However, there are several reasons why this upper limit would almost certainly not be achieved. Firstly, modeling of the accretion disk warp strongly suggests that our line of sight intercepts the disk and that the bulk of the column density which obscures the AGN originates in the disk (Herrnstein, priv. communication). Therefore, we might expect significantly smaller column densities along lines of sight that have smaller inclinations angles relative to the accretion disk. Secondly, the accretion disk may well occult half of this fluorescing cloud, thereby reducing this prediction further. Thus, the true iron line from surrounding non-disk material may well be reduced from our naive prediction by a factor of several.
A high column density torus that is misaligned with the accretion disk so as to leave the X-ray unobscured is still a viable source for the observed narrow iron line. Such a torus must exist on size scales significantly larger than the masing accretion disk, or else it would hydrodynamically disturb the disk and lead to strong deviations from the observed Keplerian rotation.
4.3. Equivalent width limits on a “Seyfert-like” broad iron line

Many higher luminosity Seyfert galaxies display iron lines which are so broad that the line emitting region is thought to extend down to near the radius of marginal stability ( for a non-rotating black hole). The typical emissivity index lies between and (Nandra et al. 1997). As shown above, if then no such relativistically broad component is required by our fits to NGC 4258. However, even when all of the observed line is assumed to arise from some other structure, we can still obtain an upper limit to the equivalent width of any such “Seyfert-like” component by fixing in the spectral fitting, and including an explicit narrow Gaussian component to fit the observed line. The resulting upper limit on the equivalent width of the relativistic iron line, as a function of the assumed line emissivity index, is shown in Fig. 4 (thick solid line).
If NGC 4258 possesses an iron line emissivity inner accretion disk similar to higher luminosity Seyfert galaxies, one might naively expect that limb-darkening due to absorption in the outer layers of the accretion disk will reduce the equivalent width of any such broad iron line to very small values (e.g. George & Fabian 1991). From the work of Ghisellini, Haardt & Matt (1994), the limb-darkening in the plane-parallel case is well described by the expression
| (3) |
where is the inclination angle. Nandra et al. (1997) shows that most Seyfert 1 galaxies have a broad iron line with in the range 200–400 eV. Taking these to be representative of the face-on values, an inclination of and this limb-darkening law reduces the expected equivalent width to 66–132 eV. This is below our detection threshold.
Two important effects modify this estimate. Firstly, relativistic light bending means that significant portions of the innermost regions of the disk are viewed significantly more face-on than otherwise might be thought. The dotted and dashed lines on Fig. 4 show the effects of light bending on the predicted broad line equivalent width (assuming a face-on equivalent width, , of 200 eV and 400 eV respectively). These lines have been computed using the relativistic code presented in Reynolds et al. (1999) combined with the above limb-darkening law. Figure 4 shows that the broad line would not be detectable unless and .
Secondly, the above limb-darkening law assumes that the surface of the accretion disk is strictly planar. It is very unlikely that this will be the case. MHD turbulence and violent plasma processes within the disk corona will inevitably corrugate this surface thereby reducing the effects of limb-darkening for highly inclined sources. In the extreme case, most of the matter in the outer layers of the accretion disk may be concentrated into dense filaments or clumps (e.g. see the MHD simulations for the ‘Channel solutions’ case presented by Miller & Hawley 2000), thereby removing orientation and limb-darkening effects almost entirely. The dot-dashed and the dot-dot-dot-dashed lines on Fig. 4 show the predicted equivalent width in the case of no limb-darkening, assuming and , respectively222Note that, following the convention used in xspec, we have defined the equivalent width with respect to the continuum level at the energy where the line peaks in photon flux. For centrally concentrated disk illumination (i.e. very negative ), the iron line peaks at . Since the continuum flux is a strongly declining function of energy, the equivalent width of such a line can exceed the face-on value.. In this limiting case, we would expect to be sensitive to such a broad line for all Seyfert-like values of and .
To summarize, these data just begin to constrain the interesting regions of parameter space for any relativistic iron line component in NGC 4258. There are two possible reasons for our non-detection of a broad iron line. Firstly, such a line might be genuinely absent thereby setting NGC 4258 aside from its higher luminosity counterparts. Secondly, if NGC 4258 possesses a relativistically broad iron line with and limb-darkening is important, then we would not expect to detect this line with these data. However, we can rule out the presence of a relativistically broad iron line with and . Neither do these data allow a Seyfert-like line in which limb-darkening is unimportant.
5. The serendipitous sources
5.1. Q1218+472

The point source 7 arcmins to the west of NGC 4258 is readily identified with the quasar Q1218+472. By choosing a slightly smaller extraction radius than normal (2.5 arcmins), we can isolate the GIS counts from this source with relatively little contamination from NGC 4258. The resulting GIS background subtracted count rate is cps per detector. No temporal variability was observed in the resulting light curve, although the low count rate results in weak limits on possible variability. This source is not within the field of view of the SIS.
The two GIS spectra were fitted with a model consisting of a power-law subjected to both Galactic absorption (with a column of ) and intrinsic absorption with the redshift of the quasar. The resulting best fit parameters are and (see Fig. 5 for the confidence contours that result from this fit). The (observer frame) 2–10 keV flux is . Assuming a redshift of , a Hubble parameter of , and an acceleration parameter of , the rest-frame 2–10 keV luminosity of this source is . In computing the flux and luminosity, we have applied a correction factor of 1.5 to account for the smaller than usual extraction radius. This correction factor was estimated by extracting counts from other ASCA observations of bright Seyfert galaxies with various extraction radii.
While the flux and luminosity estimate are robust, the spectral results should be treated with caution since the GIS count rates for this source are below the threshold at which the ASCA Guest Observer Facility recommends spectroscopy. Combining our X-ray spectrum with the optical spectrum of Burbidge (1995), the spectral index between the (rest-frame) 2500Å and 2 keV emissions is . Thus, Q1218+472 is relatively X-ray bright given its optical flux.
5.2. The north-west source: a putative galaxy cluster

The northwest source aligns well with the extended ROSAT-PSPC source found by Pietsch et al. (1994; hereafter P94). P94 note a concentration of galaxies on a deep optical plate. By noting that the brightest galaxy is approximately 19 magnitude in the visual band, they estimate the redshift of the cluster to be .
Using standard extraction radii, we have extracted the GIS spectra and light curves for this source (note that this source, too, fell outside the SIS field of view). The GIS count rate was cps per detector. Given the possible identification of this source with a cluster of galaxies, we fit the spectrum with a thermal plasma model (MEKAL1 of Table 1) modified by Galactic absorption. We also allow the redshift of the cluster to be a free parameter. The best fit plasma temperature, relative abundance, and redshift are , and respectively. Figure 6 shows the two GIS spectra along with this best fit model. It can be seen that the model is a good fit to these data (with /dof=202/217). This X-ray determination of the cluster redshift relies on fitting the cluster iron emission line to a bump in the GIS spectrum at . Since instrumental GIS features are possible at these energies, this must be taken as tentative.
The observer-frame 2–10 keV flux of this source is . Assuming a cluster redshift of , a Hubble parameter of , and an acceleration parameter of , the rest-frame 2–10 keV luminosity of this source is . These results are completely consistent with the known relationship between cluster temperature and X-ray luminosity (e.g. Markevitch 1998). If, instead, this source is at the same distance as NGC 4258, the 2–10 keV luminosity is only .
6. Discussion and Conclusions
The X-ray spectrum of NGC 4258 shows 4 distinct components:
-
1.
a power-law component with a 0.5–10 keV luminosity of and photon index . This component is readily identified as the primary X-ray emission from the AGN central engine itself. This emission is absorbed by an intrinsic column density of . Note that this absorbing column is a factor of 1.4 smaller than that obtained by M94. Also note that our value of is insensitive to exactly which of the acceptable spectral models we use (cf. Gammie, Narayan & Blandford 1999; Chary et al. 2000).
-
2.
thermal plasma emission from optically-thin gas at a temperature of . The total luminosity of this component is , approximately 10–25% of the power-law luminosity (depending on how low in energy the power-law extends).
-
3.
a bremstrahlung component with . This component may represent thermal emission from a very hot gaseous component in the anomalous arms and/or the integrated hard X-ray emission of the X-ray binary population.
-
4.
a narrow fluroescent K emission line of cold iron with an equivalent width of .
We suggest that the bulk of the narrow iron emission line originates from the accretion disk. With this assumption, we have shown that the most of the line emission must originate at relatively large radii () in order to produce the small line width. This, in turn, implies a large X-ray source (with a size ), in contrast to the situation normally found in higher-luminosity Seyfert galaxies (e.g. Nandra et al. 1997). Note that a model in which the X-ray source is small () but the inner region of the disk are too hot/ionized to produce line emission has difficulty producing the observed equivalent width of the line. Thus, under the assumption that the bulk of the observed iron line originates from the accretion disk, there appears to be a clear difference in the size/structure of the X-ray source between this low-luminosity source and higher-luminosity Seyfert galaxies.
However, we cannot rule out the possibility that the narrow iron line originates from some previously undetected distant matter not associated with the accretion disk. If the observed line does originate from a non-disk source, our data are consistent with but do not require the presence of a “Seyfert-like” relativistic broad iron line. Even in this case, interesting constraints can be placed on the parameter space of possible relativistic broad iron lines.
This AGN is ripe for study with the new generation of X-ray observatories. The high spatial resolution of Chandra will allow us to study large scale structure in this source directly. We will be able to pinpoint the location and nature of the thermal component seen in our ASCA data. We will also be able to spatially separate emission from the anomalous arms, the X-ray binary population, and the AGN. High signal-to-noise spectroscopy with XMM (and, in the longer term, Constellation-X) will allow the inner accretion disk to be probed.
References
- (1) Anders E., Grevesse N., 1989, Geochim. Cosmochim. Acta, 53, 197
- (2) Armitage P. J., Reynolds C. S., 2000, submitted.
- (3) Arnaud M., Rothenflug M., 1985, A&AS, 60, 425
- (4) Blandford R. D., Begelman M. C., 1999, MNRAS, 303, L1
- (5) Burbidge E. M., 1995, A&A, 298, L1
- (6) Burbidge E. M., Burbidge G., 1997, ApJ, L13
- (7) Cecil G., Wilson A. S., De Pree C., 1995, ApJ, 440, 181
- (8) Chary R., Becklin E. E., Evans A. S., Neugebauer G., Scoville N. Z., Matthews K., Ressler M. E., 2000, ApJ, in press
- (9) Fabbiano G., Kim D.-W., Trinchieri G., 1992, ApJS, 80, 531
- (10) Fabian A. C. et al. 1995, MNRAS, 277, L11
- (11) Gammie C. F., Narayan R., Blandford R. D., 1999, ApJ, 516, 177
- (12) Ghisellini G., Haardt F., Matt G., 1994, MNRAS, 267, 743
- (13) Greenhill L. J., Henkel C., Becker R., Wilson T. L., Wouterloot J. G. A., 1995b, A&A, 304, 21
- (14) Greenhill L. J., Jiang D. R., Moran J. M., Reid M. J., Lo K. Y., Claussen M. J., 1995a, ApJ, 619
- (15) Herrnstein J. R., Greenhill L. J., Moran J. M., Diamond P. J., Inoue M., Nakai N., Miyoshi M., 1998, ApJL, 69
- (16) Herrnstein J. R. et al., 1999, Nat, 400, 539
- (17) Ichimaru S., 1977, ApJ, 214, 840
- (18) Kaastra J. S., 1992, in An X-ray Spectral Code for Optically Thin Plasmas (Internal SRON-Leiden Report, updated version 2.0)
- (19) Lasota J.-P., Abramowicz M. A., Chen X., Krolik J., Narayan R. 1996, ApJ, 462, 142
- (20) Makishima K. et al., 1994, PASJ, 46, L77
- (21) Makishima K. et al., 1996, PASJ, 48, 171
- (22) Maloney P. R., Begelman M. C., Pringle J., 1996, ApJ, 472, 582
- (23) Markevitch M., 1998, ApJ, 504, 27
- (24) Mewe R., Gronenschild E. H. B. M., van den Oord G. H. J, 1985, A&AS, 62, 197
- (25) Mewe R., Lemen J. R., van den Oord G. H. J, 1986, A&AS, 65, 511
- (26) Miller K. A., Stone J. M., 2000, ApJ, in press
- (27) Miyoshi M, Moran M., Herrnstein J., Greenhill L., Nakai N., Diamond P., Inoue M., 1995, Nat, 373, 127
- (28) Nakai N., Inoue M., Miyoshi M., 1993, Nat, 361, 45
- (29) Narayan R., Yi I., 1995, ApJ, 452, 710
- (30) Narayan R., Yi I., 1994, ApJ, 428, L13
- (31) Nandra K., George I. M., Mushotzky R. F., Turner T. J., Yaqoob T., 1997a, ApJ, 476, 70
- (32) Neufeld D. A., Maloney P. R., 1995, ApJ, 447, L17
- (33) Novikov I. D., Thorne K. S., 1973, in Black Holes, eds C. DeWitte & B. S. DeWitte (Gordon and Breach Science Publicaters, New York), P.344
- (34) Pietsch W., Vogler A., Kahabka P., Klein U., 1994, A&A, 284, 386
- (35) Ohasi T. et al., 1996, PASJ, 48, 157
- (36) Pringle J.E., 1996, MNRAS, 281, 857
- (37) Quataert E., Gruzinov A., 1999, ApJ, 520, 248
- (38) Rees M. J., 1982, in Riegler G., Blandford R. D., eds, The Galactic Center, Am. Inst. Phys., New York, p.166.
- (39) Shakura N. L., Sunyaev R. A., 1973, A&A, 24, 337
- (40) Tanaka Y. et al., 1995, Nat, 375, 659
- (41) Turner T.J., George I. M., Nandra K., Turcan D., 1999, ApJ, 524, 667
- (42) Vogler A., Pietsch W., 1999, A&A, 352, 64
- (43) Yamashita A., 1997, IEEE Trans. Nucl. Sci., 44, 847