Confusion errors in astrometry and counterpart association
Abstract
In very crowded fields, the modulation of the background by the sea of unresolved faint sources induces centroid shifts. The errors increase with the number of sources per beam. Even the most optimistic simulations of imaging data show that position errors can become severe (on the order of the beam size) at flux levels at which images contain 1/50 to 1/15 sources per beam, depending on the slope of the number-flux relation . These problems are expected to be significant for recent observations of faint submillimeter sources and may be the reason that some sources appear to lack optical counterparts.
1 Introduction
Fainter is (usually) better when it comes to star and galaxy counts. However, there are fundamental limits to faint imaging from confusion which cannot be overcome by increasing exposure times alone. The sea of unresolved sources fainter than the detection limit creates a noise in the sky, which does not improve with more data.
Many of the issues associated with this confusion noise have been discussed before (eg, Scheuer 1957; Condon 1974; Franceschini 1982; Hacking & Houck 1987; Barcons 1992), however the large number of present-day observations that are or soon will be pushing this confusion limit suggests a new discussion. In particular, in recent years there has been a concerted effort to produce very deep, multi-wavelength studies of blank sky in order to identify extragalactic sources as comprehensively as possible. These studies have been very successful, identifying populations of radio-, submillimeter-, infrared-, visual- and x-ray-bright galaxies and associating them with their counterparts in other bands (Djorgovski et al 1995; Williams et al 1996; Hogg et al 1996; Rowan-Robinson et al 1997; Richards et al 1998; Hughes et al 1998; Barger et al 1998; Eales et al 1999; Aussel et al 1999; Elbaz et al 1999; Gardner et al 2000; Brandt et al in preparation; Dickinson et al in preparation). Some of the faintest sources in some of the most crowded fields (in the sense of number of sources per resolution element) have not shown clearly distinguished counterparts at other wavelengths (Hughes et al 1998; Smail et al 1998; Barger et al 1999b). This raises the question “could confusion be playing a role?”
This paper is a first attempt at characterizing position shifts due to confusion in astronomical images. Simulated images of crowded fields are presented, made in the most optimistic way: no photon noise, a perfectly understood gaussian point spread function or beam shape, pointlike sources, a power-law number–flux relation of known slope, and no angular clustering. Even with these optimistic inputs, the resulting images show that it is impossible to accurately measure positions and fluxes of sources that are more than an order of magnitude brighter than the flux level corresponding to one source per beam (a beam being one resolution element in the image). Recent work making use of the limit “one source per beam” (eg, Blain et al 1998) is therefore overly optimistic.
The standard rule-of-thumb is that confusion becomes important at 1/30 of a source per beam. It is possible to get information from the statistics of the background noise fainter than the level of 1/30 source per beam (eg, Scheuer 1957; Condon 1974), but in terms of identifying and measuring individual sources, 1/30 is regarded as the limit. This paper tests the rule-of-thumb for confusion-induced astrometry errors, which are particularly important for deep, multi-wavelength studies, in which counterpart identification across multiple data sets is important. Astrometric shifts due to confusion have been predicted and observed in the context of microlensing data (Goldberg 1998; Goldberg & Woźniak 1998) and are expected to limit future stellar astrometry experiments (Yu et al 1993; Rajagopal & Allen 1999).
For the purposes of this paper a “beam” is taken to be the solid angle of the -radius circle of the gaussian point spread function, or . Note that for a gaussian, where is the angular full width at half-maximum of the point spread function. The number of sources per beam at a given flux level is the integrated number of sources in an image brighter than flux divided by the number of beams in the solid angle of the image or .
2 Method and analysis
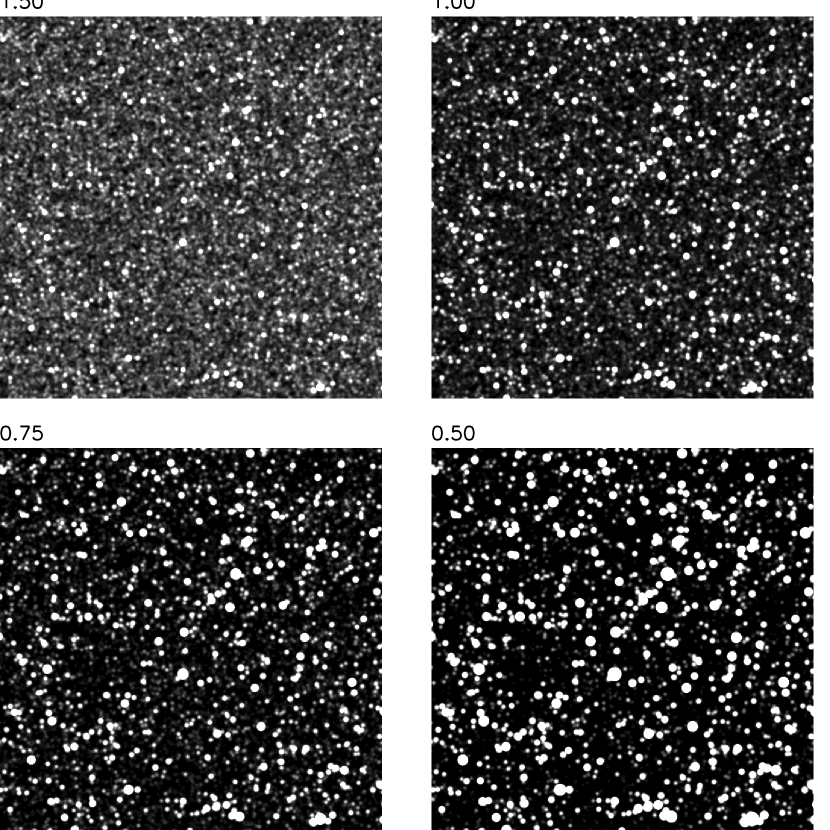
Four pixel artificial images were made with sources randomly distributed over the image (and in fact over an area larger than the image so that image edges are realistic). The sources were randomly assigned fluxes in power-law distributions where , , , and , one value of per image. Positions were randomly assigned and were not quantized onto the pixel grid. The point-spread function was chosen to be perfectly gaussian with pixels, so that it is well sampled. Each image contains beams. The artificial source catalogs were truncated at sources per beam, ie, at much higher angular density than the sources per beam rule-of-thumb. The four artificial images are shown in Figure 1
No noise was added to the images; the sources are not extended beyond the gaussian beam shape; and the sources were not given any angular clustering. The artificial images represent high optimism.
The background levels in the four images were fit by sigma-clipping (ie, iteratively removing outlier pixels) at 3-sigma and they were subtracted from the images. Although the input background levels were zero, the fit levels are above zero for all of the images because of the integrated flux from all the unresolved sources. In almost all real observations but especially at wavelengths longer than the near-ultraviolet (ground-based) or visual (space-based), images contain large DC levels from sky emission or telescope thermal emission so the true background (or, more accurately, foreground) is unknown and must be fit by a procedure similar to the sigma-clipping used here. For , the background levels do not converge, in the sense that the background light is dominated by the faintest sources, and in these artificial images the background level is just set by the depth to which the artificial source catalogs are simulated. However, experiments involving changing this depth show that the confusion noise or level of background modulation in the artificial images has converged.
Note that the sigma-clipping background estimation technique is equivalent to (although less subjective than) estimating the background from regions of the image that appear empty or blank.
At each location of a source in the artificial source catalog, a centroid is found in the artificial image in a box of side length centered on the artificial source location in the catalog. These centroids are what will be referred to as the “measured” positions.
The catalog was trimmed to only “isolated sources”: The source positions measured by centroiding are in general shifted from the true positions in the artificial source catalog; sometimes this is because there is a brighter source nearby that is blending with the fainter source of interest, sometimes this is just because the source is projected onto the roiling sea of unresolved, fainter sources. Only the latter effect is properly an effect of confusion noise. For this reason, sources with measured positions closer than from a brighter source were dropped from the analysis that follows. This restriction to “isolated” sources (excluding faint sources found to be near brighter sources) removes many of the largest deviations of measured from true positions, especially for the artificial images with , where bright sources dominate.
The centroid errors for the isolated sources, in units of the beam’s half-width at half maximum (HWHM) are shown in Figure 2 as a function of the source density, or number of sources per beam . Really these are measured as a function of flux, but since source density increases with decreasing flux limit, the quantities are interchangeable; each point is plotted at the source density which would be found in a source catalog made down to a limit equal to that source’s flux. A running median and a running 90 percent level are also shown. The results are dramatic. For , which is the typical count slope for submillimeter sources or nearby stars, measured source positions are occasionally (10 percent of the time) displaced from their true source positions by a significant fraction of the half-power point of the beam at ; such displacements are common at . These problems are alleviated as the counts become less steep; at (the typical count-slope for faint visual and infrared sources), the worst 10 percent of positions are displaced by the HWHM at . Recall that these numbers (and Figure 2) are computed only for isolated sources, as defined above.
Crowding-induced centroid shifts have been observed in some microlensing events: As a faint lensed star becomes brighter, its apparent position shifts towards its true position because confusion noise becomes less important (Goldberg 1998; Goldberg & Woźniak 1998).
For each measured source, the gaussian beam shape is fit to the peak in a square box of side length centered on the measured centroid. This provides a measured flux. The measured and true fluxes are compared in Figure 3. Again the results are shown in terms of source density rather than flux level. The flux errors become bad at roughly the same source per beam levels as the position errors. Note also that at the faint end there is a bias in the median flux error, caused by the subtraction of a finite background from the images. This bias will exist in all observations that are analyzed after background subtraction (all visual and near-infrared images) and all observations made with chopping (many infrared and submillimeter images).
3 Discussion of assumptions
As has been emphasized, this study makes use of very optimistic assumptions about the properties of the imaging data. An experiment was performed to test one of these assumptions: the perfectly gaussian beam. An image was made by “beam switching” with a nod of so that the beam consists of a central positive gaussian flanked by two negative gaussians of half the power but the same FWHM separated by angles of on either side. These parameters were chosen to roughly match typical submillimeter observing strategies (eg, Eales et al 1999). In these artificial beam-switched images, at constant source density, the median positional errors are typically percent worse at and a factor of worse at , relative to the images made with the single gaussian beam. Pure gaussian beam may therefore be an unrealistically optimistic assumption, although it is close to correct for atmosphere-limited visual and near-infrared observations.
The assumption of point-like or non-extended sources is overly optimistic in ground-based and space-based optical imaging, where recent data is not, by and large, confusion limited. It is probably not a problem for recent submillimeter observations, which have a beam with arcsec. Unfortunately, a proper treatment of the effects of finite source sizes involves modeling distributions of sizes, radial profiles and shapes, all as a function of flux; this is outside the scope of this work.
The assumption that sources are unclustered is probably optimistic for virtually all deep imaging observations. Clustering becomes important whenever the angular correlation length is larger than or on the order of the beam size (eg, Barcons et al 1992), which is true for virtually all optical and near-infrared imaging. This condition is probably also met for the submillimeter sources, although at present the numbers of sources are too small for a direct measurement. Again, a full treatment requires parameterization of the angular clustering and its dependence on flux.
The assumption of power-law number–flux relation must be incorrect in detail, in the sense that the integrated flux from sources in a power law diverges either at the faint or bright end (or both). In particular, the models presented here diverge in terms of total flux (although not in terms of fluctuations) at the faint end. Experiments of varying the depth to which the artificial source catalogs go have not shown significant changes in the error distributions. The errors are not dominated by the very faintest sources; they are dominated by the sources with fluxes which fall between the flux of the source in question and the level at which there is source per beam. It is the number–flux relation in this region only which is important to the confusion noise.
4 Detected sources
Perhaps the single most unrealistic assumption is that the true source positions are known in advance; ie, the measurement of centroid shifts, above, was performed by taking centroids in the vicinities of the true source positions. This assumption is extremely optimistic, because in a real astronomical project, sources are usually detected ab initio, with no prior knowledge of their positions.
To test the influence of this optimistic assumption, sources were detected in the the simulated images with DAOPHOT (Stetson 1987) and matched, after detection, to the true source positions. This matching is not unique; since position shifts are large, there are many faint “detected” sources which could potentially be matched with each of the faint “true” source positions, and vice versa. To reduce this ambibuity, the detected source flux can be compared with the true flux. Figure 4 shows the positional errors between detected and true sources as a function of detected source density.
The detected sources were matched to the true source positions by taking, for each detected source, the closest true source with its flux between 0.67 and 1.33 of the detected source flux. This choice is admittedly arbitrary, but it represents a cut equivalent to something like 3-sigma. At bright limits, the flux cut does not affect the results, but at faint levels, where for every detected source there are several true source candidates, this cut does affect the positional errors. Figure 4 shows that the positions obtained by detection with no prior information are indeed worse than those obtained with the a priori knowledge. This further strengthens the statement that the confusion effects shown in this paper are in fact far less severe than in any real astronomical experiment.
5 Discussion of recent data
The deepest recent ground-based visual and near-infrared observations of blank sky are not confusion limited (eg, Djorgovski et al 1995; Hogg et al 1997). However, since they are in the region of sources per beam, it does not make sense to perform deeper imaging until wide-field, ground-based adaptive optics can be used. Radio imaging has been confusion limited for some time (eg, Condon 1974) so investigators are usually careful to truncate analyses before confusion noise becomes destructive. In all these fields of astronomy, telescope time is better spent increasing field area than depth. Although until the launch of Chandra essentially all deep x-ray imaging was confusion limited (eg, Barcons 1992), present-day space-based x-ray and optical imaging is not yet at the confusion limit (Williams et al 1996; Brandt et al in preparation). This may change with planned future instrumentation and exposures.
Unfortunately, several recent publications on faint mid-infrared and submillimeter sources have ignored confusion as a possible source of error and are beyond the confusion limit. This is particularly serious since the number count slopes are very steep () both observationally and according to simple models (Hughes et al 1998; Blain et al 1998; Barger et al 1999a; Aussel et al 1999; Elbaz et al 1999). One study shows sources to (Hughes et al 1998) and others show sources to (Smail et al 1998; Eales et al 1999). The ISO counts at have been pushed to (Aussel et al 1999). The fact that a significant fraction of the submillimeter sources show no striking visual counterparts is not at all surprising; the submillimeter positions will be shifted from their true positions by more than the HWHM or 7.4 arcsec. The authors generally consider only a region of radius where is the estimated signal-to-noise ratio of the detection; these radii are generally 2 to 4 arcsec (Hughes et al 1998; Smail et al 1998; Barger et al 1999b). The results of the analysis presented here suggests that these authors should be looking in a region a factor of 4 to 10 larger in solid angle.
It might be hoped that confusion is not so destructive because perhaps the true mid-infrared and submillimeter source number–flux relations are not nearly as steep as what is measured and modeled. However, if so, many of the faintest reported sources must truly be spurious. One phenomenological model (Barger et al 1999a) shows the number–flux relation flattening just below the faintest detected sources, but it does not flatten quickly enough to solve the confusion problem. Future imaging efforts would be better spent increasing field area than exposure times, and counterparts ought to be sought in large error boxes.
A recent comprehensive review (Blain et al 1998) estimates the flux levels at which future ground- and space-based infrared through radio surveys will become confusion limited, using the incorrect criterion of source per beam. Their limiting flux levels become more realistic when multiplied by a factor of to to bring the surface densities down to the confusion noise limits presented here.
Another area in which deep imaging in crowded fields is necessary is studies of the Galactic center (eg, Eckart & Genzel 1997; Genzel et al 1997; Ghez et al 1998). In these studies, accurate astrometry is needed not just for identifying counterparts at other wavelengths, but also for measuring proper motions, on the basis of which the central black hole mass is estimated. Current analyses of the Galactic center go to more crowded depths than sources per beam in the central . It may be important for the Galactic center investigators to show that the large proper motions they observe are truly the motions of individual bright stars and not seriously affected by many small motions in the underlying sea of unresolved sources. If the detected motions have a significant confusion-induced component, it can be predicted that the stellar accelerations will deviate significantly from their gravitational expectations. This prediction may already have been falsified, at least at bright levels (Ghez et al 2000).
6 Conclusions
For typical faint imaging in the visual and near-infrared, in which number counts have the form with , the confusion limit rule-of-thumb that imaging should not be pursued much fainter than sources per beam is essentially correct, both for obtaining good positions and good photometry. Optimistic simulations show that positions and fluxes of sources more numerous than this condition are likely to have large uncertainties. When number counts are steep, with Euclidean or steeper, the problem is even more severe and a better rule-of-thumb is something like .
Source identifications in one set of imaging data based on detections in another set will be affected by these confusion-induced astrometry errors. It is essential that surveys working near the confusion limit perform realistic simulations (which include the sources well faint of any detection limits) in order to draw conservative positional error boxes for source identification.
References
- (1) Aussel H., Cesarsky C. J., Elbaz D., Starck J. L., 1999, A&A, 342, 313
- (2) Barcons X., 1992, ApJ, 396, 460
- (3) Barger A. J., Cowie L. L., Sanders D. B., Fulton E., Taniguchi Y., Sato Y., Kawara K., Okuda H., 1998, Nature, 394, 248
- (4) Barger A. J., Cowie L. L., Sanders D. B., 1999a, ApJ, 518, L5
- (5) Barger A. J., Cowie L. L., Smail I., Ivison R. J., Blain A. W., Kneib J.-P., 1999b, AJ, 117, 2656
- (6) Blain A. W., Ivison R. J., Smail I., 1998, MNRAS, 296, L29
- (7) Condon J. J., 1974, ApJ, 188, 279
- (8) Djorgovski S. et al, 1995, ApJ, 438, L13
- (9) Eales S., Lilly S., Gear W., Dunne L., Bond J. R., Hammer F., Le Fèvre O., Crampton D., 1999, ApJ, 515, 518
- (10) Eckart A., Genzel R., 1997, MNRAS, 284, 576
- (11) Elbaz D. et al, 1999, A&A, 351, L37
- (12) Franceschini A., 1982, Ap&SS, 86, 3
- (13) Gardner J. P. et al, 2000, AJ, 119, 486
- (14) Genzel R., Eckart A., Ott T., Eisenhauer F., 1997, MNRAS, 291, 219
- (15) Ghez A. M., Klein B. L., Morris M., Becklin E. E., 1998, ApJ, 509, 676
- (16) Ghez A., Becklin E. E., Kremenek T., Tanner A., 2000, Nature, 407, 349
- (17) Goldberg D. M., 1998, ApJ, 498, 156
- (18) Goldberg D. M., Woźniak P. R., 1998, Acta Astronomica, 48, 19
- (19) Hacking P., Houck J. R., 1987, ApJS, 63, 311
- (20) Hogg D. W., Pahre M. A., McCarthy J. K., Cohen J. G., Blandford R., Smail I., Soifer B. T., 1997, MNRAS, 288, 404
- (21) Hughes D. H. et al, 1998, Nature, 394, 241
- (22) Rajagopal J., Allen R. J., 2000, in Working on the Fringe: An International Conference on Optical and IR Interferometry from Ground and Space, eds. Unwin S., Stachnik R., ASP Conference Series, in press
- (23) Richards E. A., Kellerman K. I., Fomalont E. B., Windhorst R. A., Partridge R. B., 1998, AJ, 116, 1039
- (24) Rowan-Robinson M. et al, 1997, MNRAS, 289, 490
- (25) Scheuer P. A. G., 1957, Proc. Camb. Phil. Soc., 53, 764
- (26) Stetson, P. B. 1987, PASP, 99, 191
- (27) Smail I., Ivison R. J., Blain A. W., Kneib J.-P., 1998, ApJ, 507, L21
- (28) Williams R. E. et al, 1996, AJ, 112, 1335
- (29) Yu J. W., Shaklan S. B., Shao M., 1993, Proc. SPIE, 1947, 209