CURRENT STATUS OF COSMOLOGICAL MDM MODELS
An analysis of cosmological models in spatially flat Friedmann Universe with cosmic gravitational wave background and zero -term is presented. The number of free parameters is equal to 5, they are , , , , and . The normalization of the spectrum of density perturbations on galaxy cluster abundance () has been used to calculate numerically the value of the large scale CMB anisotropy () and the relative contribution of cosmological gravitational waves T/S. Increasing weaken the requirements to the value of T/S, however even for the models with suggest considerable abundance of gravitational waves: T/S. In models with and scale-invariant spectrum of density perturbations (): T/S. Minimization of the value T/S is possible only in the range of the red spectra () and small (). It is shown that the models with T/S admit both moderate red and blue spectra of density perturbations, , with rather high abundance hot dark matter, . Any condition, or , decreases the relative amplitude of the first acoustic peak for more than 30 in comparison with its hight in the standard CDM normalized by COBE data.
1 Model description
We considered a family of models with the following free parameters:
-
•
, (15 models with step 0.01);
-
•
, (7 models with step 0.1);
-
•
, (5 models with step 0.1);
-
•
, (6 models with step 0.02);
-
•
, (6 models with step 0.05).
We use the analytic approximation of the transfer function by Novosyadlyj et al (1998). Altogether we have 18900 variants of the model. The derived parameters are abundance of the cold matter, , and the contribution of tensor mode to large-scale CMBR anisotropy, T/S. Our goal is to constrain the model parameters by data of the mass function of galaxy clusters and anisotropy in both large () and small () angular scales.
2 Mass function of galaxy clusters
The number of massive halos with the mass larger then is calculated with help of Press-Schechter formalism. Observational data are taken from Bahcall & Cen paper .
The analysis allows us to delimit the amplitude of the power spectrum at cluster scale with high accuracy, ; taking into account the uncertainties of the Press-Schechter approximation and experimental systematics enhances the total errorbar by a value of , . Other parameters () are not constrained within their ranges by the cluster data.
3 CMBR Anisotropy
The contribution of cosmic gravitational waves into the large-scale CMBR anisortopy is estimated by the T/S parameter:
where S is the contribution of the perturbations of matter density normalized by :
and are the normalization constant and DMR window function, respectively. The accuracy of this approximation is better than , the harmonics with ensure the dominant contribution. The result of calculation of T/S is presented in Fig.1.
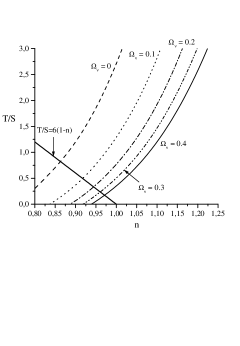
The value T/S icreases linearly with and decreases with growing, therefore the curves T/S with the maximum parameter can be used to put the lower limit on T/S (see Conclusions).
Taking a moderate T/S and nearly flat power spectrum (), we put an upper limit on the Hubble constant, , and lower limit on the hot dark matter abundance, . However, the hardest constraint for the parameter can be got when we confront the amplitude of the first acoustic peak in () with the observational data.
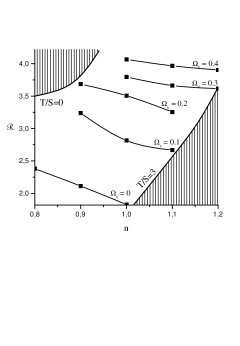
We compare the hight of the acoustic peak generated in our models with its value in the standard CDM (without gravitational waves) normalized by the COBE data. The parameter for such a comparison is the relative amplitude of the peak, , where ; for sCDM.
Evidently, decreases with T/S growing (and other parameters fixed). E.g. for CDM models ( and ’standard’ values for and ) the relative amplitude of the acoustic peak decays by a factor T/S.
The more efficient ways to enhance the acoustic peak is a transition to the ’red’ power spectra and/or high abundance of the hot matter. The role of the ’blue’ spectra becomes important when the parameter rises up (since the ’red’ spectra will violate the condition T/S). The results of the derivation are presented in Fig.2. The condition for a ’considerable’ acoustic peak () with the standard BBN constraint for the baryonic density, leaves us with a broad set of the power spectra () but requires high fraction of the hot matter () in the class of the models considered.
4 Conclusions
-
•
The data on the galaxy cluster abundance determine the value with a high accuracy, the other parameters () remain free within their ranges.
-
•
None of the MDM models with and T/S satisfies both normalizations, on the galaxy cluster abundance and large-scale anisotropy, which leads either to rejection from the flat spectrum or to the introduction of a non-zero T/S (or both).
-
•
Small values of T/S are realised for the red spectra () and moderate , the violation of these conditions leads to a high T/S().
-
•
Increasing weaken the requirement to the value of T/S, however even for the models with suggest considerable abundance of gravitational waves: T/S.
-
•
In models with and scale-invariant spectrum of density perturbations (): T/S.
-
•
In models with and we have the following approximation for the primordial gravitational waves (the accuracy is better than 11 % for T/S):
-
•
In double-normalized models with T/S0 the hight of the acoustic peak is less than its ‘standard’ value (). The deacrease of the parameter does not exceed 30% in models with large and any spectrum slope, . Any condition, or , decreases the relative amplitude of the first acoustic peak for more than 30 (i.e. in models with , ). The acoustic peak practically disappears in CDM models.
-
•
When increasing the baryonic abundance the difference between in our models and that in sCDM decreases. The amplitude of the acoustic peak coincides with its ’standard’ value () in models with and either ’blue’ spectrum and , or moderate ’red’ spectrum and .
-
•
Thus, rising the parameter up to the values in the interval solves the problem of the first acoustic peak in , leaving the baryonic density within the primordial nucleosynthesis constraints.
Acknowledgments
The work was partly supported by Swiss National Foundation (SNSF 7IP 050163.96/1), INTAS grant (97-1192), and Russian Foundation “Development and Support of Radioastronomy Scientific and Educational Center” (N 315). E.V.M., V.N.L. and N.A.A. are grateful to the Organizing Commeittee for the hospitality.
References
References
- [1] B. Novosyadlyj, R. Durrer, V.N. Lukash, A&A 347, 799 (1999).
- [2] W.H. Press, P. Schechter, ApJ 187, 425 (1974).
- [3] N.A. Bahcall, R. Cen, ApJ 407, L49 (1993).
- [4] V.R. Eke, S. Cole, C.S. Frenk, MNRAS 282, 263 (1996).
- [5] S. Borgani, M. Girardi, R.G. Carlberg, astro-ph/9907323.