Imaging of the protoelliptical NGC 1700 and its globular cluster system
Abstract
An excellent candidate for a young elliptical, or ‘protoelliptical’ galaxy is NGC 1700. Here we present new , and band imaging using the Keck telescope and reanalyse existing and band images from the Hubble Space Telescope. After subtracting a model of the galaxy from the Keck images NGC 1700 reveals two symmetric tidal tail-like structures. If this interpretation is correct, it suggests a past merger event involving two spiral galaxies. These tails are largely responsible for the ‘boxiness’ of the galaxy isophotes observed at a radius of kpc.
We also show that the colour distribution of the globular cluster system is bimodal. The mean colour of the blue population is consistent with those of old Galactic globular clusters. Relative to this old, metal poor population, we find that the red population is younger and more metal rich. This young population has a similar age and metallicity as that inferred for the central stars, suggesting that they are both associated with an episode of star formation triggered by the merger that may have formed the galaxy. Although possessing large errors, we find that the majority of the age estimates of NGC 1700 are reasonably consistent and we adopt a ‘best estimate’ for the age of Gyr. This relatively young age places NGC 1700 within the age range where there is a notable lack of obvious candidates for protoellipticals. The total globular cluster specific frequency is rather low for a typical elliptical, even after taking into account fading of the galaxy over the next 10 Gyr. We speculate that NGC 1700 will eventually form a relatively ‘globular cluster poor’ elliptical galaxy.
keywords:
galaxies: elliptical – galaxies: individual – galaxies: evolution – galaxies: structure1 Introduction
Merging is now thought to be a key process in the evolution of galaxies. The hypothesis that two colliding spiral galaxies will eventually form an elliptical galaxy (?) has gained much observational and theoretical support over the years. The ‘smoking gun’ of this type of merger is the presence of two tidal tails, formed from the progenitor’s discs. A number of well known examples are found in the local Universe, such as The Mice, The Antennae, Arp 220, NGC 3256 and NGC 7252. For such galaxies a variety of methods are available (e.g. spectroscopy of the stellar populations, dynamical measurements, comparison with models etc.) to estimate the time since the merger occurred. The derived ages, for these classic tidal tail systems, is up to 1–2 Gyr since nuclear coalescence. It was Ivan King in 1977 who first pointed out the general lack of obvious candidates for older merger remnants (i.e. 2–5 Gyr old). These galaxies have been referred to as ‘King gap objects’ or protoellipticals. Identifying, and age dating, these protoellipticals could provide the missing link between late stage spiral mergers and elliptical galaxies.
Indeed, a crucial step in testing the merger hypothesis would be to show an ‘evolutionary consistency’, i.e. that spiral mergers and protoellipticals evolve to have the same energetic, structural, dynamical and chemical properties as normal, old ellipticals. This has been problematic due to the difficulty of estimating the age of old stellar populations, without telltale morphological signatures such as tidal tails. Recently, several different methods have become available. These include breaking the age–metallicity degeneracy with spectral synthesis (e.g. ?) and new models (e.g. ?), quantifying optical fine structure (?) and using the colours of globular clusters (e.g. ?).
An ideal candidate for a nearby protoelliptical is NGC 1700. It possesses a kinematically distinct core (Franx, Illingworth & Heckman 1998a), reveals evidence for extensive morphological disturbance (?) and it has a high rotational velocity to velocity dispersion ratio, relative to other ellipticals (Bender, Burstein & Faber 1992). As well as being a possible protoelliptical, it offers the opportunity to compare various age estimates. For example, age estimates can be made from its two faint tidal tails, optical fine structure, globular cluster colours, kinematic structure, and its stellar component.
We have adopted the same distance to NGC 1700 as ?, i.e. 51.4 Mpc (which includes a correction for Virgocentric infall and assumes km s-1 Mpc-1). This corresponds to 249 pc per arcsec. The total band magnitude for NGC 1700 is (RC3:?). It is classified as an E4 elliptical in the RC3 and E3 in the RSA. Photometric studies have been carried out by Franx, Illingworth & Heckman (1998b) and ?. A recent kinematic study is that of Bender, Saglia & Gerhard (1994).
In this paper we reanalyse Hubble Space Telescope (HST) WFPC2 , images and present new Keck , and images. We focus on the morphology of the galaxy and photometry of the globular cluster system, both of which provide new age estimates. We compare our age estimates with a variety of alternative methods and discuss the implications of our results for the formation and evolution of elliptical galaxies.
2 Observations and initial data reduction
2.1 Keck data
New , and images of NGC 1700 were obtained using the 10 m Keck–I telescope at the W. M. Keck Observatory, Mauna Kea, Hawaii. The observations were carried out on 1997 September 30th, with seeing in each filter of arcsec. The LRIS instrument was used with the Tek CCD, giving a rectangular field–of–view of arcmin and a pixel scale of 0.215 arcsec pixel-1. A single long (600 s) exposure was taken in and filters and two 600 s exposures were taken in the band. We also took a short (10 s) exposure in each filter. For the purpose of photometric calibration we obtained exposures in each filter of the field SA98 from ?.
The data were reduced in a standard manner using iraf software. After bias subtraction there remained a small offset between the two halves of the CCD. This is due to the dual amplifier mode of the CCD read-out. This effect is reasonably well approximated by a step function which varies perpendicular to the read-out direction. The bulk of this offset was successfully removed after division by the normalised flat-field. A small offset ( per cent) remained, which was corrected for by multiplying one side by a factor determined by taking the mean values of several sky regions either side of the offset. This successfully removed the offset for most of the image. However, an offset remained in the bright regions at the very centre of the galaxy ( few arcsec). This may be due to some non-linearity in the gains of the amplifiers at high count rates (as suggested in the LRIS manual). This problem clearly affects galaxy photometry in the inner regions but as described below, does not affect standard star or globular cluster (GC) photometry.
Photometric calibration was performed using our standard star exposures of SA98 and the photometric measurements of ?. The resulting rms error in the final photometry is mag in all three bands. K-correction and Galactic extinction were included using the same values for NGC 1700 as in ?, 0.18, 0.11 and 0.07 in the , and bands respectively. In order to investigate the random errors on our zeropoints we compared the measurements for the same stars that appear in each pointing. We found a random error of mag. To better quantify the systematic error due to the dual amplifier offset, we compared the mean zeropoints for the stars on the left and stars on the right of the offset in the same frame. We found a systematic error due to the offset of mag.
3 Data analysis
3.1 HST data
The and band HST data of NGC 1700 were obtained from proposal G0–5416 in the HST archive. Photometry of the GCs in NGC 1700 has been discussed by ?. Here we reanalyse the HST data, and use the results to aid with GC selection in our Keck data.
We performed the photometry in 2 pixel radius apertures with sextractor (?), applying the aperture correction given by ? and the calibration and transformation to Johnson magnitudes following ?.
From the initial object list of 383 sources detected by sextractor we applied the following selection criteria: The magnitude range was restricted to be , the faint limit chosen to avoid introducing colour bias effects due to lack of completeness. Galactic GCs at the distance of NGC 1700 are expected to be at magnitudes of . However, in order to account for the possible presence of a younger population of GCs that might be up to mag brighter than those in the Milky Way, we relaxed our bright limit to be .
The object colours were restricted to (which is roughly equivalent to ). Our typical error is in magnitude and in colour. Finally we carried out a careful visual check of the objects on the image display in order to remove point-like or galaxy-like objects. The final list contains a total of 146 GCs from all 4 WFPC2 chips.
3.2 Keck data
3.2.1 Galaxy morphology
In order to better reveal the fine structure present within NGC 1700 it is necessary to subtract off a model of the underlying galaxy. All modelling was performed using the isophote package in stsdas (e.g. ?). We initially constructed a model for the purpose of sky subtraction. Elliptical isophotes were fitted with a fixed centre and employing a 3- clipping algorithm. The ellipticity and position angle of the isophotes were allowed to vary freely. A pixel mask file was also constructed to explicitly mask out stars and pixel defects. We were unable to perform fits for the long exposure images at small radii because the central regions were saturated. For these images we set the initial fit radius beyond the saturated region. The fits were allowed to progress outwards until constraints on signal to noise terminated the process. Sky subtraction was performed in a similar way to that detailed in ?, i.e. the model intensity profiles in the outer parts of the galaxy were fitted by a power-law in order to accurately determine the sky level. The appropriate level was then subtracted from each image. The sky-subtracted images were then re-modelled in an identical way to before, to reveal the structure within the body of the galaxy. The models typically reached out to a distance of arcsec (45 kpc) from the galaxy centre.
Our fits extend significantly further from the centre than the imaging of either ? or ?. Using the short exposure image, we estimate a total band magnitude for the galaxy of , in excellent agreement with that given by the RC3 of 12.01. We also estimate a total magnitude of which agrees reasonably well with the RC3 value of 11.10, and a total magnitude of compared with 9.87 from ?.
We show in Fig. 1 the radial profiles of the ellipticity, position angle (PA), third cosine term (C3) and the fourth cosine term (C4) of the fitted isophotes for the short band image. All radii are expressed in terms of ‘equivalent radius’, , where is the major axis radius and is the isophote ellipticity. The C4 term is perhaps the most interesting of a Fourier series which expresses the deviations from a pure ellipse at a given radius. This term describes whether the isophotes are discy (C4 is positive) with excess light along the major and/or minor axes, or boxy (C4 is negative), representing excess light at 45° with respect to these axes. There is good agreement between the shape and absolute values of our data and that of ? and ?. The slight discrepancies at small radii are almost certainly due to seeing effects. Our profiles in and were similar in both shape and absolute value to that in the band.

3.2.2 Globular cluster sample selection and photometry
As with the HST data, potential GC candidates were detected in the Keck images using the sextractor program. sextractor provides measures of FWHM, ellipticity and an indication of whether an object was ‘pointy’ (star-like) or extended (galaxy-like). We found 615 candidates in common between the , and band images. Using this object list, we performed photometry with the iraf task phot . After a curve of growth analysis on several sources we determined an optimum aperture size of 8 pixels with a suitable background annulus of 15 to 20 pixels. In order to check the photometry and to determine suitable selection criteria, we examined the 34 sources in common between the band Keck image and our final band HST globular cluster list. Similarly, 14 candidates were found in common between our final HST list and the Keck band image. Although there was large scatter between the HST and Keck photometry at faint magnitudes, there was no obvious systematic bias. Our selection criteria are determined from the sample of 34 band sources in common between the HST and the Keck frames. Due to HST’s high spatial resolution, we are confident that the vast majority of sources that appear in the final HST list are bona fide GCs and hence use them to refine our Keck candidate list.
The following criteria were applied to the 615 objects in common between the Keck , and frames: (a) , (b) (c) ellipticity . These selection cuts are shown in Fig. 2. As with our HST magnitude selection, the bright limit was chosen to include a population of young GCs while excluding bright foreground stars. Our faint magnitude cut-off was chosen in order to avoid introducing any colour bias into our results. After magnitude selection, 507 candidate GCs remained in our sample.

The selection using the sextractor FWHM and ellipticity measures excluded a further 30 sources. These selection cuts were based on the shape parameters observed for the GCs in common with the HST list. We also excluded a further 25 sources because their or centre positions as determined by phot deviated from those originally found by sextractor by more than 2 pixels, and were thus liable to be misidentifications.
The full range of expected GC metallicities is . Using the Galactic colour–metallicity relation of Couture, Harris & Allwright (1990), this corresponds to a range in colour of . The errors in our photometry lead to an average error in colour of mag. We thus decided to relax our final colour selection to . Our final colour selection is shown by the dotted box in Fig. 3. Here the range in is defined as linear functions of . This colour selection reduced our sample size down to a list of 352 objects. As a final stage in selection we performed a visual check of all the 352 candidate GCs in our colour selected list. From this inspection we rejected a further 40 sources that resembled galaxies (i.e. appeared diffuse and/or ellipsoidal) leaving a final list of 312 GCs.

Although these selection cuts are designed to reduce contamination to a minimum, there is always the concern that our final GC sample will still be contaminated by background galaxies and foreground stars. An estimate of the number of contaminating sources can be made by taking an image of a nearby ‘blank’ field. However, as we did not have such an image, we had to use an alternative method. ? give the predicted stellar densities in 17 fields based on their model of the Milky Way. Using the star densities in the field closest in direction to our observations of NGC 1700 (field 13), and correcting for our field–of–view, we predict only 41 stars for our magnitude range of . Similarly we predict a total of 54 stars in our band field (using limiting magnitudes of ). The equivalent stellar density for the band predicts only 29 stars in our field (assuming band limiting magnitudes of ). As our selection criteria requires sources to be in each of our , and images, we conclude that foreground stars that could be present do not make up a significant contribution to our candidate sample.
Differential galaxy counts in the band are given in fig. 1 of ?. From this we estimate a total of 1343 background galaxies in our band frame down to our limiting magnitude of . Using ? we estimate a total of 1130 galaxies in our band frame (to ). Once again, as we selected only those sources in common between the , and frames we can take the lower of these estimates as an indication of the number of contaminating galaxies in our list. These numbers are high compared to the 615 objects detected in common between our , and frames, though the number of background galaxies actually detected will be significantly lower due to the incompleteness of the sample at faint magnitudes. Although potentially large in number, we show in Section 4.2.2 that the additional constraint of colour effectively excludes the majority of galaxies from our candidate GC list.
4 Results and discussion
4.1 HST data
Two histograms for the GCs in our HST sample are shown in Fig. 4. The lower panel shows the colour histogram for the whole 146 GC sample. There is a single peak at around , which is consistent with that of ?, i.e. . The upper panel shows the colour distribution for GCs in our sample that are brighter than . At , our typical error in colour is mag. Any fainter than this and the two distributions merge into a single broad peak due to photometric errors. For the bright sample, there is a suggestion of the presence of two peaks separated by , with one peak at and one at . As we have a small number of GCs brighter than we use the dip statistic (see ?; ?) in order to confirm this bimodality. For our bright sample of HST GCs, the dip statistic indicates a probability of per cent that the distribution is not unimodal. The two peaks appear to have been ‘washed out’ at fainter magnitudes due to the photometric errors. The shaded region in this figure represents the histogram of Galactic GCs. This distribution shows a sharp peak at , i.e. slightly bluer than the peak of the full sample but consistent with the blue peak of the population.

An HST study of the NGC 1700 GC system prior to that of ? was performed by ?. Although only 39 GCs were detected, there was a hint of possible bimodality in the histogram with peaks at and . Another HST observation of NGC 1700 was carried out by Richstone et al. (see ?). An analysis of these observations detected 27 GCs, again with two possible peaks in the colour distribution at and . However, a statistical analysis of the distribution detected no significant bimodality (?). The positions of the peaks in Fig. 4 are consistent with those suggested by the previous observations mentioned above.
4.2 Keck data
4.2.1 Galaxy morphology and age estimates
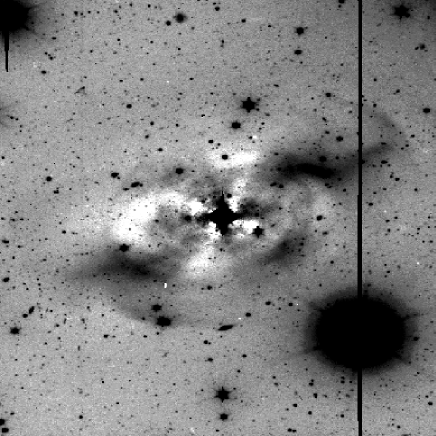
In Fig. 5 we show the ‘residual image’ of NGC 1700 produced by subtracting the model from the 600 s band image. Here the fine structure within the galaxy is better revealed. Most notable are the two broad, faint tidal tails or plumes visible to the North-West and South-East of the galaxy. In addition many GCs are apparent. The projected extent of the tidal features is about 165 arcsec (41 kpc) from the galaxy centre. A faint shell system is just visible in the central region (i.e. within the central arcsec) of the galaxy, as found in ?.
In Fig. 6 we show the profile of the 4th cosine (C4) parameter in the , and bands for the long exposure images. The C4 term is generally positive at radii arcsec, representing discy isophotes. At greater than 30 arcsec the isophotes become strongly boxy, indicating an excess of light at from the major and minor axes. Fig. 5 shows that this is very probably due to some light from the tail-like structures which remains in the galaxy model. To investigate this further, the ‘tails’ were masked out and the galaxy remodelled. Fig. 6 also shows the resulting C4 profiles after masking the tails. Note that the boxiness in the original fits has been greatly reduced in all cases (to less than per cent deviation), indicating that the dominant cause of the boxiness at these radii is the tails. The tails themselves appear clearly brighter in the residual maps produced by subtraction of these models from the original images. This shows that without masking, some of the light from the tails is included in the model, modifying the fit parameters.

? constructed a ‘merger sequence’ from a sample of galaxies that are good candidates for ongoing mergers and remnants of mergers between two approximately equal mass disc galaxies. They assigned a ‘merger stage’ to each galaxy based upon dynamical crossing times, with zero age defined to be the point of nuclear coalescence. They noted that the fraction of galaxy starlight contained within the tails roughly anti-correlates with this merger stage. This allows us make a very rough estimate of the time-scale since the merger event that created the tails within NGC 1700.
This analysis was performed on the long exposure residual images. As we wanted to include as much of the tail light in the residual images as possible, we used the residual images produced by excluding the tails from the elliptical fit of the galaxy. As mentioned above, if the tails are not masked out during the fit, some of their light is included in the model, modifying the fit parameters and resulting in the subtraction of a significant amount of tail light from the galaxy image. The total flux contained within small circular apertures positioned on the tails was measured using the iraf utility imexamine. This was used to derive a mean surface brightness for the tails, which was then multiplied by their total area (i.e. including the area missed due to contaminating bright sources). The resulting surface brightnesses were 26.6, 25.9 and 24.4 mag arcsec-2 for the , and bands respectively. The total light in the tails was divided by the total galaxy light to give the ‘tail fraction’. We also roughly estimated the total tail light using polygon-shaped apertures. This method gave a similar result to the mean surface brightness method but included the light from contaminating point sources and was thus less reliable.
The tail fractions in the , and bands were found to be , and per cent respectively. The tail fractions in ? were derived in the band, with a few exceptions. We thus use our band tail fraction (which is similar to the and values) for NGC 1700 in the following analysis. We fitted a linear least-square to the points obtained from the ? data. This fit is shown as a dashed line in Fig. 7. The solid horizontal line represents the measured band tail fraction for NGC 1700. If we extrapolate the fit we find that the band tail fraction measured for NGC 1700 corresponds to a merger stage of . The large error on this stage estimate is due to the scatter of the data points of ?. We also performed a quadratic fit on the Keel & Wu data. Extrapolating this fit yielded a stage comparable with the result using a linear least-square fit.

By comparing the spectroscopic (i.e. central starburst) ages of several galaxies in the ? sample with their assigned merger stage, we determined the approximate time since nuclear coalescence. For the stage of NGC 1700, the time since the central starburst and hence tail formation is approximately Gyr.
A lower limit for the age of the tidal tails can be estimated from the dynamical time-scale, i.e. . The projected distance of the tidal tails from the galaxy centre is about 165 arcsec (41 kpc), and the rotation velocity in the outer parts is km s-1 (?). This gives a dynamical time of 0.8 Gyr, which is an underestimate if the tails do not lie in the plane of the sky; thus the tidal tails are Gyr old. This lower limit is consistent with the age derived from the fraction of galaxy light contained within the tails.
The presence of two symmetric tidal tails is generally taken to be a signature of a recent major merger involving two, approximately equal mass spiral galaxies (see e.g. ?). If the tidal features in Fig. 5 are indeed genuine tidal tails then we could conclude that NGC 1700 has experienced a major merger during its recent history. Alternatively, if the features are merely plumes of tidally disturbed material, the situation is less clear. While a major merger could not be ruled out, the situation of a disc galaxy merging into an existing elliptical would be possible.
4.2.2 Age estimates from globular cluster colours and magnitudes
We present in Fig. 8 the colour histogram for NGC 1700 GCs from the Keck data. The histogram appears bimodal with a blue peak at and a second peak magnitudes redder at . This bimodality does not appear to be an artifact of the data binning and is still present if the histogram bin boundaries are changed. For the subsequent discussion and analysis we define the blue population as those GCs possessing and the red population with colours . A statistical analysis using the kmm algorithm (Ashman, Bird & Zepf 1994) detects bimodality in the distribution with per cent confidence. The kmm algorithm assigned a colour cut between the blue and red populations of , thus confirming our initial visual estimate. The distribution of GCs in the Milky Way is also shown in Fig. 8 (shaded area). The peak of this distribution is at which is similar to the peak of the blue population of NGC 1700.

Is the bimodality of the histogram evidence for two distinct GC populations in NGC 1700 ? In order to address this question, one has to consider the expected number of contaminating sources within our final sample. As the number of predicted stars before colour selection is small, we can immediately conclude that the contamination by foreground stars in our final sample is negligible. Another source of contamination is background galaxies. Our automatic and visual checks have removed obvious galaxies but it is possible that small, unresolved background galaxies remain. For our mean magnitude of 24.5, we expect to be detecting sources out to a mean redshift of (?). At this redshift all morphological types of galaxies (with the exception of irregular types) have typical colours in excess of 2.5. This is significantly redder than the peak of the red population and we can thus be fairly confident that the two peaks are real and due to two distinct populations of GCs. To support this view we performed photometry on 13 galaxy-like objects that appeared in our initial list but were rejected during the selection process. The mean colour of these objects was ; significantly redder than the peak of our red population of objects in our final sample. Moreover, the mean FWHM value measured for these objects was pixels; greater than the upper cut-off used in our selection based on FWHM.
The study of globular cluster systems can reveal important information regarding the formation and evolution of the parent galaxy. The merger model of galaxy formation (?; ?) makes a number of predictions about the properties of the GC system of the resultant galaxy. In this scenario, an elliptical galaxy is formed by the gas rich merger of two spiral galaxies. If our interpretation of two, roughly symmetric tidal tails in NGC 1700 is correct, then the galaxy has probably undergone such an event. If this is the case, the merger model predicts the formation of a new, metal rich population of GCs during the merger, which then reddens and fades with time. Post-merger ellipticals would thus be expected to possess a ‘new’ metal rich population and an old, metal poor population originating in the progenitor disc galaxies. Fig. 8 reveals evidence for two GC populations in NGC 1700. We next use the colours and magnitudes of these two populations to determine their age and metallicity properties.
The blue peak of our histogram is roughly consistent with the peak of the distribution of Galactic GCs (see Fig. 8). The Milky Way is likely to be a typical example of a progenitor in a present day gas-rich merger, thus indicating that we may assume that our blue peak in is due to an old, metal poor population of GCs. Here we use the stellar population models of both ? and ? to predict the difference in magnitude and colour for a population of young clusters, relative to an old, metal poor population with an age of 15 Gyr and . Fig. 9 shows the predicted differences in vs. and based on the models of ?. Fig. 10 shows the equivalent colour and magnitude changes based on the models of ?. In each case, three different metallicity tracks are shown. From Fig. 8, .


The and values correspond to the magnitude offset in the and bands between the young and old populations. These offsets were estimated from the cumulative and band GC luminosity functions for both the blue and red populations separately. These luminosity functions are shown in Fig. 11. To reduce the effect of photometric errors we considered only those GCs at least 0.5 mag brighter than the limiting magnitude in each band. The data has been normalised to the faint limit of our luminosity functions. The median magnitudes of the red and blue GCs considered were then calculated to allow us to determine the separation of the blue and red populations. The magnitude differences between the red and blue populations were determined to be and in the and bands respectively. The observed values with their associated errors are indicated by a cross on Fig. 9 and Fig. 10. Reference to the Bruzual & Charlot models shows that the red population is consistent with a young, metal rich population of globular clusters, i.e. with an age of 2.5–5.0 Gyr and super-solar metallicity ( to +0.6). A plot of vs. , where predicts a similar age and metallicity. It is interesting to note that the Worthey models predict significantly different values for the age and metallicity of the red GC population in the sense that they are older and more metal poor. From the Worthey models the age of the red GCs is 5.0–8.0 Gyr and . It thus appears that ages derived from GC colours and magnitudes are highly model dependent. However both models suggest that the red GCs are both younger and more metal rich than the blue population. We may suspect that should be at least solar metallicity. In the merger model, the young population is thought to have formed from the relatively enriched gas in the spiral discs, in contrast to the old population which formed from metal poor gas. Moreover, the line strengths plotted in Fig. 13 (see Section 4.3 for details) imply for both models that the stellar metallicity of the last major starburst is . If the young GCs formed from the same gas, we would expect them to be metal rich as well, which in turn would favour the younger age of the Bruzual & Charlot models. However, if the young GCs were formed at an early stage of a merger-induced starburst then they could in principle be more metal poor than the present young stellar population (?). To summarise, if we assume that the blue GCs are an old metal poor population, the red GCs are consistent with an age of 2.5–5.0 Gyr, assuming they have a metallicity of . In the case that the red GCs are relatively metal poor, as suggested by the Worthey model tracks in Fig. 10 then a slightly older (5.0–8.0 Gyr) age is indicated. Infrared photometry or good spectra would help to resolve the age and metallicity independently.

From Section 4.1 we found evidence for bimodality in with peaks at and . A GC population with an age of 15 Gyr, and will have . This is consistent with the blue population seen in our colour histogram. Similarly, a population with an age of 3 Gyr, and is expected to have , i.e. consistent with the red peak of our distribution. It thus appears that the colours of the red and blue peaks in our histogram are consistent with the the peaks hinted at in the HST colour distribution. The bimodality seen in independent data sets confirms the presence of two GC populations in NGC 1700.
We show in Fig. 12 the mean colour of our GCs vs. galactocentric radius. The data are radially binned into 10 annuli, each of width 5.5 kpc (22 arcsec). The GC system of NGC 1700 does not show any significant correlation between colour and galactocentric distance. In particular the red (i.e. young) GCs are not preferentially concentrated towards the centre of the galaxy, as might have been expected from the merger origin for new GCs (?; ?). A linear least-square fit to the radial colour bins gives a gradient consistent with zero. We do not detect any significant radial colour trend in the HST sample of GCs either, agreeing with the results of ?. This lack of an obvious radial trend is potentially a problem for the merger origin interpretation of the GCs, and deserves further consideration in any future studies. It is also interesting to note that the GC systems of several other ellipticals do show radial colour gradients in the sense that the red GCs are more centrally concentrated than the blue (see e.g. Geisler, Lee & Kim 1996; Forbes, Brodie & Grillmair 1997).

4.3 Other age estimates
Until recently, direct age dating of the stars in an elliptical was near-impossible due to the well known degeneracy of age–metallicity effects in old stellar populations. Spectral synthesis methods have now been developed (e.g. ?; ?) that show that combinations of certain spectral line indices can efficiently disentangle the effects of age and metallicity for young to intermediate age stellar populations. As well as stellar age dating, a number of other methods are available for NGC 1700. These estimates are shown for comparison in Table 1. We show a mean spectroscopic age based on the line strength data of Fisher, Franx & Illingworth (1996) and ?, the age derived from the globular clusters by ?, the ‘fine structure age’ of ?, the age from stellar dynamics (Statler, Smecker–Hane & Cecil 1996) and the age derived from the galaxy’s deviation from the Fundamental Plane (see Forbes, Ponman & Brown 1998).
| Method | Age (Gyr) | Ref. |
|---|---|---|
| Globular clusters | ? | Whitmore et al. (1997) |
| Fine structure | Schweizer & Seitzer (1992) | |
| Stellar dynamics | Statler et al. (1996) | |
| Tail fraction | This work | |
| Globular clusters | This work, Bruzual & Charlot models (2000) | |
| Globular clusters | This work, Worthey (1994) models | |
| Stellar spectroscopy | This work, see text for details | |
| Tail extent | This work | |
| Fundamental Plane residual | This work, Forbes et al. (1998b) | |
| Best estimate | This work |
4.3.1 Ages from stellar population synthesis models
The spectroscopic age estimates in Table 1 are based on comparisons of observed absorption line strengths with single-burst stellar population models of ? and ?. From these model grids, observed line strengths can be used to give estimates of the age and metallicity of the stellar component of a galaxy. We have used the and line strengths from two sources, i.e. ? and ?. Fig. 13 shows the model grids with the observed values for NGC 1700 shown. In both panels, the solid circle indicates the observed line strengths from ?, whereas the open circle shows the line strengths from ?. The apertures used in each case are and respectively because we are primarily concerned with the age of the central starburst. Using the Worthey models, the age derived from the Fisher et al. data is Gyr and the age from the Gonzalez data is Gyr. In both cases, the metallicity, is . Similar results are obtained by using the Bruzual & Charlot models. In this case the Fisher et al. data gives an estimated age of Gyr and the data of Gonzalez suggests an age of . Combining these results gives an average of Gyrs. Again both sets of data suggest a metallicity of . Note that this method measures a ‘luminosity weighted mean age’ of the central stellar population and is thus likely to be dominated by the young stellar population associated with the last episode of star formation. This may in turn be the result of a merger induced starburst.

4.3.2 Ages from globular clusters
? employed a method similar to that used in Section 4.2.2 to derive GC ages. This method relies on the observed colour difference between two detected populations of GCs. ? detected only one population (at ). Their age of ‘ Gyr ?’ was derived from the non-detection of two distinct populations, though it is consistent with the other age estimates discussed herein. The non-detection appears to have arisen due to the small colour separation of the GC populations. Using the same data but restricting the sample to bright GCs, we have detected two separate populations as shown in Fig. 4. By including the whole sample (i.e. down to ) the two peaks merge into a single distribution.
4.3.3 Fine structure ages
Another method of estimating galaxy age was developed by ?. They defined a fine structure parameter, , based on the amount of optical ‘fine structure’ present in a galaxy. This included a measure of the maximum boxiness of the galaxy isophotes, the number and strength of shells and tails and the presence or absence of ‘X-structure’. The values of for the galaxies in their sample ranged from 0 for galaxies with no fine structure to 7.6 indicating the largest amount of fine structure observed. NGC 1700 was assigned a value of 3.70. They found that correlated with a galaxy’s residual from the mean colour–magnitude relation. Using this fact and relating galaxy colours to ages via a star formation model, they estimated the time since the merger event. We quote their most representative age of 6.0 Gyr with an error of Gyr in Table 1. We note however , that the models used in ? assumed a solar metallicity starburst. If the stellar population is super-solar, as suggested by Fig. 13, then the ? age is expected to be a slight over-estimate.
4.3.4 Dynamical considerations
The age estimate of ? comes from measurements of the stellar velocity field of NGC 1700. They found that within (8.8 kpc) the galaxy is kinematically well mixed. This constrains the time since the last major merger event to be Gyr to allow sufficient time for phase mixing and differential precession. Their observations also define an upper limit for the time since the merger. The asymmetric photometric and kinematic signatures at larger radii preclude a merger age greater than 5.3 Gyr, otherwise these features would have relaxed and disappeared. Thus we quote an age of 2.7–5.3 Gyr. The same paper argues that the counter rotating core and boxy features (the latter of which we attribute to the tidal tail-like structures) could not have been created by the same merger event and that the observed form of NGC 1700 must have arisen from the merger of at least three separate stellar systems. However, it was not clear whether these events occurred sequentially or simultaneously. If the two tail-like structures are indeed genuine tidal tails this would suggest that the history of NGC 1700 has included at least one major merger event involving two approximately equal mass disc galaxies. If the kinematically distinct core (KDC) was formed prior to this event it would have probably been disrupted during the ensuing violent relaxation processes. If the KDC was indeed formed by a separate process it must have resulted from a subsequent minor merger (e.g. ?) or an interaction (see ?) some time after the major merger event that created NGC 1700 and its tails. Neither of these suggestions are very appealing. Alternatively, the tidal structures seen in Fig. 5 could be interpreted as plumes which have arisen from the infall of a small disc galaxy into a pre-existing elliptical.
4.3.5 Scatter from the Fundamental Plane
A recent study by ? showed that a galaxy’s deviation from the Fundamental Plane (FP) correlated with its age, albeit with large scatter. The FP residual is defined as (?). Young ellipticals fall below the FP (i.e. have negative residuals) and evolve towards it until they lie on the FP at an age of about 10 Gyr. Older ellipticals tend to lie above the FP. It is thus possible to use the FP residual to approximately age date an elliptical galaxy. The FP residual for NGC 1700 is . This corresponds to an age of Gyr based on the fit in ?. This is slightly younger but comparable to the other age estimates discussed in this section.
4.3.6 Comparison of various age estimates
Before directly comparing the different age estimates, one should bear in mind that the dating methods may be measuring different time-scales and may have large errors associated with them. As mentioned above, the stellar spectroscopy methods measure the central ‘luminosity weighted average age’ which means they are dominated by the last burst of star formation, although the old stellar population also contributes. Thus the true age of the starburst may be slightly less than the spectroscopic age. The young GCs were possibly formed in the same star formation event as the galaxy starburst, and as such should give a similar age as the stellar spectroscopy. The age estimate from the ? trend is also based on a star formation time-scale.
The stellar dynamics, fine structure and tail fraction ages estimate the time since the last merger event. The ‘dynamical/structural’ estimates are reasonably consistent with the ‘starburst’ ages, indicating a relatively young age for NGC 1700, and suggesting that the merger was a gaseous one. ? have shown that in a merger between two spirals with bulges the main starburst occurs at the time of nuclear coalescence while the tails form Gyr earlier. If this is the case, we might expect the ‘dynamical/structural’ age estimates to be slightly higher than the ‘starburst’ ones. We have decided to adopt an age for NGC 1700 of Gyr as our best estimate. This may also correspond to the time since the nuclei of the progenitors merged.
4.4 Globular cluster spatial properties and specific frequency
4.4.1 Spatial distribution
Given the field–of–view, our Keck observations are ideal for defining the outer reaches of the GC system. We have calculated the surface density (SD) profile for the GC system in the Keck images within 9 annuli centred on the galaxy. For objects in the corner of the CCD, the SD was calculated by taking into account the area of the annulus ‘missing’ off the edges of the chip. This method allowed us to calculate the density out to a radius of 232 arcsec ( kpc). The resulting surface density profile is shown in Fig. 14. The error bars simply reflect the Poisson errors on the number of GCs in each bin. At large radii the surface density decreases like a power-law with radius (open squares). At radii arcsec however, there appears to be a significant deficit in the number of GCs detected in our Keck images (shown by open circles). The most likely cause for this is the fact that GCs at small radii are superimposed on the bright body of the galaxy which also possesses a steep radial gradient at these distances. Although an elliptical model of the galaxy was subtracted from each of the initial images, this effect seems to have caused a reduction in our ability to detect GCs as our HST surface density continues to rise towards the centre at these radii as shown in Fig. 15. In addition, we were unable to detect GCs in the Keck images within the central 33 arcsec due to the large saturated region at the centre of the band image. To quantify the outer SD profile of the GCs detected in our Keck images, we fitted the outer-most points in Fig. 14 with a function of the form . This fit is shown by the dashed line in Fig. 14. We find that and . Background contamination of the sample would add a constant SD level to the profile. Although this contamination is likely to be small, ideally it would be taken into consideration when computing the fit. However, our data are not sufficient to calculate the level of contamination and the calculated slope of the profile should be treated with caution. The solid line in Fig. 14 represents the stellar profile of the galaxy. The galaxy profile used is not in the usual units of surface brightness but has been converted to log and arbitrarily shifted in the Y direction to allow simple comparison of the slopes. We measure a slope of for the galaxy profile using the measured intensities at all radii. It thus appears that the GC profile is flatter than the underlying stellar profile.


In order to investigate the SD profile within the central regions of the galaxy, we use the HST images. This profile is shown in Fig. 15 after correction for the areas of the annular bins missing from the WFPC2 field–of–view. Each annulus contains GCs with the exception of the two inner bins which contain GCs. We find that the HST surface density follows a power-law profile exterior to arcsec (i.e. the outer 6 data points). We again fitted these points with a function of the form and find and GC arcsec-2. The slope of this fit is within the range of values measured for other ellipticals by other authors (e.g. ?) and also consistent with the slope calculated from the Keck sample. Also shown in Fig. 15 is the stellar profile of the galaxy. This has a slope of . The GC profile is significantly flatter than that of the galaxy, which is often the case in other systems (e.g. Grillmair, Pritchet & van den Bergh 1986; ?; ?; ?; ?). Within arcsec there is evidence for a flattening of the profile indicating the presence of a ‘core region’. The core radius of the NGC 1700 GC distribution was also measured by ? to be kpc corresponding to arcsec, although only 39 GCs were detected. The presence of a core region is also commonly seen in other ellipticals and ? define a relationship between GC system core radius and parent galaxy luminosity. This relation is in the sense that more luminous ellipticals have more extended GC systems. An elliptical with the luminosity of NGC 1700 (i.e. ) is expected to have a core radius of kpc, corresponding to arcsec, although there is a large uncertainty on this value (?). Our data are thus consistent with the expectation from other ellipticals and with the previous direct measurement of the NGC 1700 GC system core radius.
4.4.2 Total number of globular clusters
We next make an estimate of the total number, , of GCs possessed by NGC 1700. In order to estimate we integrate under the surface density profile out to some limiting radius. We will assume a flat profile interior to our second data point ( arcsec) with (as shown in Fig. 15), although this assumption has little effect on the final calculation. Outside this radius we assume a power-law profile. The faint magnitude limit for our Keck data () is much brighter than the expected peak magnitude of a standard GC luminosity function at the distance of NGC 1700. Thus the correction for incompleteness would be very large. In addition, the Keck data has a higher contamination rate than HST which is difficult to account for without a corresponding ‘blank sky’ image. We therefore integrate under the power-law fitted to the HST points only, for which we are confident there is very little contamination, and we expect a much smaller incompleteness correction. We use the Keck data to help us to define a reasonable outer limiting radius.
The dominant sources of error in determining are the choice of the outer limiting radius and the correction for incompleteness at faint magnitudes. Fig. 14 indicates that the surface density declines out to a radius of arcsec outside of which there is a large drop in surface density. This suggests that the limit of the GC distribution has been reached. We thus chose to integrate out to 210 arcsec, which corresponds to a galactocentric distance of 50 kpc, in order to calculate the total number of GCs within this radius. This limiting radius is comparable to the extents of the GC systems seen in other ellipticals (see e.g ?). The resulting number of GCs was then corrected to account for the lack of completeness in the HST sample at faint magnitudes. Based on our limiting magnitude we estimate this correction factor to lie in the range of 2–3, thus adopting a correction factor of 2.5, with an uncertainty of . We estimate that we are detecting roughly per cent of the total GC system within the limits of the HST field–of–view. We multiplied the number of GCs calculated from the SD profile by 2.5 to obtain a completeness corrected value for within 50 kpc of . Our value is greater than that found by ? who estimated a total number of GCs. However they considered only those GCs out to the radius of the HST field–of–view, whereas our Keck data indicates that the GCs are still present out to arcsec.
4.4.3 Specific frequency
The globular cluster specific frequency, , is a useful quantity as it can provide valuable constraints on the formation mechanisms of the GC system as well as providing information on the formation history of the parent galaxy and potentially the nature of the progenitor spirals. From , we calculate the total GC specific frequency within 50 kpc from the galaxy centre, from the following relation (?)
where is the absolute magnitude of the stars associated with the population of GCs in question. In the case of , the required luminosity is the absolute magnitude of the galaxy, i.e. . We will assume a 20 per cent error in the distance to NGC 1700, corresponding to an error in of 0.4 mag. This yields for , a total specific frequency of . Elliptical galaxies have a wide range of GC specific frequencies. The mean value for ellipticals in the compilation of ? is , though there are a couple of cases of ellipticals with values less than 1.0. Although possessing large errors, our is relatively low compared to most typical ellipticals and is more consistent with disc galaxies.
It is clear from the age estimates discussed herein that NGC 1700 is a relatively young galaxy. Will the GC population eventually come to resemble those seen around typical old ellipticals ? To address this question we use the Worthey models to predict the total specific frequency once sufficient time has passed for NGC 1700 to have an age comparable to those of typical elliptical galaxies today. Old, present day ellipticals have stellar population ages of 10–15 Gyr so in order to make this comparison we compute the luminosity of a young starburst component after it has aged by 10 Gyr. As the mass of the starburst is uncertain, we consider two cases: Firstly we assume a starburst that represents 10 per cent of the galaxy by mass and is embedded in a 10 Gyr population making up the remaining 90 per cent of the galactic stellar mass. After 10 Gyr, the models indicate that the young stellar population will fade by mag (for an population). As this population constitutes only 10 per cent of the galaxy mass however, the global fading is only mag. This results in a predicted of , which is still lower than that expected for most typical present day ellipticals and suggests that NGC 1700 may form a relatively ‘globular cluster poor’ elliptical galaxy. If the starburst fraction is less than per cent (as might be expected in an elliptical plus spiral merger), then the global fading is further reduced.
Secondly, we consider a starburst that constitutes 50 per cent of the galaxy mass. The remaining 50 per cent is made up of the old stellar population. After 10 Gyr, the fading of the young stellar population results in a global fading of mag. The predicted after 10 Gyr is . This is more consistent with elliptical galaxy specific frequencies, though still lower than the mean value calculated from ?.
The merger model of GC formation by ? states that the number of new globular clusters formed in a merger will be proportional to the available gas mass, and that most ‘normal’ old ellipticals were formed from progenitors which were relatively gas–rich compared to present day spirals. It is interesting to note therefore that if one accepts the merger hypothesis and the fact that NGC 1700 is a relatively young elliptical, its GC specific frequency may be expected to be relatively low. Note, however that our ‘predicted’ values of should be considered as very approximate as there is not only an inherent difficulty in estimating our sample completeness (and hence the number of GCs), but also a large uncertainty associated with the assumptions made regarding the future evolution of the galaxy luminosity.
5 Conclusions
We have presented results from new , and band imaging of NGC 1700, taken using the Keck telescope and reanalysed previous HST imaging. From the morphology of the galaxy and photometry of its globular cluster system, we have derived new estimates of the galaxy age.
Subtraction of an elliptical model from the Keck images revealed the presence of two symmetric tidal tail-like structures extending kpc to the North-West and South-East of the galaxy. The presence of tidal tails is thought to be a classic signature that a galaxy has undergone a merger event, involving the collision of two spiral galaxies during the last few Gyr. If the observed tidal features are indeed genuine tidal tails, then this would suggest that NGC 1700 has undergone a major merger event during its recent history. If they are merely plumes or other fine structure, then the situation of a disc galaxy merging with an elliptical is also possible. Based on the fraction of galaxy light contained within these tails we have estimated their age at Gyr. We have also shown that NGC 1700 possesses boxy isophotes for radii of kpc, and that this boxiness is largely caused by the presence of the tail structures.
From the HST imaging, we detected 146 globular clusters. Of these, 34 were in common with our GC candidates detected in the Keck data. We then used these common GCs to refine our Keck GC selection. After further restricting our sample in magnitude and colour we obtained a final Keck object list of 312 GCs. These show a bimodal colour distribution with peaks at and 1.98. The colour of the blue population is consistent with that of Galactic GCs. Assuming that the blue population is indeed an old metal poor system and measuring the offset in magnitude and colour between the two populations, we find that the red GCs are younger and more metal rich. The ? stellar population models suggest that the red population is 2.5–5.0 Gyr old and has super-solar metallicity. The equivalent models of ? predict a significantly older age (5.0–8.0 Gyr) and a lower metallicity (). The bimodality in is supported by a hint of bimodality seen in the colours from HST data.
We discuss other age estimates from the literature based on fine structure, globular cluster colours, Fundamental Plane residuals, stellar dynamics, and spectroscopic line strengths. We find that, although possessing significant errors, the various age estimates generally indicate a young age for NGC 1700 of about Gyr. The fact that the ‘dynamical/structural’ and ‘star formation’ ages are similar suggests that NGC 1700 has undergone an episode of enhanced star formation triggered by a merger event, which may have created the galaxy itself.
The surface density profile of GCs reveals a flatter (i.e. more extended) profile than the underlying galaxy starlight. The total number of GCs and present total specific frequency are estimated to be and respectively. The value for , even considering the large errors, is quite low compared to the majority of typical ellipticals and is more consistent with spiral galaxies. We predict that after 10 Gyr the total will have increased to a maximum of if NGC 1700 has undergone a starburst that constitutes 50 per cent of its stellar mass. This is consistent with low ellipticals. If the starburst constitutes only 10 per cent of the total stellar mass, the predicted is somewhat lower at . This suggests that NGC 1700 will form a relatively ‘globular cluster poor’ elliptical galaxy once it reaches a comparable age to typical ‘old’ ellipticals.
Acknowledgments
We thank Trevor Ponman, Alejandro Terlevich and Edward Lloyd–Davies for help and useful discussions. We also thank the referee, Keith Ashman for his helpful comments.
Some of the data presented herein were obtained at the W. M. Keck Observatory, which is operated as a scientific partnership among the California Institute of Technology, the University of California and the National Aeronautics and Space Administration. The Observatory was made possible by the generous financial support of the W. M. Keck Foundation.
This work was also based on observations with the NASA/ESA Hubble Space Telescope, obtained from the data archive at the Space Telescope Science Institute, which is operated by the Association of Universities for Research in Astronomy, Inc. under NASA contract No. NAS5-26555.
Part of this research was funded by NATO Collaborative Research grant CRG 971552.
References
- [Ashman & Zepf¡1992¿] Ashman K. M., Zepf S. E., 1992, ApJ, 384, 50
- [Ashman & Zepf¡1998¿] Ashman K. M., Zepf S. E., 1998, Globular Cluster Systems. Cambridge University Press, Cambridge
- [Ashman et al.¡1994¿] Ashman K. M., Bird C. M., Zepf S. E., 1994, AJ, 108, 2348
- [Bahcall & Soneira¡1981¿] Bahcall J. N., Soneira R. M., 1981, ApJS, 47, 357
- [Balcells & Quinn¡1990¿] Balcells M., Quinn P. J., 1990, ApJ, 361, 381
- [Bender et al.¡1992¿] Bender R., Burstein D., Faber S. M., 1992, ApJ, 399, 462
- [Bender et al.¡1994¿] Bender R., Saglia R. P., Gerhard O. E., 1994, MNRAS, 269, 785
- [Bertin & Arnouts¡1996¿] Bertin E., Arnouts S., 1996, A&AS, 117, 393
- [Bruzual & Charlot¡2000¿] Bruzual G. A., Charlot S. 2000. In preparation
- [Couture et al.¡1990¿] Couture J., Harris W. E., Allwright J. W. B., 1990, ApJS, 73, 671
- [de Vaucouleurs et al.¡1991¿] de Vaucouleurs G., de Vaucouleurs A., Corwin Jr. H. G., Buta R. J., Paturel G., Fouque P., 1991, Third Reference Catalogue of Bright Galaxies. Springer, Berlin, (RC3)
- [Fisher et al.¡1996¿] Fisher D., Franx M., Illingworth G., 1996, ApJ, 459, 110
- [Forbes & Thomson¡1992¿] Forbes D. A., Thomson R. C., 1992, MNRAS, 254, 723
- [Forbes et al.¡1996¿] Forbes D. A., Franx M., Illingworth G. D., Carollo C. M., 1996, ApJ, 467, 126
- [Forbes et al.¡1997¿] Forbes D. A., Brodie J. P., Grillmair C. J., 1997, AJ, 113, 1652
- [Forbes et al.¡1998a¿] Forbes D. A., Grillmair C. J., Williger G. M., Elson R. A. W., Brodie J. P., 1998a, MNRAS, 293, 325
- [Forbes et al.¡1998b¿] Forbes D. A., Ponman T. J., Brown R. J. N., 1998b, ApJ, 508, L43
- [Franx et al.¡1989a¿] Franx M., Illingworth G., Heckman T., 1989a, ApJ, 344, 613
- [Franx et al.¡1989b¿] Franx M., Illingworth G., Heckman T., 1989b, AJ, 98, 538
- [Fritze v. Alvensleben & Burkert¡1995¿] Fritze v. Alvensleben U., Burkert A., 1995, A&A, 300, 58
- [Gebhardt & Kissler-Patig¡1999¿] Gebhardt K., Kissler-Patig M., 1999, AJ, 118, 1526
- [Geisler et al.¡1996¿] Geisler D., Lee M. G., Kim E., 1996, AJ, 111, 1529
- [Gonzalez¡1992¿] Gonzalez J., 1992, PhD thesis, University of California
- [Goudfrooij et al.¡1994¿] Goudfrooij P., Hansen L., Jorgensen H. E., Norgaard-Nielson H. U., de Jong T., van den Hoek L. B., 1994, A&AS, 104, 179
- [Grillmair et al.¡1986¿] Grillmair C., Pritchet C., van den Bergh S., 1986, AJ, 91, 1328
- [Hanes & Harris¡1986¿] Hanes D. A., Harris W. E., 1986, ApJ, 309, 564
- [Harris & van den Bergh¡1981¿] Harris W. E., van den Bergh S., 1981, AJ, 86, 1627
- [Harris¡1986¿] Harris W. E., 1986, AJ, 91, 822
- [Hartigan & Hartigan¡1985¿] Hartigan J. A., Hartigan P. M., 1985, Ann. Stat., 13, 70
- [Holtzman et al.¡1995¿] Holtzman J. A., Burrows C. J., Casertano S., Hester J. J., Trauger J. T., Watson A. M., Worthey G., 1995, PASP, 107, 1065
- [Keel & Wu¡1995¿] Keel W. C., Wu W., 1995, AJ, 110, 129
- [Koo & Kron¡1992¿] Koo D. C., Kron R. G., 1992, ARA&A, 30, 613
- [Landolt¡1992¿] Landolt A. U., 1992, AJ, 104, 340
- [Lauer & Kormendy¡1986¿] Lauer T. R., Kormendy J., 1986, ApJ, 303, L1
- [Mihos & Hernquist¡1996¿] Mihos C. J., Hernquist L., 1996, ApJ, 464, 641
- [Oke et al.¡1995¿] Oke J. B. et al., 1995, PASP, 107, 375
- [Poulain¡1988¿] Poulain P., 1988, A&AS, 72, 215
- [Prugniel & Simien¡1996¿] Prugniel P., Simien F., 1996, A&A, 309, 749
- [Sandage & Tammann¡1981¿] Sandage A., Tammann G. A., 1981, A Revised Shapley-Ames Catalog of Bright Galaxies. Carnegie Institution, Washington, (RSA)
- [Schweizer & Seitzer¡1992¿] Schweizer F., Seitzer P., 1992, AJ, 104, 1039
- [Statler et al.¡1996¿] Statler T. S., Smecker-Hane T., Cecil G. N., 1996, AJ, 111, 1512
- [Thomson & Wright¡1990¿] Thomson R. C., Wright A. E., 1990, MNRAS, 247, 122
- [Toomre & Toomre¡1972¿] Toomre A., Toomre J., 1972, ApJ, 178, 623
- [Whitmore et al.¡1997¿] Whitmore B. C., Miller B. W., Schweizer F., Fall S. M., 1997, AJ, 114, 1797
- [Worthey¡1994¿] Worthey G., 1994, ApJS, 95, 107
- [Yoshii¡1993¿] Yoshii Y., 1993, ApJ, 403, 552
- [Zepf & Ashman¡1993¿] Zepf S. E., Ashman K. M., 1993, MNRAS, 264, 611