The Absolute Abundance of Iron in the Solar Corona
Abstract
We present a measurement of the abundance of Fe relative to H in the solar corona using a technique which differs from previous spectroscopic and solar wind measurements. Our method combines EUV line data from the CDS spectrometer on SOHO with thermal bremsstrahlung radio data from the VLA. The coronal Fe abundance is derived by equating the thermal bremsstrahlung radio emission calculated from the EUV Fe line data to that observed with the VLA, treating the Fe/H abundance as the sole unknown. We apply this technique to a compact cool active region and find Fe/H = 1.56 10-4, or about 4 times its value in the solar photosphere. Uncertainties in the CDS radiometric calibration, the VLA intensity measurements, the atomic parameters, and the assumptions made in the spectral analysis yield net uncertainties 20%. This result implies that low first ionization potential elements such as Fe are enhanced in the solar corona relative to photospheric values.
1 INTRODUCTION
It seems remarkable that the absolute abundances (here taken to mean abundances relative to hydrogen) of trace elements in the solar corona are still a matter for debate when many measurements for much more distant stars exist. The reason for this situation is easy to understand. Classic spectroscopic techniques for measuring relative abundances require that we compare the amount of radiation emitted in spectral lines whose atomic physics we understand and which arise from the two different elements in question. In the solar corona H and He are fully ionized, and hence produce no lines. In stars with hotter coronae, thermal bremsstrahlung produces a continuum emission which can be used instead of a spectral line as a measure of the amount of H present, but the Sun’s quiescent corona is so cool that the continuum present at X–ray or EUV wavelengths is relatively weak and difficult to measure.
It has been known for some time that there is a difference in the relative abundances of elements in the photosphere and the corona organized according to the first ionization potential (FIP) of the element: high–FIP elements such as O are underabundant in the corona relative to low–FIP elements such as Fe by a factor of 4 (Meyer, 1985). However, it has not been clear whether low–FIP elements are enhanced in the corona in an absolute sense (i.e., as a fraction of the total ion number density, dominated by H and He) or the high–FIP elements are depleted relative to H. Two main techniques have been used to infer absolute abundances in the solar corona (Fludra et al., 1999). One can observe solar flares, which produce plasma hot enough for the continuum to be measured, and compare the continuum with a suitable set of lines; or one can measure particles directly in the solar wind, and assume that the abundances there truly reflect the abundances in the solar corona. Unfortunately, these two techniques have resulted in conflicting measurements for, e.g., the absolute abundance of iron. The flare measurements suggest that it is close to the absolute abundance in the photosphere (Veck & Parkinson, 1981) or perhaps factors of 1.5 – 2 larger (Fludra & Schmelz, 1999), while the solar wind particle measurements suggest that it is 4 times the photospheric ratio (Reames, 1992).
In this paper we use a third technique to measure the absolute abundance which has several desirable features. We use EUV observations of lines of Fe in order to determine the amount of Fe present in the corona, but to measure the amount of H present we use radio continuum measurements of thermal bremsstrahlung from coronal plasma. This measurement therefore pertains to the quiescent solar corona, including non-flaring weak active regions, rather than flare or solar wind plasma. Like classic spectroscopic techniques, this technique should be independent of the filling factor of plasma in the volume studied since both types of emission have the same dependence on number density. We describe the measurement technique and the observations used for this measurement in the following section. We then discuss the implications of our measurement.
2 THE MEASUREMENT TECHNIQUE
The method proposed here to measure the abundances of elements relative to H rests on the fact that the EUV line emission and radio bremsstrahlung both depend on the product of the electron number density and the number density of an element. In the case of radio bremsstrahlung the element is effectively hydrogen; in the case of an EUV line, it is the element responsible for the line. Therefore comparison of the two yields the abundance of the latter element relative to hydrogen.
Specifically, since most EUV lines produced in the solar corona are collisionally excited and optically thin, the line intensity at a photon energy corresponding to a transition in ionization state Z of element X is the integral over temperature of the product (Fludra et al., 1999), where is the “contribution function”: it includes the intrinsic spontaneous emission rate (the Einstein “A” coefficient) as well as the ratio of the number density of the particular charge state of the element responsible for the line to the total number density of the element. This ratio is usually determined by an ionization balance calculation appropriate to the temperature of the plasma, and is a strong function of temperature for this reason. However, for most lines is effectively independent of and . The (hydrogen column) differential emission measure DEM(T) is the integral along the line of sight of .
Bremsstrahlung is one of the two main mechanisms for radio emission in the solar corona and also has a significant dependence on temperature: in the optically thin limit, the flux at a frequency is
| (1) |
in ergs cm-2 s-1 Hz-1 (Dulk, 1985), where = 24.5 - ln() is the Gaunt factor, is the Boltzmann constant, the speed of light and the second integral is over the solid angle subtended by the source. We are assuming that in a plasma at the temperature of the solar corona the ion component is completely dominated by protons and fully–ionized helium, and we adopt . It is clear from (1) that we must know the DEM in order to calculate the thermal bremsstrahlung radio flux accurately. Note that as long as does not vary from place to place, (1) has exactly the same dependence on density as the EUV line emissivity and thus filling factor has exactly the same effect on the EUV line and radio continuum fluxes.
We determine the abundance with the following steps: (i) We measure the radio flux from a source in the solar corona. This source must be optically thin and its radio flux must be due only to bremsstrahlung. The latter requirement can be tested by observing the radio spectrum of the source, which should be essentially flat for optically thin bremsstrahlung. (ii) We observe the same region with the Coronal Diagnostic Spectrometer (CDS) on SOHO in order to measure the intensities of lines from a range of charge states of Fe sufficient to give a reliable determination of the DEM. (iii) We use the CHIANTI atomic data package (Dere et al., 1997; Landi et al., 1999) to fit the Fe line fluxes to a DEM. (iv) We assume that the shape of the DEM for electrons and protons is the same as that for Fe, and integrate over temperature in (1) to predict the optically–thin bremsstrahlung radio flux we expect to observe, for a given absolute abundance of Fe. Comparison with the radio flux measured by the VLA yields .
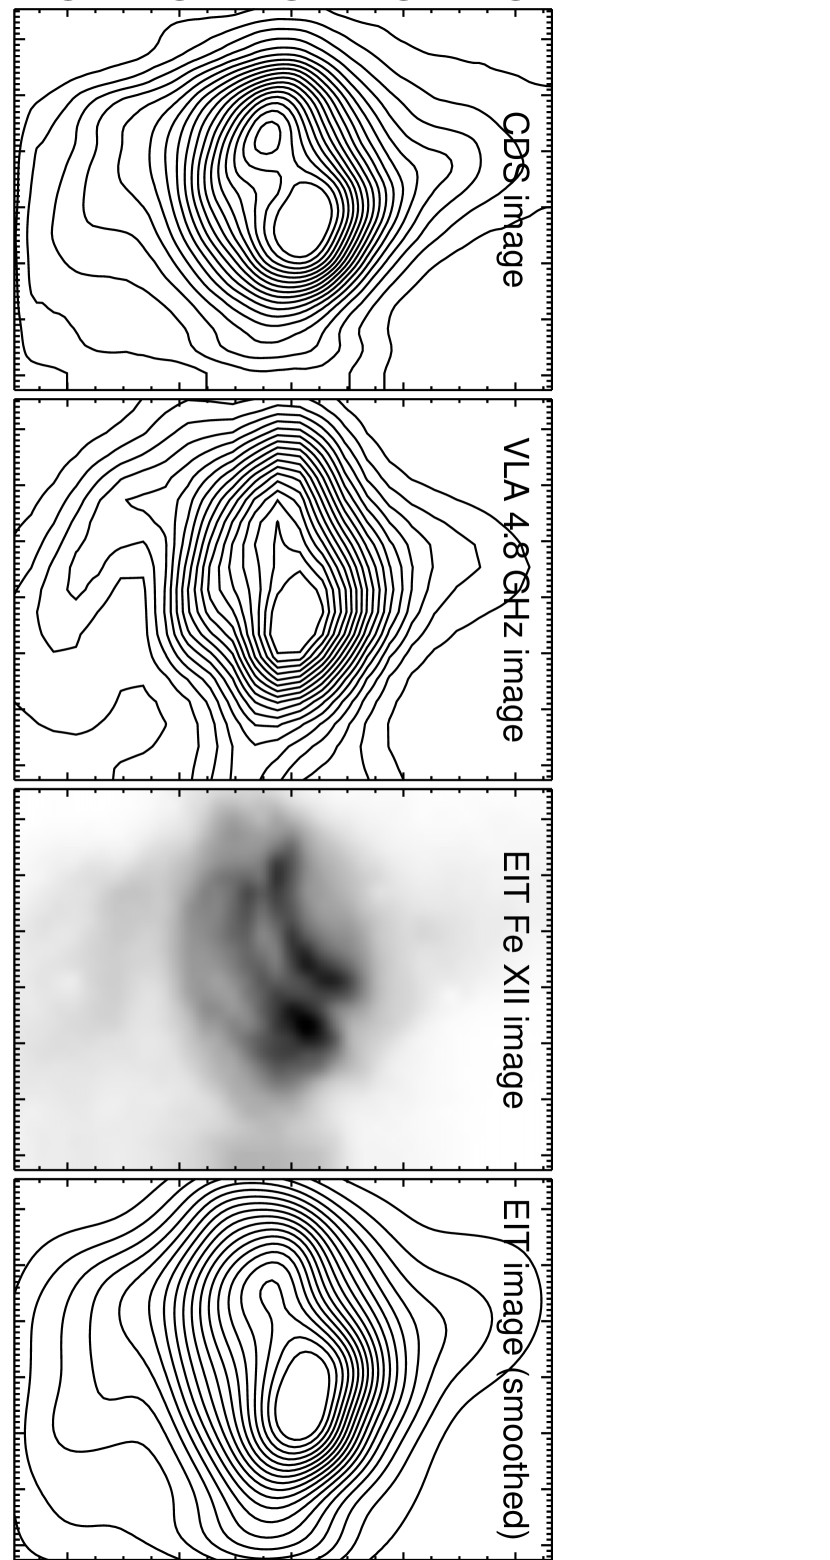
Coordinated observations with CDS and the VLA111The Very Large Array is run by the National Radio Astronomy Observatory which is a facility of the National Science Foundation operated under cooperative agreement by Associated Universities, Inc. were carried out on 1997 July 27, Aug. 3 and Nov. 11. We will present an analysis of all the data elsewhere; here we discuss the best target observed, a small active region AR 8105 found at about S35W15 on 1997 Nov. 11 (with the VLA in “D” configuration). This was the best target in the sense that it was compact: the VLA is an interferometer and cannot measure the flux of large sources, so radio flux measurements are more reliable for compact sources. The region was one of four observed on this day with the VLA at 1.4, 4.8 and 8.4 GHz. CDS also observed the same 4 regions alternately using the sequence FE_IONS which reads nine 21–pixel–wide windows from the NIS1 detector of CDS containing 14 identified lines including those of Fe X, XI, XII, XIII, XIV, XV, XVI and XVII. One run of the sequence took 32 minutes, scanning with the 4″ slit across a 240″ wide field of view. Five sequences were acquired on AR 8105 centered at about 13:14, 16:28, 18:42, 20:56 and 23:10 UT, respectively. The VLA observations covered the period from 14:30 UT to 23:10 UT, cycling between the different frequencies rapidly in order to achieve optimal coverage. Images of AR 8105 acquired by CDS, the VLA and EIT are shown in Figure 1.
3 THE ABUNDANCE OF IRON
It is essential for this measurement that the VLA see the same plasma that is seen in the EUV, and Fig. 1 shows that this is indeed the case: the EUV and radio images match each other extremely well, indicating that gyroresonance opacity does not contribute significantly to the radio emission and we conclude that it is due to bremsstrahlung. The higher–resolution EIT images shows that two east–west loops dominated AR 8105.
The VLA observations resulted in images with resolutions of 30″ at 1.4 GHz, 13″ at 4.8 GHz and 7″ at 8.4 GHz. Using the 4.8 and 8.4 GHz images we identified an area of dimension 69″ 97″ around AR 8105 which includes essentially all the flux from the region. Radio fluxes were derived by summing over this area at 4.8 and 8.4 GHz, while due to the poorer resolution at 1.4 GHz we instead fitted a Gaussian model to the feature associated with AR 8105 and determined its flux. At each frequency we have independent measurements in two separate 50 MHz bands and in the two circular polarizations, all of which are consistent with one another. The resulting fluxes are 0.25 0.01 sfu at 1.4 GHz, 0.207 0.004 sfu at 4.8 GHz and 0.197 0.006 sfu at 8.4 GHz, which are consistent with the spectrum expected for optically thin bremsstrahlung due to the Gaunt factor in (1). The quoted uncertainties are the map rms per beam times the square root of the number of beams over which integration was carried out, and are much larger than the formal uncertainties in the fluxes. Polarizations were also low, consistent with the properties of bremsstrahlung.
The CDS data were calibrated using the standard reduction package in SOLARSOFT (results presented here use the version current in 1999 December). Line profiles were fitted and fluxes extracted, with uncertainties calculated according to Thompson (1998). We used both a recent radiometric CDS calibration derived from comparison with the SERTS rocket flight in 1997 (Thomas et al., 2000) and the “version 2” CDS calibration which was in the CDS software as of 1999 December. One important step is that background subtraction was carried out on the CDS data using a linear fit to pixels to the north and south of the region studied, well away from AR 8105. This step is important because of the fact that the VLA does not measure large–scale flux and hence is insensitive to the quiet–Sun contribution. In effect we assume that a smooth quiet–Sun contribution has been subtracted from the radio fluxes, and hence it should be subtracted from the CDS data as well. This predominantly affects the cooler lines, amounting to up to 20% of the photons in the original spectrum, but being fairly uniform across the CDS field of view.
The following lines (with typical line fluxes averaged over the region shown in parentheses, in ergs cm-2 s-1 st-1) were then used to calculate the DEM: Fe X at 345.7 Å (55 3), Fe XI at 352.7 Å (140 4), Fe XII at 352.1 Å (145 4) and 364.4 Å (230 4), Fe XIII at 348.3 Å (95 4), Fe XIV at 334.2 Å (260 4), Fe XVI at 360.7 Å (380 4) and Fe XVII (undetected here) at 350.5 Å. These lines were chosen to be as density–insensitive as possible while still covering the temperature range expected for the non–flaring solar corona, log T = 5.8 up to 6.8. The Fe XIII and Fe XII lines do have significant sensitivity to density in the likely range of coronal densities, 109 – 1010 cm-3. In practice, AR 8105 was quiet and there is no significant plasma outside the temperature range 5.9 – 6.4. The fitting procedure uses bins of width 0.1 in log T; in effect, we find that only 4 bins contain significant emission measure and the adjacent two bins are also significant, so we are fitting to 6 parameters using 8 lines from 7 different charge states. The Fe XV line at 327.1 Å was not used to determine the DEM because it was always found to be 30% lower than the models predicted; the atomic data for it are clearly not consistent with the strong Fe XIV and XVI lines observed. Additional details will be given in a companion paper.
We adopted the ionization equilibrium calculations of Arnaud & Raymond (1992) and assume a constant pressure of 1 1016 cm-3 K (e.g., = 5 109 cm-3 at = 2 106 K) in determining the DEM. The line fluxes used for the fit were generally reproduced by the resulting model DEM to better than 10% (SERTS) or 5% (“version 2”). Figure 2 shows the geometric mean DEM over the 5 CDS sequences with error bars showing the standard deviation in each temperature bin. Essentially no plasma is present below log T = 6.0 (controlled by the ratio of Fe X to Fe XI) while the amount of plasma above 2 106 K is small (controlled by the ratio of Fe XVI to Fe XIV). These properties are consistent with those of DEMs derived for other regions of similarly low activity (Brosius et al., 1996). Integrating over each of the 5 DEMs resulted in a predicted radio flux of 0.829 0.023 sfu in the 6700 arcsec2 area at 4.8 GHz if we use the CDS calibration based on the SERTS–97 comparison and adopt = 3.9 10-5 as in Meyer (1985), which is close to the photospheric value. The observed radio flux of 0.207 sfu is a factor of 4.0 smaller than this. Consequently we derive a value of 1.56 10-4 for , or = 8.19 on the commonly used scale where = 12.00. Using the “version 2” CDS calibration we predict 0.716 0.013 sfu and = 1.35 10-4 ( = 8.13). We adopt the more recent SERTS–97 calibration for our final result. The uncertainty of 3% for the predicted radio flux is the standard error in the mean of the results of the five distinct CDS observations of AR 8105 and thus incorporates the effects of both temporal variability over the 12 hours of the experiment as well as the stochastic nature of the process of fitting the line fluxes to a DEM. We adopt an uncertainty of 15% for the CDS radiometric calibration (Thomas et al., 2000).
It turns out that the measured value for is reasonably robust to several of the assumptions made here, mostly because it depends on an integration over the DEM and is thus not very sensitive to details of the DEM. One assumption is that the result quoted uses the version of CHIANTI (0.9) used by the CDS team at NASA/GSFC as of 1999 December, which is not the most current version (2.0). For the Fe lines used here the only differences between the two versions appear to be in Fe X and Fe XI, and the newer version results in significantly poorer fits for the DEM because of these two lines: the resulting DEMs have less emission measure at low temperatures and more at high temperatures. Notwithstanding this fact, the result for the abundance differs by less than 3% with the newer version of CHIANTI. If we use the ionization equilibrium calculations of Arnaud & Rothenflug (1985), the DEMs show a pronounced peak at = 6.3 and the resulting abundance is about 10% larger. A change in the assumed pressure by a factor of 2 affects the results by a similar amount: it would be 8% smaller at 5.0 1015 cm-3 K and 10% larger at 2.0 1016 cm-3 K. We attempt to minimize the uncertainty due to variation in pressure across the active region by choosing a value representative of the source region for the bulk of the EUV line emission. We note also that the background subtraction carried out on the CDS data introduces some uncertainty in the final results, as does solar calibration at the VLA, which uses dedicated noise sources for solar calibration which need to be measured routinely to maintain calibration accuracy. However, the calibration at each of the three frequencies observed is independent of the others, so we take the fact that the measured spectrum is flat to be an indication that solar calibration was not in error by more than the 20% levels which all the other factors may introduce.
4 CONCLUSIONS
Our measurement of an absolute abundance for Fe which is 4 times photospheric is clearly consistent with the interpretation that low–FIP elements such as Fe are enhanced relative to their photospheric abundances. Of the commonly–used solar abundance tables, Feldman’s (1992) is closest to our measurement with = 8.10; his value is based more on the argument that H should be treated as a high–FIP element rather than any specific measurement of . Other commonly used values for are the photospheric results 7.60 (Allen, 1973), 7.51 (Anders & Grevesse, 1989) and 7.67 (Grevesse & Anders, 1991), the coronal results 7.59 (Meyer, 1985), 7.83 (Fludra & Schmelz, 1999) and 8.50 (Waljeski et al., 1994), and the solar wind measurements 7.93 (Reames, 1995) and 8.51 (Reames, 1999). We note in passing that spectroscopic measurements of the Fe abundance in active stars with coronae much hotter than the Sun’s have tended to suggest abundances smaller than photospheric (Mewe et al., 1996; Drake, 1996), in contrast to the solar behaviour we find here.
We have reported here a single measurement of the Fe abundance. Spectroscopic studies of relative abundances suggest that they may vary considerably from flare to flare and from one region to the next (Sylwester et al., 1984; Saba, 1995; Sylwester et al., 1998), so it is clearly important to confirm our measurement. We have additional data sets which will be published in a longer paper elsewhere, but with larger uncertainties expected in the radio fluxes, and expect to carry out further studies of this type in the future.
Acknowledgments
This research at the University of Maryland was carried out primarily under a SOHO GI grant from NASA, NAG 5–4954. Solar radiophysics at the University of Maryland is also supported by NSF grant ATM 96-12738 and NASA grants NAG 5-7370, NAG 5-6257 and NAG 5-7901. We thank Richard Harrison, Andrzej Fludra and the CDS operators for their assistance with the project, and Barry Clark of NRAO for scheduling the VLA observations to match those of SOHO. We thank the CHIANTI consortium for their efforts to make atomic data readily accessible.
References
- Allen (1973) Allen, C. W. 1973, Astrophysical Quantities (London: Athlone Press)
- Anders & Grevesse (1989) Anders, E. & Grevesse, N. 1989, Geochim. Cosmochim. Acta, 53, 197
- Arnaud & Raymond (1992) Arnaud, M. & Raymond, J. 1992, ApJ, 398, 394
- Arnaud & Rothenflug (1985) Arnaud, M. & Rothenflug, R. 1985, A&AS, 60, 425
- Brosius et al. (1996) Brosius, J. W., Davila, J. M., Thomas, R. J., & Monsignori-Fossi, B. C. 1996, ApJS, 106, 143
- Dere et al. (1997) Dere, K. P., Landi, E., , Mason, H. E., Monsignori Fossi, B. C., & Young, P. R. 1997, A&AS, 125, 149
- Drake (1996) Drake, S. A. 1996, in Cosmic Abundances, ed. S. S. Holt & G. Sonneborn (San Francisco: Astron. Soc. Pacific), 215
- Dulk (1985) Dulk, G. A. 1985, ARA&A, 23, 169
- Feldman (1992) Feldman, U. 1992, Physica Scripta, 46, 202
- Fludra et al. (1999) Fludra, A., Saba, J. L. R., Henoux, J.-C., Murphy, R. J., Reames, D. V., Lemen, J. R., Strong, K. T., Sylwester, J., & Widing, K. G. 1999, in The Many Faces of the Sun, ed. K. T. Strong, J. L. R. Saba, B. M. Haisch, & J. T. Schmelz (Berlin: Springer Verlag), 89
- Fludra & Schmelz (1999) Fludra, A. & Schmelz, J. T. 1999, A&A, 348, 286
- Grevesse & Anders (1991) Grevesse, N. & Anders, E. 1991, in Solar Interior and Atmosphere, ed. A. N. Cox, W. C. Livingston, & M. S. Matthews (Tucson: University of Arizona Press), 1227
- Landi et al. (1999) Landi, E., Landini, M., Dere, K. P., Young, P. R., & Mason, H. E. 1999, A&AS, 135, 339
- Mewe et al. (1996) Mewe, R., Kaastra, J., White, S. M., & Pallavicini, R. 1996, A&A, 315, 170
- Meyer (1985) Meyer, J.-P. 1985, ApJS, 57, 173
- Reames (1992) Reames, D. V. 1992, in Coronal Streamers, Coronal Loops and Coronal and Solar Wind Composition, ed. V. Domingo (Noordwijk: ESA SP 348), 315
- Reames (1995) Reames, D. V. 1995, Adv. Space Res., 15, 41
- Reames (1999) —. 1999, ApJ, 518, 473
- Saba (1995) Saba, J. L. R. 1995, Adv. Space Res., 15, no. 7, 13
- Sylwester et al. (1998) Sylwester, J., Lemen, J. R., Bentley, R. D., Fludra, A., & Zolcinski, M. 1998, ApJ, 501, 397
- Sylwester et al. (1984) Sylwester, J., Lemen, J. R., & Mewe, R. 1984, Nat., 310, 665
- Thomas et al. (2000) Thomas, R. J., Thompson, W. T., Kent, B. J., & Hollandt, J. 2000, ApJ, in preparation
- Thompson (1998) Thompson, W. T. 1998, CDS Software Note 49
- Veck & Parkinson (1981) Veck, N. J. & Parkinson, J. H. 1981, MNRAS, 197, 41
- Waljeski et al. (1994) Waljeski, K., Moses, D., Dere, K. P., Saba, J. L. R., Strong, K. T., Webb, D. F., & Zarro, D. M. 1994, ApJ, 429, 909