A THEORETICAL LIGHT-CURVE MODEL FOR THE RECURRENT NOVA V394 CORONAE AUSTRINAE
Abstract
A theoretical light curve for the 1987 outburst of V394 Coronae Austrinae (V394 CrA) is modeled to obtain various physical parameters of this recurrent nova. We then apply the same set of parameters to a quiescent phase and confirm that these parameters give a unified picture of the binary. Our V394 CrA model consists of a very massive white dwarf (WD) with an accretion disk (ACDK) having a flaring-up rim, and a lobe-filling, slightly evolved, main-sequence star (MS). The model includes irradiation effects of the MS and the ACDK by the WD. The early visual light curve ( days after the optical maximum) is well reproduced by a thermonuclear runaway model on a very massive WD close to the Chandrasekhar limit (). The ensuing plateau phase ( days) is also reproduced by the combination of a slightly irradiated MS and a fully irradiated flaring-up disk with a radius times the Roche lobe size. The best fit parameters are the WD mass , the companion mass ( is acceptable), the inclination angle of the orbit 65—68, and the flaring-up rim times the disk radius. The envelope mass at the optical peak is estimated to be , which indicates an average mass accretion rate of yr-1 during the quiescent phase between the 1949 and 1987 outbursts. In the quiescent phase, we properly include an accretion luminosity of the WD and a viscous luminosity of the ACDK as well as the irradiation effects of the ACDK and MS by the WD. The observed light curve can be reproduced with a disk size of 0.7 times the Roche lobe size and a rather slim thickness of 0.05 times the accretion disk size at the rim. About 0.5 mag sinusoidal variation of the light curve requires the mass accretion rate higher than yr-1, which is consistent with the above estimation from the 1987 outburst. These newly obtained quantities are exactly the same as those predicted in a new progenitor model of Type Ia supernovae.
Subject headings:
accretion, accretion disks — binaries: close — novae, cataclysmic variables — stars: individual (V394 CrA)1. INTRODUCTION
Type Ia supernovae (SNe Ia) are one of the most luminous explosive events of stars. Recently, SNe Ia have been used as good distance indicators which provide a promising tool for determining cosmological parameters because of their almost uniform maximum luminosities (Riess et al. (1998); Perlmutter et al. (1999)). These both groups derived the maximum luminosities () of SNe Ia completely empirically from the shape of the light curve (LCS) of nearby SNe Ia, and assumed that the same –LCS relation holds for high red-shift SNe Ia. To be sure of any systematic biases, the physics of SNe Ia must be understood completely. By far, one of the greatest problems facing SN Ia theorists is the lack of a real progenitor (e.g., Livio (1999) for a recent review). Finding a reliable progenitor is urgently required in SN Ia research. Recurrent novae are probably the best candidate for this target (e.g., Starrfield, Sparks, & Truran 1985; Hachisu et al. 1999b; Hachisu, Kato, & Nomoto 1999a).
Recently, the recurrent nova U Sco underwent the sixth recorded outburst on February 25, 1999. For the first time, a complete light curve has been obtained from the rising phase to the final fading phase toward quiescence through the mid-plateau phase (e.g., Matsumoto, Kato, & Hachisu 2000). Constructing a theoretical light curve of the outburst, Hachisu et al. (2000a) have estimated various physical parameters of U Sco: (1) The early linear phase of the outburst ( days after the optical maximum) is well reproduced by a thermonuclear runaway model on a white dwarf (WD). (2) The envelope mass at the optical maximum is estimated to be , which results in the mass transfer rate of yr-1 during the quiescent phase between the 1987 and 1999 outbursts. (3) About 60% of the envelope mass has been blown off in the outburst wind but the residual 40% () of the envelope mass has been left and accumulated on the white dwarf. Therefore, the net mass increasing rate of the white dwarf is yr-1, which meets the condition for SN Ia explosions of carbon-oxygen cores (Nomoto & Kondo (1991)). Thus, Hachisu et al. (2000a, 2000b) have concluded that the white dwarf mass in U Sco will reach the critical mass (, taken from Nomoto, Thielemann, & Yokoi 1984) in quite a near future and explode as an SN Ia. Therefore, we regard that U Sco is a very strong candidate for the immediate progenitor of SNe Ia.
It has been suggested that the recurrent nova V394 CrA is a twin system of U Sco because of its almost same decline rate of the early light curve and spectrum feature during the outburst (e.g., Sekiguchi et al. (1989)). It is very likely that the physical parameters obtained for U Sco are common to V394 CrA. In this paper, we derive various physical quantities of V394 CrA, both during the 1987 outburst and in quiescence, by constructing the same theoretical light curve models as for U Sco, and examine whether or not V394 CrA is an immediate progenitor of SNe Ia. In §2, we briefly describe our light curve model during the outburst and present the fitting results for the 1987 outburst of V394 CrA. In §3, based on the physical parameters obtained in §2, we construct theoretical light curves for the quiescent phase of V394 CrA and confirm that the parameters during the outburst are consistent with those in quiescence. Discussion follows in §4, especially for relevance to SN Ia progenitors.
2. LIGHT CURVES FOR THE 1987 OUTBURST
The orbital period of V394 CrA has been determined to be days by Schaefer (1990). Here, we adopt the ephemeris of HJD 2,447,000.250+0.7577 at the epoch of the main-sequence companion in front. The orbit of the companion star is assumed to be circular. Our theoretical light curve model has already been described in Hachisu et al. (2000a) for outburst phases and in Hachisu et al. (2000b) for quiescent phases of U Sco. The total visual light is calculated from three components of the system: (1) the WD photosphere, (2) the MS photosphere, which fills its Roche lobe, and (3) the accretion disk (ACDK) surface, the size and thickness of which are simply defined by two parameters, and , as
| (1) |
and
| (2) |
where is the outer edge of the ACDK, the effective radius of the inner critical Roche lobe for the WD component, and the height of the surface from the equatorial plane, the distance on the equatorial plane from the center of the WD as seen in Figure 1. Here, we adopt -squared law (), otherwise specified, to mimic the effect of flaring-up at the rim of the ACDK (e.g., Schandl, Meyer-Hofmeister, & Meyer 1997).
It has been established that the WD photosphere expands to a giant size at the optical maximum and then it decays gradually to the original size of the WD in quiescence, with the bolometric luminosity being kept near the Eddington luminosity (e.g., Starrfield, Sparks, & Shaviv 1988). An optically thick wind is blowing from the WD during the outburst, which plays a key role in determining the nova duration because a large part of the envelope mass is carried away by the wind. The development of the WD photosphere during the outburst is followed by a series of optically thick wind solutions (Kato & Hachisu (1994)). Each envelope solution is uniquely specified by the envelope mass, which is decreasing in time due to wind and nuclear burning. We have calculated solutions for five WD masses of , 1.37, 1.36, 1.35, and 1.3 with different hydrogen contents of 0.04, 0.05, 0.06, 0.07, 0.08, 0.10, and 0.15, in mass weight. The numerical method and physical properties of the solutions are described in Kato and Hachisu (1994), and also in Kato (1999), where we use the revised OPAL opacity (Iglesias & Rogers (1996)).
Assuming a blackbody photosphere of the WD envelope, we have estimated the visual magnitude with a response function given by Allen (1973). For simplicity, we do not consider the limb-darkening effect. The early 10 days light curve of V394 CrA is mainly determined by the WD photosphere because the photospheric radius is larger than or as large as the binary size and much brighter than the MS and the ACDK. The decline rate during the early 10 days (—10 days after the optical maximum) depends very sensitively on the WD mass but hardly on the hydrogen content (Kato (1999)) or on the MS mass as described in Hachisu et al. (2000a). Thus, we obtain by fitting of light curves.
The light curves are calculated for four companion masses, i.e., , 1.1, 1.5 and . Since we obtain similar light curves for all of these four cases, we show here only the results for . For a pair WD MS, for example, we have the separation , the effective radius of the inner critical Roche lobe , and , for the WD and MS (Fig. 1), respectively.
In the plateau phase of the light curve (—30 days), i.e., when the WD photosphere is much smaller than the binary size, the light curve is determined mainly by the irradiations of the ACDK and the MS as shown in the 1999 U Sco outburst (Hachisu et al. 2000a ). Here, we assume that the surfaces of the MS and of the ACDK emit photons as a black-body at a local temperature of the surfaces heated by the WD photosphere. We assume further that a half of the absorbed energy is emitted from the surfaces of the MS and of the ACDK (50% efficiency, i.e., , and ), while the other is carried into interior of the accretion disk and eventually brought into the WD. The unheated surface temperatures are assumed to be K for the MS and to be K for the ACDK including the disk rim. The viscous heating of the ACDK is neglected during the outburst because it is much smaller than that of the irradiation effects. We have checked different temperatures of , 6000 K and , 5000 K, but could not find any significant differences in the light curves.
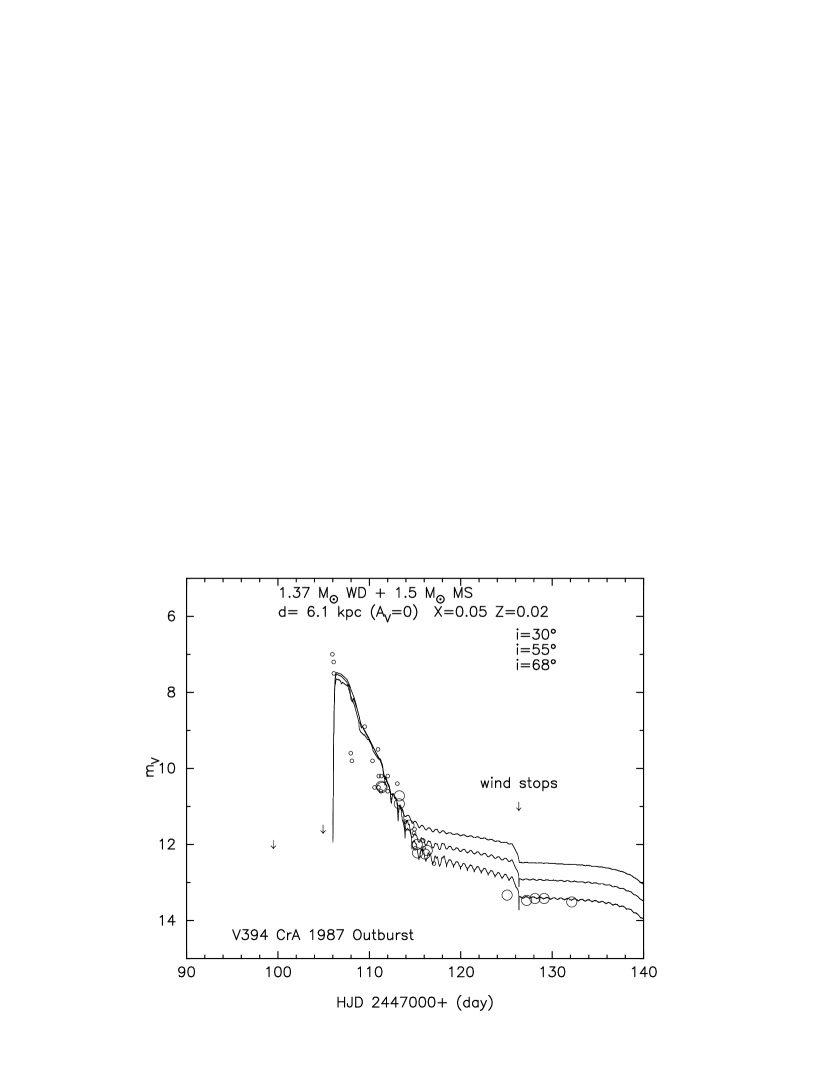
The luminosity of the accretion disk depends strongly on both the thickness and the size in the plateau phase. We have examined a total of 160 cases for the set of , which is the product of 16 cases of 0.5—2.0 by 0.1 step and 10 cases of 0.05—0.50 by 0.05 step. Here, we have adopted the same set of (, ) as of the U Sco 1999 outburst (Hachisu et al. 2000a ), i.e., 1.4 (1.2), and 0.30 (0.35), for the outburst wind phase (for the static phase). The hydrogen content cannot be determined from the light curve fitting mainly because the observation of the 1987 outburst does not cover the final decay phase toward quiescence. So we have adopted the same value of as in the U Sco 1999 outburst (Hachisu et al. 2000a ). Then, the optically thick wind stops 20 days after the optical maximum as shown in Figure 2. Because the inclination angle of the orbit is not known yet, we have fitted the light curve by changing the inclination angle, i.e., , , , , , , , , , , and . Some of them are plotted in Figure 2. The visual magnitude of the 1987 outburst can be reproduced when the inclination angle is between and except for the first day of the outburst. It is almost certain that the visual light during the first day exceeds the Eddington limit because our optically thick wind solutions do not produce super Eddington luminosities.
Based on the best fitted solutions, we have estimated the envelope mass at the optical maximum as , which indicates a mass accretion rate of yr-1 during the quiescent phase between the 1949 and 1987 outbursts if no WD matter has been dredged up. About 77% () of the envelope mass has been blown off in the outburst wind while the residual 23% () has been left and added to the helium layer of the WD. Thus, the net mass increasing rate of the WD is yr-1.
The distance to V394 CrA is estimated to be 6.1 kpc for no absorption (). We discuss the distance to V394 CrA in more detail, in the next section, to solve the discrepancy of the distance estimations between in quiescence and in bursting phases.
3. LIGHT CURVES IN QUIESCENCE
In a quiescent phase, we have adopted the same binary model in the 1987 outburst phase except for the disk shape (see Fig. 3), that is, we assume the WD mass as , the accretion luminosity of the WD as
| (3) |
(e.g., Starrfield et al. (1988)) and the viscous luminosity and the irradiation effect of the ACDK as
| (4) |
(e.g., Schandl et al. (1997)), where and are the total and intrinsic luminosities of the WD, respectively, the gravitational constant, is the mass accretion rate of the WD, is the radius of the WD, is the Stefan-Boltzmann constant, is the surface temperature of the ACDK, is the distance from the center of the WD, and is the incident angle of the surface. The accretion luminosity of the WD is as large as for yr-1. The unheated temperatures are assumed to be 4000 K at the disk rim and 5000 K at the MS photosphere.
Figure 4 shows the observational points (open circles) by Schaefer (1990) together with our calculated light curve (thick solid line) for the suggested mass accretion rate of To fit our theoretical light curves with Schaefer’s (1990) observational points, we have calculated light curves by changing the parameters of —1.0 by 0.1 step, —0.50 by 0.05 step, —6000 K by 1000 K step, and 4000 K at the disk rim, —1000 by 100 step and 1000—5000 by 1000 step and — by step and seek for the best fit model for each mass accretion rate. The best fit parameters obtained are shown in the figures (also see Table 1 for the other mass accretion rates of (0.1—5.0) yr-1).
Then we have calculated the theoretical color index for these best fit models. Here, we explain only the case of yr-1. because the 1987 outburst model suggests an average mass accretion rate of yr-1 during the quiescent phase between the 1949 and 1987 outbursts. By fitting, we obtain the apparent distance modulus of , which corresponds to the distance of 34 kpc without absorption (). On the other hand, we obtained a rather blue color index of at . This suggests a large color excess of with the observed color of at by Schaefer (1990). Here, the suffixes and represent the theoretically calculated values and the observational values, respectively. Then, we have a large absorption of and . Thus, we obtain the distance of 4.2 kpc. Then, V394 CrA lies pc below the Galactic plane (, ).
The distance of 4.2 kpc indicates an absorption of during the outburst (6.1 kpc for ), i.e., . Then, we have and . On the other hand, Duerbeck (1988) suggested an absorption of from the nearby distance-interstellar absorption relation by Neckel and Klare (1980), which is consistent with our estimation of the absorption during the 1987 outburst. Thus, we may suggest that the intrinsic absorber of V394 CrA is blown off during the outburst as discussed in U Sco (Hachisu et al. 2000b ).
4. DISCUSSION
Even for much different mass accretion rates, the distance to V394 CrA has been estimated not to be so much different from 4.2 kpc as tabulated in Table 1. For lower mass accretion rates such as yr-1, however, we need the 100% irradiation efficiency of the MS () or an intrinsic luminosity of the WD as large as for the 50% efficiency (), in order to reproduce the mag sinusoidal variation. We also need an intrinsic luminosity of the WD as large as 300 both for yr-1 and for yr-1, and 200 for yr-1, as summarized in Table 1.
The brightness of the system depends on various model parameters adopted here, that is, the efficiency of the irradiations and , the intrinsic luminosity of the WD , the power of the disk shape . However, the distance estimation itself is hardly affected even if we introduce the different values of the parameters, as clearly shown in Table 2. Thus, we may conclude that the determination of the distance to V394 CrA in quiescence is rather robust as has already been shown in U Sco (Hachisu et al. 2000a , 2000b).
About 0.5 mag sinusoidal variation of the light curve during the quiescence needs a relatively large reflection of the companion star as calculated in Figure 4, thus indicating a relatively large luminosity of the WD photosphere. If the intrinsic luminosity of the WD is negligibly small compared with the accretion luminosity (e.g., the nuclear burning is smaller than the accretion luminosity), the mass accretion rate should be higher than yr-1 because the efficiency of the irradiation effect must be smaller than 100%, which is consistent with our estimation of yr-1 derived from the envelope mass at the optical maximum.
These systems with relatively high mass accretion rates are exactly the same as those proposed by Hachisu et al. (1999b) as a progenitor system of SNe Ia (see also Li & van den Heuvel (1997)). Using the same simplified evolutional model as described in Hachisu et al. (1999b), we have followed binary evolutions for various pairs with the initial sets of (, , ), i.e., for the initial primary masses of , 5, 6, 7, and , the initial secondary masses of — by step, and the initial separations of — by step. Starting from the initial set (, , ), for example, we have obtained a binary system of , , and days, after the binary underwent the first common envelope evolution and then the primary naked helium star evolved to a helium giant and had transferred helium to the secondary MS.
Then, the secondary MS has slightly evolved to expand and filled its Roche lobe. Mass transfer begins from the MS to the WD. We have further followed evolution of the binary until the binary reaches and days at the same time, that is, we regard the binary as V394 CrA when both the conditions, and days, are satisfied at the same time. Then, we obtain the present state of V394 CrA having the secondary mass of and the mass transfer rate of yr-1. In our evolutionary model, this binary system will soon explode as an SN Ia when the WD mass reaches . The mass transfer rate of our evolutionary model is consistent with yr-1 estimated from the light curve fitting.
Finally, we may conclude that V394 CrA is the second strong candidate for Type Ia progenitors, next to U Sco (Hachisu et al. 2000a, 2000b).
References
- Allen (1973) Allen, C. W. 1973, Astrophysical Quantities (London: The Athlone Press), chap. 10
- Duerbeck (1988) Duerbeck, H. W. 1988, A&A, 197, 148
- (3) Hachisu, I., Kato, M., Kato, T., & Matsumoto, K. 2000a, ApJ, 528, L97
- (4) Hachisu, I., Kato, M., Kato, T., Matsumoto, K., & Nomoto, K. 2000b, ApJ, in press (astro-ph/0003322)
- (5) Hachisu, I., Kato, M., & Nomoto, K. 1999a, ApJ, 522, 487
- (6) Hachisu, I., Kato, M., Nomoto, K., & Umeda, H. 1999b, ApJ, 519, 314
- Iglesias & Rogers (1996) Iglesias, C. A., & Rogers, F. 1996, ApJ, 464, 943
- Kato (1999) Kato, M. 1999, PASJ, 51, 525
- Kato & Hachisu (1994) Kato, M., & Hachisu, I., 1994, ApJ, 437, 802
- Li & van den Heuvel (1997) Li, X.-D., van den Heuvel, E. P. J. 1997, A&A, 322, L9
- Livio (1999) Livio, M. 1999, Type Ia Supernovae: Theory and Cosmology, (Cambridge: Cambridge Univ. Press), in press (astro-ph/9903264)
- Matsumoto et al. (2000) Matsumoto, K., Kato, T., & Hachisu, I. 2000, PASJ, submitted
- Neckel and Klare (1980) Neckel, T., & Klare, G. 1980, A&AS, 42, 251
- Nomoto & Kondo (1991) Nomoto, K., & Kondo, Y. 1991, ApJ, 367, L19
- Nomoto et al. (1984) Nomoto, K., Thielemann, F., & Yokoi, K. 1984, ApJ, 286, 644
- Perlmutter et al. (1999) Perlmutter, S. et al. 1999, ApJ, 1999, 517, 565
- Riess et al. (1998) Riess, A. G. et al. 1998, AJ, 116, 1009
- Schaefer (1990) Schaefer, B. 1990, ApJ, 355, L39
- Schandl et al. (1997) Schandl, S., Meyer-Hofmeister, E., & Meyer, F. 1997, A&A, 318, 73
- Sekiguchi et al. (1989) Sekiguchi, K. et al., MNRAS, 236, 611
- Starrfield et al. (1988) Starrfield, S., Sparks, W. M., & Shaviv, G. 1988, ApJ, 325, L35
- Starrfield et al. (1985) Starrfield, S., Sparks, W. M., Truran, J. W. 1985, ApJ, 291, 136
| ( yr-1) | () | at | at | (kpc) | |||||
|---|---|---|---|---|---|---|---|---|---|
| 5.0 | 0.0 | 0.10 | 0.5 | 18.45 | 1.22 | 3.83 | 5.05 | 4.8 | |
| 2.5 | 0.0 | 0.05 | 0.5 | 17.96 | 1.14 | 3.58 | 4.72 | 4.4 | |
| 1.5 | 0.0 | 0.05 | 0.5 | 17.66 | 1.10 | 3.46 | 4.56 | 4.2 | |
| 1.0 | 0.0 | 0.05 | 1.0 | 17.49 | 1.05 | 3.30 | 4.35 | 4.3 | |
| 1.0 | 300 | 0.05 | 0.5 | 17.53 | 1.06 | 3.33 | 4.39 | 4.2 | |
| 5.0 | 300 | 0.05 | 0.5 | 17.16 | 1.00 | 3.14 | 4.14 | 4.0 | |
| 2.5 | 300 | 0.05 | 0.5 | 16.86 | 0.94 | 2.95 | 3.89 | 3.9 | |
| 1.0 | 200 | 0.05 | 0.5 | 16.39 | 0.83 | 2.61 | 3.44 | 3.9 |
| modelaainclination angle , mass accretion rate yr-1, disk parameters and , disk surface parameter , irradiation efficiencies and , intrinsic luminosity of the WD for all cases, otherwise specified. | ||||||||
|---|---|---|---|---|---|---|---|---|
| at | at | (kpc) | ||||||
| 1000 | 0.10 | 18.06 | 1.15 | 3.61 | 4.76 | 4.6 | ||
| 2000 | 0.12 | 18.27 | 1.18 | 3.71 | 4.88 | 4.7 | ||
| 0 | 0.10 | 17.84 | 1.11 | 3.49 | 4.60 | 4.5 | ||
| 2000 | 0.05 | 18.01 | 1.13 | 3.55 | 4.68 | 4.6 | ||
| 500 | 0.05 | 18.06 | 1.13 | 3.55 | 4.68 | 4.7 | ||
| 300 | 0.05 | 17.66 | 1.09 | 3.42 | 4.51 | 4.3 | ||
| 0 | 0.05 | 17.69 | 1.10 | 3.46 | 4.56 | 4.2 | ||
| 0 | 0.05 | 17.53 | 1.08 | 3.39 | 4.47 | 4.1 |