Radio Emission from GRO J1655–40 during the 1994 Jet Ejection Episodes
Abstract
We report multifrequency radio observations of GRO J165540 obtained with the Australia Telescope Compact Array, the Molonglo Observatory Synthesis Telescope and the Hartebeesthoek Radio Astronomy Observatory at the time of the major hard X-ray and radio outbursts in 1994 August-September. The radio emission reached levels of the order of a few Jy and was found to be linearly polarized by up to 10%, indicating a synchrotron origin. The light curves are in good agreement with those measured with the VLA, but our closer time sampling has revealed two new short-lived events and significant deviations from a simple exponential decay. The polarization data show that the magnetic field is well ordered and aligned at right angles to the radio jets for most of the monitoring period. The time evolution of the polarization cannot be explained solely in terms of a simple synchrotron bubble model, and we invoke a hybrid ‘core-lobe’ model with a core which contributes both synchrotron and free-free emission and ‘lobes’ which are classical synchrotron emitters.
1 Introduction
The X-ray transient GRO J165540 (Nova Sco 1994) was first detected with the Burst and Transient Source Experiment (BATSE) on board the Compton Gamma-Ray Observatory on 1994 July 27 (Zhang et al. (1994)). Significant flux was observed up to 200 keV and the source reached a luminosity of 1.1 Crab (20–100 keV) on Aug 1. GRO J165540 remained in outburst until about Aug 15, and after a period of quiescence flared again on Sept 6 (Harmon et al. (1995)). The detection of a steeply-rising radio counterpart was first reported by Campbell-Wilson & Hunstead (1994a) following observations with the Molonglo Observatory Synthesis Telescope (MOST) at 843 MHz on 1994 Aug 6 and 11. The flux density continued to increase, reaching 4.2 Jy on 1994 Aug 14 and 5.5 Jy on 1994 Aug 15 (Campbell-Wilson & Hunstead 1994b ). High resolution radio observations using the Very Large Array (VLA), the Very Long Baseline Array (VLBA) (Hjellming & Rupen 1995, hereafter HR95) and the Southern Hemisphere VLBI Experiment (SHEVE) array (Tingay et al. (1995)) showed repeated episodes of relativistic ejections. Three major ejection events on TJD 9577.5, 9584 and 9596 (TJD defined as JD 2440000.5) were observed with the VLA and three on TJD 95741, 96052 and 96685 were recorded with the VLBA (HR (95)). The ejection velocity, after correction for inclination to the line of sight, was inferred to be in the rest frame of GRO J165540, at a position angle of (HR (95)); wiggles about the jet axis were interpreted as precession with a period of d. Photometric observations showed GRO J165540 to be a high-inclination binary system (Bailyn et al. (1995)). Subsequent optical observations led to the determination of a precise mass for the primary, (Orosz & Bailyn (1997)), which is well above the theoretical upper limit for a neutron star and direct evidence for it being a black hole. In addition, Soria et al. (1998) found a 95% confidence limit of for the mass of the primary based on measurements of velocity variations in the He ii disk emission lines, thought to reflect the orbital motion of the primary, and hence confirming GRO J165540 to be a black hole binary. The mass of the secondary, which is classified as F3 IV–F6 IV, is , and the spectroscopic period of the binary is (Orosz & Bailyn (1997)).
During the 1994 ejection events, the radio outbursts from GRO J165540 were monitored in the southern hemisphere by the Molonglo Observatory Synthesis Telescope (MOST), the Australia Telescope Compact Array (ATCA), and the Hartebeesthoek Radio Astronomy Observatory (HartRAO). We discuss below the results of these observations. Sections 2 and 3 describe the MOST, ATCA and HartRAO observations and the resulting light curves. In Section 4 we present the linear polarization data from the ATCA, and we discuss the evolution of the radio spectra in Section 5. We briefly compare our results with those of HR95 in Section 6. Finally, we interpret the polarization data in terms of a ‘core-lobe’ model in Section 7.
2 Observations and data reduction
2.1 MOST
The MOST is an east-west synthesis array comprising two colinear cylindrical paraboloids each 11.6 m wide by 778 m long, separated by a 15 m gap (Mills (1981); Robertson (1991)). The telescope operates at 843 MHz, with a detection bandwidth of 3.25 MHz, and measures right circular polarization (as defined by the IEEE standard). The synthesized beamwidth is FWHM (RA Dec). The telescope forms a comb of 64 real-time fan beams spaced by ; for the observations of GRO J165540 the pointing of the beam set was time shared among three adjoining positions to give a field size of cosec. The background noise in a full 12-hour synthesis image was typically 1.5 mJy rms.
Many GRO J165540 observations were partial syntheses as the observations were fitted in around a previously scheduled observing program. The choice of field center serendipitously included a strong point source ( 900 mJy, J2000 position ) that has subsequently been used as an internal reference source. The flux density calibration was based on short fan-beam scan observations of strong point sources from the list of Campbell-Wilson and Hunstead (1994c). For S mJy the dominant source of error in a synthesis image is the scatter in the pre- and post-observation calibrators; a conservative error of % has been assigned. At lower flux densities the error becomes dominated by noise and, for partial syntheses, residuals arising from incomplete cancellation of strong out-of-field sources. This difficulty can be partly overcome by subtracting a reference image (obtained when GRO J165540 was quiescent) with the same hour angle coverage.
The data processing used standard MOST reduction software. When the source was bright we were able to search for sample-to-sample (24 s) variations in flux density. Such measurements are affected by confusing sources in MOST’s fan beams, by the effects of ionospheric refraction and by slow drifts in telescope calibration. These effects are eliminated or greatly reduced in a full 12-hour synthesis. For this paper, individual sample flux densities were fitted and averaged in blocks of 200 (80 minutes) and then combined in 4–6-hour blocks for tabulation. Full synthesis imaging was used when the source flux density fell below 500 mJy, with flux densities measured using IMFIT in aips.
In addition to the synthesis-mode observations of GRO J165540, spot measurements of flux density were obtained using 4-minute scan observations, bracketed by scans of calibrators. This mode of operation measures the target and calibrator source flux densities using the (same) central beams of the 64-beam block. It was used only when the flux density of GRO J165540 was greater than 1 Jy, with the fit parameters serving as a guide to the presence of confusing sources in the fan-beam response. The final light curve, tabulated in Table 1, contains a mix of flux densities measured from synthesis images, from averaged fits to the synthesis data, and from scan observations, and includes data from a third, weaker outburst which occurred in 1994 Nov (Wu & Hunstead (1997); Hannikainen, Hunstead & Campbell-Wilson (1998)).
2.2 ATCA
Following the report of the intense radio outburst by the MOST, GRO J165540 was monitored as a target-of-opportunity with the ATCA for a period of about twenty days. VLBI observations and H I spectral line observations were also undertaken (McKay & Kesteven (1994); Tingay et al. (1995)).
The ATCA is an earth-rotation aperture synthesis array, comprising six 22-m antennas which can be moved along an east-west railway track to give baselines up to 6 km (Frater, Brooks & Whiteoak (1992)). The observations of GRO J165540 were made at central frequencies of 1.380, 2.378, 4.800, 5.900, 8.640 and 9.200 GHz with 128 MHz bandwidth in two orthogonal linear polarizations. Each observation was typically 10 minutes duration, with the antenna gain and phase calibration derived from regular observations of the point-source calibrator PKS B1740517. The flux density scale was tied to the primary calibrator PKS B1934638, which we assume has flux densities of 14.96, 11.54, 5.83 and 2.84 Jy at 20, 13, 6 and 3 cm (1.4, 2.3, 4.8, 8.6 GHz) respectively (Reynolds (1994)). The 6.0A configuration was used throughout, giving interferometer spacings from 337–5939 m.
The data were reduced using standard flagging and calibration techniques in the miriad package (Sault, Teuben & Wright (1995)). The polarimetric calibration of ATCA data is described in Sault, Killeen & Kesteven (1991). Polarimetric leakages, which are quite stable with time on the ATCA, were determined simultaneously with the antenna gains using either PKS B1934638 or PKS B1740517, both known to be unpolarized. The resultant polarimetric purity of the calibrated data is believed to be better than 0.1%. At all wavelengths, a single round of phase self-calibration was performed on the GRO J165540 data (using a point source model) to eliminate residual phase instability. As the observations placed GRO J165540 at the phase center, we simply summed the real parts of the relevant Stokes visibilities to determine the source flux density; this is equivalent to natural weighting. The errors are dominated by systematic effects. For the total intensity measurements, the errors are smaller than 1% of Stokes I, while for Stokes Q and U they are less than 0.1% of Stokes I. The ATCA total flux densities are tabulated in Table 2.
2.3 HartRAO
Continuum measurements of the flux density of GRO J165540 were made at 3.5 and 6.0 cm using the 26-m telescope of the Hartebeesthoek Radio Astronomy Observatory (HartRAO) situated in Gauteng, South Africa. The observations were made using dual-feed systems operated in a beam-switched Dicke mode. At 3.5 cm (8.58 GHz) the bandwidth was 400 MHz, the beamwidth FWHM and the feed recorded right circular polarization. The 6 cm (5 GHz) receiver had a bandwidth of 800 MHz, a beamwidth of FWHM and the feed was linearly polarized east-west.
The flux density at each wavelength was measured using a five-point stepping sequence in declination to correct for pointing errors in this coordinate; the stepping positions in terms of beam parameters were first null, half-power, on-source, half-power, first null. The five points were fitted to a Gaussian to determine declination pointing errors. Right ascension errors were measured at 6 cm by observing midway between the beams. Right ascension pointing corrections at 3.5 cm were assumed to be the same as at 6 cm. The beam separation was sufficiently close ( or 1.5 times the beamwidth at 6 cm) that the response of the dual-beam Dicke system varied linearly with right ascension in this region. The observed flux density is an average over both beams, corrected for both declination and right ascension pointing errors. Measurements alternated between the two wavelengths with 10 minutes’ integration on each.
Gain curve corrections, determined by G. Nicolson (private communication), were applied to the data. Flux densities were calibrated to an arbitrary scale using a noise diode, and the calibrators 3C 123, 3C 161, 3C 218 (Hydra A), 3C 274 (Virgo A) and 3C 348 were observed occasionally to put the flux densities on the Ott et al. (1994) scale. The HartRAO data are tabulated in Table 3; we note that on some days the scatter among a closely spaced sequence of measurements is somewhat larger than implied by their formal errors.
3 Radio light curves
3.1 MOST and HartRAO
The MOST 843 MHz light curve up to the end of 1994 September is plotted in the top panel of Figure 1. The duration of the ATCA observations is also shown, as are the epochs of specific ejection episodes, as reported by HR (95) from their VLA and VLBA data; we labelled these epochs vla1, vla2, vla3 and vlba1, vlba2, corresponding to TJD 9577.5, 9584, 9596 and TJD 9574, 9605, respectively. The BATSE 20–100 keV light curve (provided by S. N. Zhang and W. S. Paciesas) is plotted in the bottom panel, showing two major hard X-ray outbursts, beginning on TJD and TJD .
Two radio outbursts were observed with the MOST in 1994 August–September, both apparently associated with the hard X-ray bursts detected by BATSE. The MOST data clearly show the rise of the radio flux density lagging behind the rise of the X-ray intensity in the outbursts. During the first X-ray outburst, the radio flux density was still low (S 0.36 Jy) on TJD 9570.60, while the X-ray intensity had already reached its maximum. When the X-ray intensity began to decline, the radio flux density then increased rapidly, reaching a local maximum (S1) of 5.45 Jy on TJD 9579.22. After a brief decline, the flux density rose again and reached a new peak of 7.62 Jy on TJD 9582.13, about two weeks after the X-ray peak. At this point the X-ray intensity had already fallen to a much lower level, but was still above the background. The radio peak in the second outburst (S2) also lagged the X-ray peak, but the delay was shorter. The maximum intensities in the two X-ray bursts were similar, but the second radio burst was obviously weaker.
3.1.1 Short Duration Radio Burst Component
To emphasize some specific features of the temporal evolution of the radio emission, we plot in Figure 2 (upper panel) the MOST 843 MHz and HartRAO 5 GHz flux densities on a logarithmic scale as a function of time. Closely spaced groups of 5 GHz points are plotted as weighted averages. The 843 MHz flux density curve is characterized by short-duration burst components (marked S1 and S2) superimposed on longer-lived components (L1 and L2) which show an approximately exponential decay. HartRAO did not observe GRO J165540 until after the end of S1, but S2 was clearly recorded at 5 GHz. The confirmation of the short duration burst component is an important new result, since neither the VLA (HR (95)) nor the ATCA collected data during these periods. From the MOST data, the short duration components, S1 and S2, have e-folding rise times of days, and S2 decays with an e-folding time of days. The rising time scale for the long duration component cannot be determined from the data, but L1 and L2 have e-folding decay times of days and days respectively. A third short duration event was observed by MOST peaking on TJD which decayed with an e-folding time of days (Table 1; Wu & Hunstead (1997)). In addition, the flare observed in 1996 had an initial e-folding decay time of days, similar in scale to the times quoted above (Hunstead, Wu & Campbell-Wilson (1997)). It is tempting to speculate that event S2 may be a prompt response to the brief hard X-ray event at TJD 9610. A similar association at TJD 9579 can be made for S1 but seems less plausible.
3.2 ATCA
Figure 3 shows the ATCA Stokes I light curves at all six observing frequencies, again plotted on a log-linear scale to emphasize the overall exponential decay; the MOST light curve is included for comparison.
The ATCA observations were initiated during the decay phase of the S1 short duration burst component. It is clear from Figure 3 that the flux density at all six ATCA frequencies declines simultaneously with the MOST flux density between TJD suggesting that the short burst component was present at all frequencies. Following the minimum at TJD the flux density increases for all six ATCA frequencies, reaching a local maximum of 5.49 Jy at 1.4 GHz on TJD 9581.62; note, however, that the overall maximum flux density at frequencies GHz occurs prior to the minimum. For TJD there is a steady decline, with time constants similar to MOST’s at the lower frequencies but shorter at the higher frequencies (4.8–9.2 GHz). Other features, such as the dip at the higher frequencies around TJD 9583 and the rise between 9596 and 9598 at 8.6 GHz, are discussed in later sections.
4 Linear polarization
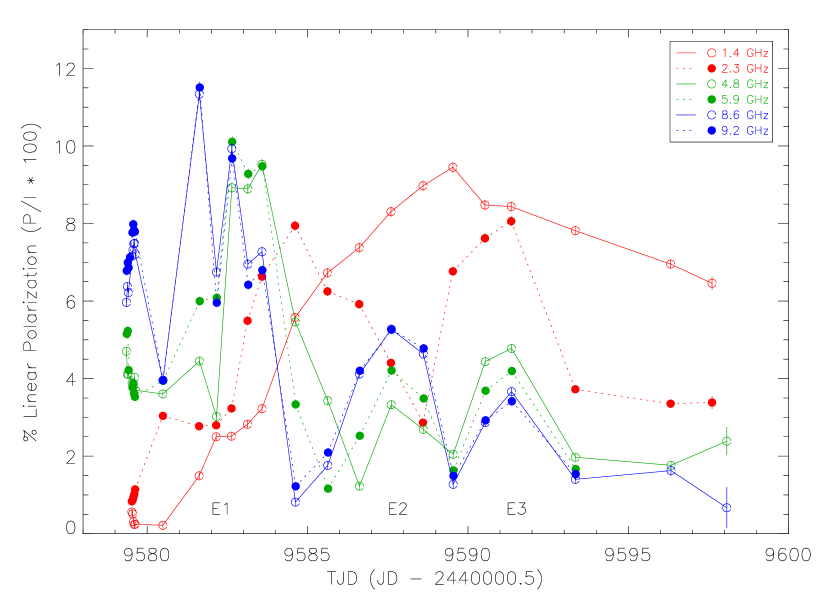
Linear polarization was detected at all six ATCA frequencies throughout the epoch of the observations. The fractional polarization at each frequency, , expressed as a percentage, is plotted together in Figure 4 as a function of time, and the values are listed in Table 4. Because Figure 4 is rather complex, and difficult to interpret on its own, we also include Figure 5 which shows separate overlaid plots of the polarized and total intensity at each frequency.
The frequency-dependent time evolution of the P/I light curves is reminiscent of the ‘expanding synchrotron bubble’ model (e.g., Hjellming & Johnston (1988); Ball & Vlassis (1993)). This simple model is characterized by an optically thick rising phase in which the flux density peaks first at the highest frequencies, followed by delayed peaks of lower intensity at progressively lower frequencies. The decay at all frequencies has a power-law time dependence, with an exponent linked to the electron energy distribution.
We have marked three apparent ‘bubble-type’ events in the linearly polarized ATCA data, and labelled them E1, E2 and E3 in Figures 4 and 5, using the 8.6 and 9.2 GHz curves for reference. However, it is worth noting that the beamsize of the ATCA is larger than the angular size of GRO J165540 (HR95) at all frequencies, so we are observing effects which encompass both the central object and the ejecta. As a result, we can only hope to establish qualitative comparison with the sychrotron bubble model. In fact, contrary to the model prediction, Figure 3 shows that the source was optically thin at TJD 9582, the time of the major peak in flux density.
Figures 4 and 5 show that the first event, E1, is characterized by a series of declining peaks in the 8.6 and 9.2 GHz data. The peaks at 4.8 and 5.9 GHz are less well defined and their decay is clearly delayed with respect to the higher frequencies, in qualitative agreement with the expanding bubble model. The delays at 1.4 and 2.3 GHz are sufficiently large that the contributions from successive ejecta blend with one another and produce a broad peak in both P and P/I. It is interesting to note that the polarized flux density (Fig. 5) reached essentially the same maximum value ( Jy) at all frequencies.
The early stages of event E2 also show qualitative agreement with the expanding synchrotron bubble model, with the rise in P/I at the higher frequencies preceding that at lower frequencies. However, the four higher frequencies all reach a maximum together and then fall to a minimum at the same time, behavior which is not consistent with the model. Event E3 is also inconsistent with the model, as the fractional polarizations at 4.8–9.2 GHz increase and decrease simultaneously. We discuss possible interpretations of this behavior in Section 7.
4.1 Position angle and rotation measure
Faraday rotation of the plane of polarization has been taken into account by fitting the observed position angles (PA) to the usual equation, , where PA0 is the intrinsic position angle, RM is the rotation measure (in rad m-2) and is the wavelength. The data were first interpolated to a common epoch, namely that of the 9.2 GHz observations. The position angle was determined from the equation , the last term reflecting the ambiguities of that may arise at each frequency, and then plotted against . A weighted least-squares linear fit yielded the intrinsic position angle (y-intercept) and the RM (slope). Since the position angle is an average over the beamsize, this means that it is also an average over the central source and the ejecta.
Figure 6 shows the temporal evolution of the intrinsic polarization position angle and rotation measure. The average position angle between TJD 9579 and 9589 was , which is consistent with the position angle of the jets (HR (95)). This implies that the magnetic field is perpendicular to the jets, a phenomenon also seen in the parsec-scale relativistic jets from powerful radio-loud AGN (e.g. Bridle & Perley (1984)). The overall constancy in position angle suggests that the magnetic field is well ordered, and maintains basically the same orientation. However, on TJD 9589.5 the position angle drops to , and after a brief increase to , remains at during the last three observing epochs.
The rotation measure increases rapidly from rad m-2 on TJD 9579.5 to rad m-2 on TJD . It then levels off at rad m-2 for the rest of the observing period, the only exception being an increase to rad m-2 on TJD 9598. Its relative constancy after TJD 9582 suggests that rad m-2 arises from the path through the interstellar medium, while the rapid increase prior to TJD 9582 probably reflects local effects arising at or near the source. The low values of rotation measure around TJD 9579.5 imply that the magnetic field at the source is in the opposite direction to that of the interstellar medium, and the increase to rad m-2 indicates that the orientation of the magnetic field has changed direction and is now more-or-less aligned with that in the interstellar medium.
While Faraday effects predict that the rotation of the plane of polarization is proportional to , the validity of the dependence has been questioned by O’Dea (1989). He presents polarization observations of fifteen core-dominated quasars, arguing that poor fits to the PA vs. data for six of the quasars cannot be due to large apparent RM values combined with ambiguities of , but rather can be accounted for by wavelength-dependent polarization structure. A similar situation may well apply to GRO J165540. The upper panel of Figure 7 shows a least-squares fit to the polarization data on days TJD 9588.60 and 9590.53, which resulted in , rad m-2 and , rad m-2 respectively. Both fits appear secure.
In contrast, the lower panel of Figure 7 shows an example of PA vs. for GRO J165540 on TJD 9589.53, where has been added to both the 1.4 and 2.3 GHz data points (open circles). A least-squares fit to the data (solid line) yielded , rad m-2, and a large reduced of 12.8 for 4 d.o.f. We tried to accommodate the high frequency points by adding and to the 1.4 and 2.3 GHz data respectively (filled circles) and obtained , rad m-2 (dotted line) and an improved of 5.3. However, these fitted parameters are so inconsistent with the values obtained on TJD 9588.60 and 9590.53 (with values of 0.31 and 0.05 respectively) that they seem implausible. Hence, we conclude that the discrepancies seen in the high frequency points on TJD 9589.53, especially those at 8.6 and 9.2 GHz, are due to wavelength dependent polarization structure in the source. Considering that GRO J165540 is a complex time-variable source, and that the observations are integrations over multiple evolving ejecta, a poor fit to a simple dependence is perhaps to be expected.
5 Spectra
5.1 Spectral indices
To fully investigate the evolution of the radio spectrum, two sets of spectral indices were considered: the first set covers the entire MOST/HartRAO monitoring period, from TJD –9618, while the second set concentrates on the ATCA data which, due to better sampling, show more detail but for a shorter period of time. Two-point spectral indices were calculated, assuming spectra of the form . To examine the spectral evolution more closely, low- and high-frequency spectral indices were calculated separately. For the MOST/HartRAO data these consisted of the 843 MHz–5 GHz () and 5–8.58 GHz () bands, while for the ATCA observations the data were divided into the 1.4–2.3 GHz () and 4.8–8.6 GHz () bands. In addition, a ‘global’ spectral index was obtained from the MOST 843 MHz and HartRAO 8.58 GHz data () and the MOST and ATCA 9.2 GHz data ().
The single-dish HartRAO flux densities are less accurate than those from the ATCA (and the VLA) and will be affected by confusing sources in the beam; an image of the field of GRO J165540 is shown in Hunstead et al. (1997). On the other hand, the HartRAO data span a wider time interval than the ATCA and fill in vital gaps in the VLA light curves. Furthermore, while confusion will affect the spectral indices systematically, trends with time will be preserved.
5.1.1 MOST and HartRAO
The lower panel in Figure 2 shows the spectral indices from the MOST and HartRAO data plotted as a function of time. The MOST and HartRAO 8.58 GHz data points were interpolated to the HartRAO 5 GHz epochs. Between TJD 9580–9593 and TJD 9610.5–9616 only the global spectral index is plotted, while from TJD 9593 to 9610, and are plotted separately. Prior to TJD 9593, ranges between and , whereas after TJD 9610 the spectrum is slightly flatter overall with . At the time of the vla3 ejection event (TJD ), the 5–8.58 GHz spectrum inverts to (with a large uncertainty); this mini-outburst is also seen in the VLA data (HR (95)), most notably at 15 and 22 GHz. The 5–8.58 GHz spectral index then returns to the pre-outburst value at TJD . A second outburst, also recorded by the VLA, occurs a few days later, with peaking at at TJD and steepening soon thereafter. The inversion of the spectrum, indicating the emergence of an optically thick component, is consistent with the vlba2 ejection event; the precise time correspondence is, however, uncertain because neither the HartRAO nor VLA dataset covers the critical interval TJD 9601–9606.
5.1.2 MOST and ATCA
Figure 8 shows the spectral indices obtained from the MOST/ATCA datasets plotted as a function of time. To calculate the 843 MHz–9.2 GHz index the MOST data points were interpolated to the 9.2 GHz epochs. The temporal evolution of the three datasets is similar, with and ranging from to , while (excluding the last two points at TJD 9596 and 9598) varies between and , indicating that the high-frequency portion of the spectrum is consistently steeper. There is an overall steepening of the spectrum between TJD 9579 and 9582, as the source becomes optically thin at the lower frequencies. Immediately after this, the high-frequency spectral index begins to flatten and is followed by the lower frequencies on TJD ; the light curves in Figure 3 shows a clear dip and rise at this epoch. This behavior is consistent with the ejection of an optically thick synchrotron component and points to an ejection epoch TJD , somewhat earlier than inferred for the vla2 event (HR (95)). The spectra are flattest on TJD , after which the spectrum steepens. Between TJD 9596.33 and 9598.07, jumps from 0.87 to 0.21, coincident with the vla3 ejection episode; the corresponding increase in the 8.6 GHz flux density can be seen in Figure 3.
5.2 Linear polarization spectra
In Figure 9 we show a montage of overlaid plots of the total (I) and polarized (P) intensity spectra of GRO J165540. To construct the spectra, the flux densities at all frequencies, including 843 MHz (but without polarization), were interpolated to the epochs of the ATCA 9.2 GHz observations. The P spectra, in particular, are especially valuable as diagnostics of ejection events and their evolution with time. We now discuss these spectra in conjunction with the overlaid fractional polarization plot in Figure 4 and the light curves in Figure 3.
On the first day, TJD 9579.6 (four observations spanning two hours), the P spectrum is strongly inverted and the I spectrum shows spectral flattening at the low frequencies. On the following day TJD 9580.50, the I spectrum has become essentially a power law. The P spectrum shows a marked increase at 2.3 GHz but is still optically thick at 1.4 GHz. By TJD 9581.64, near the peak in total intensity, the P spectrum has flattened, with signs of an upturn at the highest frequencies signalling another ejection (E1). The following four P spectra, spanning TJD 9582.17–9583.59, trace a steady increase in the polarized flux density at the lower frequencies, a pattern which is qualitatively consistent with the expansion of the synchrotron-emitting region(s).
At TJD 9584.63 the P spectrum is still not completely transparent at the lower frequencies but has steepened markedly at the higher frequencies, with signs of a new component (E2) appearing at 8.6 and 9.2 GHz. The development of this new component over the next three days is again consistent with the expected trend for an expanding, optically-thick synchrotron bubble. Over this same time interval the low frequency P spectrum has become optically thin. Between TJD 9587.62 and 9588.62 we interpret the persistently high level of P for frequencies GHz as indicating yet another ejection event, even though there is no perceptible change in the total flux density.
From TJD 9588.62 to 9589.55 there is an interesting transition. At all frequencies the total flux density from TJD 9589.55–9591.37 lies well above an extrapolation of the exponential decay seen over the previous four days (Fig. 3), implying that a flat-spectrum component has been introduced. A simultaneous flux density increase across the spectrum is not a characteristic of the synchrotron bubble model, so an alternative interpretation must be sought.
Accompanying the flux density increase at TJD 9589.55 is a sharp decrease in the high-frequency polarized flux density and fractional polarization which occurs simultaneously at the four frequencies GHz. The high-frequency polarized flux ‘reappears’ on TJD 9590.55 and 9591.37 but is quenched again in the same fashion two days later on TJD 9593.36. We put forward a speculative but self-consistent explanation of this behavior in Section 7.
6 Comparison with the VLA/VLBA
In Sections 3, 4 and 5 we have described various aspects of the radio behavior of GRO J165540 as observed with the MOST, ATCA and HartRAO. We now discuss this behavior in the light of the images and light curves recorded with the VLA and VLBA (HR (95)).
The light curves presented here (Figs. 1–3) are completely consistent with those produced at the VLA (HR95), with an outburst peaking on followed by a more-or-less exponential decay. Due to sparser temporal coverage the VLA did not record the two short duration outbursts clearly observed with MOST (S1 and S2) and HartRAO (S2 only).
As discussed in Section 5.2, the ATCA linear polarization spectra (Fig. 9) seem to give the clearest indication of plasmon ejection and expansion. The E1 event is probably composed of several short-lived contributions, beginning at , and possibly associated with ejection event vla1 on TJD 9578. The vla2 event (HR (95)), originating at TJD 9584, is not well defined because of the 6-day gap in VLA coverage from TJD 9583 to 9589. It was noted previously (Section 5.1.2) that the overall spectral indices pointed towards a major outburst beginning near TJD 9582. This interpretation is supported by our polarization spectra which suggest that events beginning near TJD 9581.6 and 9584.6 may be confusing the interpretation of the component positions recorded later by the VLA.
7 Physical Interpretation
The radio emission from candidate black hole binaries is usually attributed to optically thin synchrotron emission or thermal free-free emission. The former explains the steep high frequency part of the power-law spectrum, while the latter is invoked if the spectrum is flat, extending to high frequency.
7.1 Polarization and the Synchrotron Bubble Model
In the simple synchrotron bubble model (e.g. Hjellming & Johnston 1988; Ball & Vlassis 1993) the emission region is a homogeneous spherical, expanding plasma cloud, composed of relativistic electrons and embedded in a magnetic field. As the cloud (bubble) expands adiabatically, the synchrotron emission from it becomes optically thin at progressively lower frequencies. A natural consequence, therefore, is that the total intensity I and fractional polarization P/I will peak first at high frequency and later, with smaller amplitude, at lower frequencies.
How well does this model describe the observed properties of GRO J165540? To begin with, the radio emission is strongly polarized, giving direct evidence for the presence of synchrotron emission (Fig. 4). During event E1, P/I peaks at 9.2 and 8.6 GHz ahead of 5.9 GHz and 4.8 GHz. In addition, the maximum values of P/I at the high frequencies are larger than those at the lower frequencies, the only exception being the 1.4 GHz P/I which is explained as a blend of contributions from several outbursts. Event E2 displays a similar pattern. While these characteristics are in qualitative agreement with the synchrotron bubble model, after event E2 the P/I values at 4.8–9.2 GHz reached a minimum at almost the same time, which is not predicted. Thereafter, during event E3, P and P/I rise and fall simultaneously at 4.8–9.2 GHz, again contrary to model predictions. The polarization spectra (Section 5.2, Figure 9) paint a similar picture. Lack of compliance with the synchrotron bubble model is perhaps not surprising considering the complex collimated structures revealed by the VLBA observations (HR95) and the simplicity of the model itself.
7.2 “Core-Lobe” Model
As polarization is detected, we cannot dismiss the contribution from synchrotron emission. However, we have shown that the synchrotron bubble model cannot provide a satisfactory explanation for the time evolution of the total intensity spectrum or the polarization in GRO J165540. As a modification, we propose a new model which takes into account the fact that VLBI observations of GRO J165540 have shown multiple, time-varying emission regions (HR 95, Tingay et al. 1995). A hybrid model which brings in other emission mechanisms is therefore worth exploring for this very complex system.
There are two examples in the literature where multiple components have been invoked to explain the light curves and/or polarization: V404 Cyg (Han & Hjellming (1992)) and GRS 1915105 (Fender et al. 1999).
-
•
The X-ray transient, V404 Cyg (Han & Hjellming (1992)), shows time-dependent polarization properties similar to those seen in GRO J165540, including little variation in polarization position angle over the 50-day monitoring period. However, in contrast to GRO J165540, V404 Cyg showed a rapid initial decay, in which the spectrum was optically-thin, followed by a much slower decline during which the radio spectrum remained flat or inverted. Han & Hjellming (1992) interpret this behavior as requiring at least two radiating components.
-
•
During a series of major ejection events in the superluminal jet X-ray binary, GRS 1915105, recorded at high angular resolution with MERLIN, Fender et al. (1999) reported that the (stationary) core did not show any significant polarization, even though the approaching component was significantly polarized. They note that the core emission was dominated by flat spectrum oscillations and attribute the lack of polarization to either the superposition of multiple components with different polarization position angles, or to large Faraday depolarization close to the binary system.
In our hybrid model for GRO J165540 we assume that the emission regions consist of a ‘core’ (an extended plasma cloud surrounding the central source) and ‘lobes’ (the expanding plasmons or ejecta). The core represents the ejecta when they are localized near the binary; it is therefore dense and compact, and unresolved in the VLBA image. For a beamwidth 15 mas and an estimated distance of kpc (HR95), we estimate that the corresponding size of the emitting region should be cm. Synchrotron emission is inefficient in the core, because of strong self-absorption. During the initial stage of ejection, the core is most compact and the electron density is highest, making free-free emission a very efficient process. The electrons in the ejecta are presumably accelerated by some non-thermal (magnetic) processes near the black hole, so their energy distribution will have a non-Maxwellian component giving rise to non-thermal free-free emission. If the density in the core is sufficiently high to allow particle collisions, a sub-population of electrons with a Maxwellian distribution will result. These electrons will emit thermal free-free emission.
When the ejecta leave the immediate environment of the binary and expand to form the lobes, which are then resolved in the radio images, they eventually become transparent to synchrotron emission. Moreover, when the density drops, free-free emission becomes less efficient, leaving synchrotron emission, which is no longer self absorbed, as the dominant mechanism for energy loss.
According to this model, events E1 and E2 can be understood as two consecutive episodes of mass ejection. During the onset of the ejection, the lobes and the core are not actually separable. As the emission region is compact, the synchrotron emission is self-absorbed. There is also a free-free component. Hence the overall spectrum shows a turn-over, with the critical frequency determined jointly by the emissivities of the synchrotron and free-free processes. When the individual plasma bubbles begin to separate from the core and expand, their free-free emission becomes unimportant. Moreover, they become progressively transparent to synchrotron emission, first at the high frequencies and then at the low. The emission from the compact core, on the other hand, may still be dominated by free-free emission, which is weak in comparison with the synchrotron emission from the expanding lobes.
Free-free emission has a flat spectrum, and so any free-free emission from the core does not contribute significantly to the low frequency part of the overall spectrum. For most of the time, therefore, the spectral properties and polarization at low frequency are characterized by the synchrotron emission from the ejecta, especially when that emission peaks. However, if the synchrotron component has declined substantially, or there is a substantial brightening in the emission from the core, the spectral index and the fractional polarization will both be affected, becoming observable first at the high frequencies and then at the lower frequencies. The simultaneous occurrence of the minima in P/I between events E2 and E3, together with the simultaneous rise and fall in P/I at the four higher frequencies during event E3, can be readily explained by dilution of the synchrotron emission by a varying free-free contribution from the core. The magnetic field disruption resulting from core-brightening episodes may also explain the apparently anomalous polarization position angles (Fig. 6) at TJD 9589.55, 9593.36, 9596.32 and 9598.07.
A free-free core component can also explain the polarization spectra for . Consideration of the timescales evident in Figure 9, and the VLBI structures (HR (95), Tingay et al. (1995)), tells us that the polarized emission at low frequency comes from regions well away from the core, whereas the high-frequency polarized emission is concentrated close to the core. A sudden increase in the size or electron density in the core will therefore have a significant impact on P at high frequency and little or no effect at low frequency, which seems to explain qualitatively what occurs in the transition between TJD 9588.62 and 9589.55 (Fig. 9). We note that a small but significant upturn in P at TJD 9589.55 between 8.6 and 9.2 GHz probably signals a new ejection event. The following days, TJD 9590.55 and 9591.37, see an increase in the polarized flux at high frequency, presumably because the ejecta have moved outside the region of core absorption. Interpretation of the last two panels in Figure 9 is complicated by the poorer time sampling, but it is plausible that a similar series of events follows the minimum in P and P/I at TJD 9593.36.
Although the hybrid ‘core-lobe’ model has provided a more satisfactory explanation for the radio emission from GRO J165540 during the 1994 ejection episodes, we emphasize that the model is only qualitative at this stage. Further work is necessary to quantify the model, so that fits to the data can be carried out.
8 Summary and conclusions
As Figure 1 shows, there is a relationship between the hard X-ray and radio emission from GRO J165540. The ejection episodes traced by the VLBA both originated during enhanced activity in the hard X-rays, and preceded the radio outbursts recorded with the MOST, suggesting a connection between activity near the event horizon of the black hole and the production of relativistic electrons. One possible explanation for the decline in intensity of the radio outbursts with time could be that the first ejection occurred in an environment that was relatively undisturbed, whereas the subsequent outbursts will have taken place in an environment already disrupted by previous activity (Hjellming et al. (1996)). The implications of the X-ray/radio correlations have been discussed elsewhere (e.g. Harmon et al. (1995)), with a general consensus that the hard X-rays may be indicating enhanced accretion near the black hole which, through processes still not well understood, triggers the formation of relativistic radio jets.
In general the ATCA, MOST and HartRAO flux density light curves agree well with the VLA light curves and ejection epochs reported in HR95. However, the better time sampling in Figures 2 and 3 reveals the presence of short-lived events that were not recorded by the VLA or VLBA, and shows that the light curves do not decay as smooth exponentials. The radio spectra, especially the linear polarization spectra, have proved to be valuable diagnostics of the timing of plasmon ejection events and their subsequent evolution.
The ATCA polarization data show that the magnetic field is aligned at right angles to the radio jets (jet ), except towards the end of the monitoring period when core contributions may have become important. The rotation measure initially shows a contribution local to the GRO J165540 system, but after TJD 9582.5, the rotation measure is roughly constant at 60 rad m-2 which must correspond to the interstellar value.
After examining the time evolution of the total and polarized flux density of GRO J165540 we conclude that there are specific aspects of the behavior which cannot be explained by the simple synchrotron bubble model. We therefore invoke a hybrid ‘core-lobe’ model, with a core which emits by non-thermal (or maybe thermal) free-free emission and lobes which are classical synchrotron emitters. We suggest that a similar model may apply to the other Galactic superluminal jet X-ray binary, GRS 1915+105.
References
- Bailyn et al. (1995) Bailyn, C.D., Orosz, J.A., McClintock, J.E. & Remillard, R.A. 1995, Nature, 378, 157
- Ball & Vlassis (1993) Ball, L. & Vlassis, M. 1993, PASA, 10, 342
- Bridle & Perley (1984) Bridle, A.H. & Perley, R.A. 1984, ARA&A, 22, 319
- Campbell-Wilson & Hunstead (1994a) Campbell-Wilson, D. & Hunstead, R.W. 1994a, IAU Circ. 6052
- (5) Campbell-Wilson, D. & Hunstead, R.W. 1994b, IAU Circ. 6055
- (6) Campbell-Wilson, D. & Hunstead, R.W. 1994c, PASA, 11, 33
- Fender et al. (1999) Fender, R.P., Garrington, S.T., McKay, D.J., Muxlow, T.W.B., Pooley, G.G., Spencer, R.E., Stirling, A.M. & Waltman, E.B. 1999, MNRAS, 304, 865
- Frater, Brooks & Whiteoak (1992) Frater, R.H., Brooks, J.W. & Whiteoak, J.B. 1992, Journal of Electrical and Electronics Engineering, Australia, 12, 103
- Han & Hjellming (1992) Han, X. & Hjellming, R.M. 1992, ApJ, 400, 304
- Hannikainen, Hunstead & Campbell-Wilson (1998) Hannikainen, D., Hunstead, R. & Campbell-Wilson, D. 1998, NewAR, 42, 601
- Harmon et al. (1995) Harmon, B.A., Wilson, C.A., Zhang, S.N., Paciesas, W.S., Fishman, G.J., Hjellming, R.M., Rupen, M.P., Scott, D.M., Briggs, M.S. & Rubin, B.C. 1995 Nature, 374, 703
- Hjellming & Johnston (1988) Hjellming, R.M. & Johnston, K.J. 1988, ApJ, 328, 600
- HR (95) Hjellming, R.M. & Rupen, M.P. 1995, Nature, 375, 464 (HR95)
- Hjellming et al. (1996) Hjellming, R.M, Rupen, M.P., Shrader, C.R., Campbell-Wilson, D. Hunstead, R.W. & McKay, D.J. 1996, ApJ, 470, L105
- Hunstead, Wu & Campbell-Wilson (1997) Hunstead, R.W., Wu, K. & Campbell-Wilson, D. 1997, in Accretion Phenomena and Related Outflows, IAU Colloq. 163, eds. D. T. Wickramasinghe, L. Ferrario & G. Bicknell, ASP Conf. Ser. 121, 63
- McKay & Kesteven (1994) McKay, D.J. & Kesteven, M. 1994, IAU Circ.6062
- Mills (1981) Mills, B.Y. 1981, PASA, 4, 156
- O’Dea (1989) O’Dea, C.P. 1989, ApJ, 210, 35
- Orosz & Bailyn (1997) Orosz, J.A. & Bailyn, C.D. 1997, ApJ, 477, 876
- Ott et al. (1994) Ott, M., Witzel, A., Quirrenbach, A., Krichbaum, T.P., Standke, K.J., Schalinski, C.J. & Hummel, C.A. 1994, A&A, 284, 331
- Reynolds (1994) Reynolds, J.E. 1994, ATNF Technical Document AT/39.3/040, Australia Telescope National Facility
- Robertson (1991) Robertson, J.G. 1991, Aust. J. Physics, 44, 729
- Sault, Teuben & Wright (1995) Sault, R.J., Teuben, P.J. & Wright, M.C.H. 1995, in Astronomical Data Analysis Software and Systems IV, ed. R. Shaw, H.E. Payne, J.J.E. Hayes, Astronomical Society of the Pacific Conference Series, 77, 433-436
- Sault, Killeen & Kesteven (1991) Sault, R.J., Killeen, N.E.B. & Kesteven, M.J. 1991, ATNF Technical Document AT/39.3/015, Australia Telescope National Facility
- Soria et al. (1998) Soria, R., Wickramasinghe, D.T., Hunstead, R.W. & Wu, K. 1998, ApJ, 495, L95
- Tingay et al. (1995) Tingay, S.J., Jauncey, D.L., Preston, R.A., Reynolds, J.E. et al. 1995, Nature, 374, 141
- Wu & Hunstead (1997) Wu, K. & Hunstead, R.W. 1997, in Accretion Phenomena and Related Outflows, IAU Colloq. 163, eds. D. T. Wickramasinghe, L. Ferrario & G. Bicknell, ASP Conf. Ser. 121, 835
- Zhang et al. (1994) Zhang, S.N., Wilson, C.A., Harmon, B.A., Fishman, G.J., Wilson, R.B., Paciesas, W.S., Scott, M. & Rubin, B.C. 1994, IAU Circ.6046


| UT Date | JD 2,440,000.5aaAt mid-observation. | S0.843bbMeasurements made in fan-beam SCAN mode are marked with ∗. |
|---|---|---|
| (Jy) | ||
| 1994 Aug 6 | 9570.60 | 0.362 0.020 |
| 1994 Aug 11 | 9575.59 | 0.792 0.054 |
| 1994 Aug 12 | 9576.33 | 0.950 0.057∗ |
| 1994 Aug 14 | 9578.55 | 4.86 0.15 |
| 9578.61 | 5.33 0.16 | |
| 1994 Aug 15 | 9579.22 | 5.45 0.16∗ |
| 9579.38 | 5.30 0.16 | |
| 9579.55 | 4.97 0.15 | |
| 1994 Aug 16 | 9580.14 | 4.25 0.13∗ |
| 9580.28 | 4.34 0.13 | |
| 9580.51 | 5.08 0.15 | |
| 1994 Aug 17 | 9581.13 | 6.99 0.21∗ |
| 9581.28 | 6.88 0.21 | |
| 9581.50 | 7.08 0.21 | |
| 1994 Aug 18 | 9582.13 | 7.62 0.23∗ |
| 9582.27 | 7.14 0.21 | |
| 9582.52 | 6.39 0.19 | |
| 1994 Aug 19 | 9583.13 | 5.43 0.16∗ |
| 9583.29 | 5.15 0.15 | |
| 9583.54 | 4.96 0.15 | |
| 1994 Aug 20 | 9584.21 | 4.39 0.13∗ |
| 9584.56 | 4.16 0.12 | |
| 1994 Aug 21 | 9585.18 | 3.83 0.11∗ |
| 9585.31 | 3.41 0.10 | |
| 9585.53 | 3.19 0.10 | |
| 1994 Aug 22 | 9586.14 | 2.93 0.09∗ |
| 9586.29 | 2.89 0.09∗ | |
| 9586.46 | 2.71 0.08 | |
| 1994 Aug 23 | 9587.08 | 2.43 0.07∗ |
| 9587.28 | 2.33 0.07∗ | |
| 9587.46 | 2.28 0.07 | |
| 1994 Aug 24 | 9588.39 | 2.10 0.06∗ |
| 9588.52 | 2.11 0.06 | |
| 1994 Aug 25 | 9589.21 | 1.91 0.06∗ |
| 9589.47 | 1.83 0.05 | |
| 1994 Aug 26 | 9590.12 | 1.81 0.05∗ |
| 9590.26 | 1.84 0.06 | |
| 9590.55 | 1.59 0.05 | |
| 1994 Aug 28 | 9592.10 | 1.40 0.04∗ |
| 9592.54 | 1.27 0.04∗ | |
| 1994 Aug 29 | 9593.25 | 1.09 0.03 |
| 9593.48 | 0.998 0.03 | |
| 1994 Sept 1 | 9596.32 | 0.720 0.022∗ |
| 1994 Sept 4 | 9599.24 | 0.444 0.016 |
| 1994 Sept 5 | 9600.46 | 0.413 0.013 |
| 1994 Sept 6 | 9601.43 | 0.412 0.013 |
| 1994 Sept 8 | 9603.46 | 0.393 0.014 |
| 1994 Sept 10 | 9605.51 | 0.457 0.015 |
| 1994 Sept 11 | 9606.20 | 0.472 0.015 |
| 1994 Sept 13 | 9608.35 | 0.511 0.052∗ |
| 1994 Sept 14 | 9609.32 | 1.92 0.06∗ |
| 9609.46 | 2.18 0.07 | |
| 1994 Sept 15 | 9610.27 | 1.86 0.06∗ |
| 9610.42 | 1.84 0.06 | |
| 1994 Sept 16 | 9611.33 | 1.16 0.03∗ |
| 1994 Sept 18 | 9613.19 | 0.565 0.018 |
| 1994 Sept 20 | 9615.43 | 0.505 0.016 |
| 1994 Sept 22 | 9617.43 | 0.322 0.014 |
| 1994 Sept 26 | 9621.41 | 0.248 0.008 |
| 1994 Sept 30 | 9625.42 | 0.151 0.007 |
| 1994 Oct 3 | 9628.11 | 0.121 0.006 |
| 1994 Oct 5 | 9630.38 | 0.077 0.005 |
| 1994 Oct 6 | 9631.42 | 0.078 0.007 |
| 1994 Oct 10 | 9635.40 | 0.047 0.005 |
| 1994 Oct 12 | 9637.38 | 0.040 0.004 |
| 1994 Oct 18 | 9643.39 | 0.034 0.006 |
| 1994 Oct 20 | 9645.21 | 0.024 0.003 |
| 1994 Nov 10 | 9666.37 | 0.232 0.014 |
| 1994 Nov 11 | 9667.29 | 0.205 0.009 |
| 1994 Nov 12 | 9668.16 | 0.116 0.004 |
| 1994 Nov 13 | 9669.07 | 0.074 0.002 |
| 1994 Nov 14 | 9670.32 | 0.056 0.003 |
| 1994 Nov 16 | 9672.33 | 0.075 0.006 |
| UT Date | JD 2,440,000.5bbAt mid-observation. | S1.4 | S2.3 | S4.8 | S5.9 | S8.6 | S9.2 |
|---|---|---|---|---|---|---|---|
| (Jy) | (Jy) | (Jy) | (Jy) | (Jy) | (Jy) | ||
| 1994 Aug 15 | 9579.35 | 2.79 | 1.85 | ||||
| 9579.36 | 2.41 | 1.77 | |||||
| 9579.39 | 2.74 | 1.82 | |||||
| 9579.40 | 2.37 | 1.74 | |||||
| 9579.41 | 2.72 | 1.82 | |||||
| 9579.42 | 2.37 | 1.75 | |||||
| 9579.46 | 1.71 | ||||||
| 9579.52 | 4.29 | 3.52 | |||||
| 9579.53 | 2.52 | 1.66 | |||||
| 9579.54 | 2.18 | 1.57 | |||||
| 9579.55 | 4.23 | 3.45 | |||||
| 9579.56 | 2.47 | 1.61 | |||||
| 9579.57 | 4.18 | 3.39 | 2.13 | 1.52 | |||
| 9579.58 | 2.44 | 1.57 | |||||
| 9579.59 | 2.09 | 1.49 | |||||
| 9579.60 | 4.13 | 3.32 | |||||
| 9579.61 | 2.40 | 1.54 | |||||
| 9579.62 | 4.07 | 3.25 | 2.06 | 1.46 | |||
| 9579.63 | 2.35 | 1.52 | |||||
| 1994 Aug 16 | 9580.49 | 4.71 | 3.50 | 2.35 | 1.57 | ||
| 9580.50 | 2.10 | 1.53 | |||||
| 1994 Aug 17 | 9581.62 | 5.49 | 3.96 | ||||
| 9581.63 | 2.51 | 1.61 | |||||
| 9581.64 | 2.17 | 1.54 | |||||
| 1994 Aug 18 | 9582.15 | 5.35 | 3.88 | ||||
| 9582.16 | 2.45 | 1.60 | |||||
| 9582.17 | 2.09 | 1.52 | |||||
| 9582.63 | 4.34 | 3.13 | |||||
| 9582.64 | 2.06 | 1.39 | |||||
| 9582.65 | 1.78 | 1.30 | |||||
| 1994 Aug 19 | 9583.13 | 3.82 | 2.73 | ||||
| 9583.14 | 1.85 | 1.28 | |||||
| 9583.15 | 1.64 | 1.24 | |||||
| 9583.58 | 3.74 | 2.77 | 1.98 | 1.42 | |||
| 9583.59 | 1.77 | 1.37 | |||||
| 1994 Aug 20 | 9584.61 | 3.05 | 2.38 | ||||
| 9584.62 | 1.82 | 1.32 | |||||
| 9584.63 | 1.55 | 1.20 | |||||
| 1994 Aug 21 | 9585.62 | 2.50 | 2.02 | ||||
| 9585.63 | 1.57 | 1.18 | |||||
| 9585.64 | 1.42 | 1.14 | |||||
| 1994 Aug 22 | 9586.61 | 2.00 | 1.61 | ||||
| 9586.62 | 1.23 | 0.915 | |||||
| 9586.63 | 1.11 | 0.875 | |||||
| 1994 Aug 23 | 9587.60 | 1.68 | 1.31 | ||||
| 9587.61 | 0.962 | 0.683 | |||||
| 9587.62 | 0.858 | 0.662 | |||||
| 1994 Aug 24 | 9588.60 | 1.44 | 1.09 | ||||
| 9588.61 | 0.787 | 0.555 | |||||
| 9588.62 | 0.689 | 0.519 | |||||
| 1994 Aug 25 | 9589.53 | 1.39 | 1.03 | ||||
| 9589.54 | 0.720 | 0.506 | |||||
| 9589.55 | 0.638 | 0.483 | |||||
| 1994 Aug 26 | 9590.53 | 1.24 | 0.918 | ||||
| 9590.54 | 0.642 | 0.448 | |||||
| 9590.55 | 0.566 | 0.426 | |||||
| 1994 Aug 27 | 9591.35 | 1.07 | 0.821 | ||||
| 9591.36 | 0.556 | 0.365 | |||||
| 9591.37 | 0.487 | 0.350 | |||||
| 1994 Aug 29 | 9593.35 | 0.806 | 0.636 | 0.465 | 0.318 | ||
| 9593.36 | 0.413 | 0.306 | |||||
| 1994 Sept 1 | 9596.32 | 0.630 | 0.488 | ||||
| 9596.33 | 0.324 | 0.195 | |||||
| 1994 Sept 2 | 9597.61 | 0.493 | 0.378 | ||||
| 1994 Sept 3 | 9598.07 | 0.241 | 0.212 |
| UT Date | JD 2,440,000.5 | S5 | JD 2,440,000.5 | S8.58 |
|---|---|---|---|---|
| (Jy) | (Jy) | |||
| 1994 Aug 16 | 9580.86 | 1.88 0.06 | 9580.82 | 1.77 0.02 |
| 9580.88 | 2.05 0.04 | 9580.86 | 1.73 0.12 | |
| 9580.90 | 2.00 0.04 | 9580.91 | 1.44 0.02 | |
| 1994 Aug 18 | 9582.74 | 1.88 0.04 | 9582.75 | 1.57 0.03 |
| 9582.77 | 1.77 0.04 | 9582.77 | 1.46 0.02 | |
| 1994 Aug 19 | 9583.52 | 1.59 0.06 | 9583.52 | 1.46 0.02 |
| 9583.53 | 1.76 0.05 | 9583.54 | 1.49 0.06 | |
| 9583.55 | 1.85 0.06 | 9583.55 | 1.68 0.06 | |
| 9583.57 | 1.82 0.05 | 9583.57 | 1.68 0.07 | |
| 1994 Aug 20 | 9584.53 | 1.72 0.06 | 9584.54 | 1.44 0.05 |
| 9584.55 | 1.68 0.05 | 9584.56 | 1.54 0.06 | |
| 9584.57 | 1.69 0.07 | 9584.58 | 1.52 0.07 | |
| 1994 Aug 22 | 9586.52 | 1.14 0.05 | 9586.53 | 1.01 0.05 |
| 9586.54 | 1.12 0.04 | 9586.55 | 0.90 0.03 | |
| 9586.56 | 1.23 0.06 | 9586.57 | 1.16 0.09 | |
| 9586.59 | 1.20 0.06 | 9586.59 | 1.15 0.08 | |
| 1994 Aug 23 | 9587.54 | 0.91 0.05 | 9587.54 | 0.76 0.02 |
| 9587.56 | 0.94 0.07 | 9587.64 | 0.67 0.02 | |
| 9587.63 | 0.83 0.04 | 9587.66 | 0.78 0.01 | |
| 9587.65 | 0.77 0.03 | 9587.68 | 0.84 0.04 | |
| 9587.68 | 0.91 0.05 | 9587.71 | 0.69 0.02 | |
| 9587.70 | 0.77 0.03 | 9587.73 | 0.77 0.07 | |
| 9587.72 | 0.88 0.03 | 9587.75 | 0.76 0.04 | |
| 9587.74 | 0.82 0.03 | 9587.79 | 0.76 0.02 | |
| 9587.77 | 0.88 0.05 | 9587.81 | 0.77 0.02 | |
| 9587.79 | 0.82 0.04 | 9587.84 | 0.88 0.10 | |
| 9587.80 | 0.88 0.06 | 9587.86 | 0.89 0.05 | |
| 9587.83 | 0.88 0.07 | 9587.88 | 0.93 0.02 | |
| 9587.85 | 0.85 0.18 | |||
| 9587.87 | 0.77 0.03 | |||
| 9587.89 | 0.93 0.07 | |||
| 9587.92 | 0.91 0.07 | |||
| 1994 Aug 24 | 9588.50 | 0.63 0.06 | 9588.50 | 0.68 0.07 |
| 9588.52 | 0.67 0.05 | 9588.52 | 0.65 0.03 | |
| 9588.54 | 0.64 0.05 | 9588.55 | 0.59 0.06 | |
| 9588.56 | 0.78 0.05 | 9588.57 | 0.60 0.04 | |
| 1994 Aug 26 | 9590.51 | 0.61 0.04 | 9590.52 | 0.52 0.04 |
| 9590.54 | 0.56 0.04 | 9590.54 | 0.48 0.04 | |
| 9590.58 | 0.65 0.07 | 9590.56 | 0.48 0.03 | |
| 9590.59 | 0.52 0.07 | |||
| 1994 Aug 28 | 9592.59 | 0.32 0.13 | 9592.64 | 0.39 0.05 |
| 9592.62 | 0.39 0.03 | 9592.68 | 0.51 0.07 | |
| 9592.64 | 0.39 0.04 | 9592.70 | 0.39 0.03 | |
| 9592.66 | 0.51 0.10 | 9592.86 | 0.38 0.03 | |
| 9592.67 | 0.53 0.03 | 9592.88 | 0.49 0.09 | |
| 9592.69 | 0.52 0.03 | |||
| 9592.87 | 0.54 0.05 | |||
| 1994 Aug 31 | 9595.83 | 0.36 0.03 | 9595.83 | 0.35 0.03 |
| 9595.85 | 0.37 0.03 | 9595.86 | 0.43 0.02 | |
| 9595.87 | 0.39 0.05 | 9595.88 | 0.49 0.13 | |
| 1994 Sept 2 | 9597.75 | 0.23 0.08 | 9597.75 | 0.27 0.07 |
| 9597.77 | 0.27 0.07 | |||
| 9597.79 | 0.23 0.25 | |||
| 9597.81 | 0.24 0.05 | |||
| 9597.83 | 0.19 0.06 | |||
| 1994 Sept 3 | 9598.85 | 0.19 0.16 | 9598.83 | 0.21 0.01 |
| 9598.87 | 0.11 0.10 | 9598.86 | 0.10 0.05 | |
| 9598.89 | 0.24 0.10 | 9598.90 | 0.12 0.09 | |
| 1994 Sept 5 | 9600.82 | 0.16 0.06 | 9600.81 | 0.12 0.01 |
| 9600.86 | 0.26 0.07 | |||
| 1994 Sept 6 | 9601.49 | 0.19 0.03 | ||
| 9601.53 | 0.18 0.03 | |||
| 9601.56 | 0.18 0.03 | |||
| 1994 Sept 8 | 9603.62 | 0.33 0.08 | ||
| 1994 Sept 11 | 9606.50 | 0.42 0.05 | 9606.47 | 0.38 0.06 |
| 9606.52 | 0.25 0.06 | 9606.51 | 0.44 0.02 | |
| 1994 Sept 12 | 9607.46 | 0.25 0.06 | ||
| 1994 Sept 14 | 9609.46 | 0.65 0.06 | 9609.47 | 0.72 0.07 |
| 9609.80 | 0.69 0.05 | 9609.81 | 0.77 0.06 | |
| 9609.82 | 0.89 0.05 | 9609.85 | 0.78 0.04 | |
| 9609.84 | 0.79 0.04 | 9609.87 | 0.74 0.10 | |
| 9609.87 | 0.81 0.05 | |||
| 1994 Sept 15 | 9610.61 | 0.85 0.03 | 9610.62 | 0.67 0.03 |
| 9610.66 | 0.79 0.03 | 9610.67 | 0.74 0.02 | |
| 9610.70 | 0.74 0.03 | 9610.71 | 0.77 0.04 | |
| 1994 Sept 17 | 9612.80 | 0.32 0.03 | 9612.80 | 0.27 0.04 |
| 9612.82 | 0.25 0.08 | |||
| 1994 Sept 20 | 9615.79 | 0.19 0.03 | 9615.79 | 0.18 0.04 |
| 9615.81 | 0.22 0.01 | |||
| 9615.85 | 0.26 0.02 | |||
| 1994 Sept 21 | 9616.76 | 0.11 0.02 | ||
| 9616.78 | 0.18 0.03 | |||
| 9616.80 | 0.26 0.02 | |||
| 1994 Sept 24 | 9619.71 | 0.13 0.05 | ||
| 9619.76 | 0.15 0.03 | |||
| 1994 Oct 1 | 9626.75 | 0.08 0.04 |
| UT Date | JD 2,440,000.5bbAt mid-observation. | P/I 100 | |||||
|---|---|---|---|---|---|---|---|
| 1.4 GHz | 2.3 GHz | 4.8 GHz | 5.9 GHz | 8.6 GHz | 9.2 GHz | ||
| 1994 Aug 15 | 9579.35 | 4.700.11 | 5.960.12 | ||||
| 9579.36 | 5.150.11 | 6.780.12 | |||||
| 9579.39 | 4.110.11 | 6.370.12 | |||||
| 9579.40 | 5.230.11 | 6.990.12 | |||||
| 9579.41 | 4.110.11 | 6.220.12 | |||||
| 9579.42 | 4.220.11 | 6.860.12 | |||||
| 9579.46 | 7.130.12 | ||||||
| 9579.52 | 0.5610.100 | 0.8340.100 | |||||
| 9579.53 | 3.890.11 | 7.160.12 | |||||
| 9579.54 | 3.780.11 | 7.770.13 | |||||
| 9579.55 | 0.5100.100 | 0.8700.100 | |||||
| 9579.56 | 3.760.11 | 7.320.12 | |||||
| 9579.57 | 0.3110.100 | 0.9450.100 | 3.880.11 | 7.980.13 | |||
| 9579.58 | 3.820.11 | 7.480.12 | |||||
| 9579.59 | 3.620.11 | 7.830.13 | |||||
| 9579.60 | 0.2390.100 | 1.020.10 | |||||
| 9579.61 | 4.030.11 | 7.490.12 | |||||
| 9579.62 | 0.2440.100 | 1.140.10 | 3.530.11 | 7.790.13 | |||
| 9579.63 | 3.700.11 | 7.210.12 | |||||
| 1994 Aug 16 | 9580.49 | 0.2160.100 | 3.040.10 | 3.600.01 | 3.960.11 | ||
| 9580.50 | 3.940.11 | 3.960.11 | |||||
| 1994 Aug 17 | 9581.62 | 1.490.10 | 2.770.10 | ||||
| 9581.63 | 4.450.11 | 11.340.15 | |||||
| 9581.64 | 6.000.12 | 11.510.15 | |||||
| 1994 Aug 18 | 9582.15 | 2.500.10 | 2.800.10 | ||||
| 9582.16 | 3.020.10 | 6.750.12 | |||||
| 9582.17 | 6.080.12 | 5.960.12 | |||||
| 9582.63 | 2.510.10 | 3.230.10 | |||||
| 9582.64 | 8.920.13 | 9.930.14 | |||||
| 9582.65 | 10.110.14 | 9.680.14 | |||||
| 1994 Aug 19 | 9583.13 | 2.820.10 | 5.490.11 | ||||
| 9583.14 | 8.890.13 | 6.950.12 | |||||
| 9583.15 | 9.280.14 | 6.420.12 | |||||
| 9583.58 | 3.220.10 | 6.630.12 | 9.530.14 | 7.270.12 | |||
| 9583.59 | 9.480.14 | 6.800.12 | |||||
| 1994 Aug 20 | 9584.61 | 5.570.11 | 7.940.13 | ||||
| 9584.62 | 5.460.11 | 0.8150.100 | |||||
| 9584.63 | 3.330.10 | 1.220.10 | |||||
| 1994 Aug 21 | 9585.62 | 6.730.12 | 6.250.12 | ||||
| 9585.63 | 3.430.11 | 1.760.10 | |||||
| 9585.64 | 1.160.10 | 2.090.10 | |||||
| 1994 Aug 22 | 9586.61 | 7.380.12 | 5.920.12 | ||||
| 9586.62 | 1.220.10 | 4.110.11 | |||||
| 9586.63 | 2.530.10 | 4.200.11 | |||||
| 1994 Aug 23 | 9587.60 | 8.300.13 | 4.400.11 | ||||
| 9587.61 | 3.330.10 | 5.280.11 | |||||
| 9587.62 | 4.210.11 | 5.260.11 | |||||
| 1994 Aug 24 | 9588.60 | 8.970.13 | 2.860.10 | ||||
| 9588.61 | 2.690.10 | 4.630.11 | |||||
| 9588.62 | 3.490.11 | 4.780.11 | |||||
| 1994 Aug 25 | 9589.53 | 9.450.14 | 6.770.12 | ||||
| 9589.54 | 2.050.10 | 1.270.10 | |||||
| 9589.55 | 1.630.10 | 1.490.10 | |||||
| 1994 Aug 26 | 9590.53 | 8.480.13 | 7.620.13 | ||||
| 9590.54 | 4.440.11 | 2.870.10 | |||||
| 9590.55 | 3.690.11 | 2.920.10 | |||||
| 1994 Aug 27 | 9591.35 | 8.440.13 | 8.060.13 | ||||
| 9591.36 | 4.780.11 | 3.660.11 | |||||
| 9591.37 | 4.200.11 | 3.410.13 | |||||
| 1994 Aug 29 | 9593.35 | 7.810.13 | 3.720.11 | 1.970.10 | 1.400.11 | ||
| 9593.36 | 1.670.10 | 1.530.15 | |||||
| 1994 Sept 1 | 9596.32 | 6.950.12 | 3.350.10 | ||||
| 9596.33 | 1.760.10 | 1.630.14 | |||||
| 1994 Sept 2 | 9597.61 | 6.460.16 | 3.380.17 | ||||
| 1994 Sept 3 | 9598.07 | 2.90.36 | 0.6690.531 | ||||
| JD 2,440,000.5 | PA | RM | ||||
|---|---|---|---|---|---|---|
| rad m-2 | ||||||
| 9579.58 | 41.97 | 1.13aaAverage of first four interpolated points. | 7.3 | 6.9aaAverage of first four interpolated points. | ||
| 9580.50 | 54.5 | 4.6 | 31 | 15 | ||
| 9581.64 | 53.48 | 0.99 | 65.3 | 4.1 | ||
| 9582.17 | 53.7 | 1.6 | 104.1 | 3.7 | ||
| 9582.65 | 49.06 | 0.15 | 59.74 | 0.47 | ||
| 9583.15 | 53.20 | 0.27 | 56.70 | 0.65 | ||
| 9583.59 | 48.95 | 0.55 | 58.66 | 1.25 | ||
| 9584.63 | 44.98 | 0.59 | 61.94 | 0.62 | ||
| 9585.64 | 45.65 | 1.48 | 60.18 | 1.20 | ||
| 9586.63 | 45.47 | 0.66 | 58.87 | 0.59 | ||
| 9587.62 | 42.89 | 0.59 | 58.39 | 0.57 | ||
| 9588.62 | 47.53 | 0.96 | 56.38 | 0.79 | ||
| 9589.55 | 26.1 | 5.0 | 65.5 | 3.2 | ||
| 9590.55 | 38.24 | 0.27 | 63.49 | 0.23 | ||
| 9591.37 | 42.92 | 0.32 | 61.80 | 0.29 | ||
| 9593.36 | 26.86 | 0.88 | 66.03 | 0.51 | ||
| 9596.32 | 19.9 | 3.3bbObtained from the 1.4, 2.3, 4.8 & 8.6 GHz points alone. | 67.0 | 2.0bbObtained from the 1.4, 2.3, 4.8 & 8.6 GHz points alone. | ||
| 9598.07 | 28.0 | 2.8bbObtained from the 1.4, 2.3, 4.8 & 8.6 GHz points alone. | 79.9 | 2.1bbObtained from the 1.4, 2.3, 4.8 & 8.6 GHz points alone. | ||