Coupling of the X-ray and radio emission in the black hole candidate and compact jet source GX 339–4
Abstract
We report the results of a long-term campaign of radio, soft- and hard- X-ray observations of the galactic black hole candidate GX 339–4. In the Low-Hard X-ray state the system displays a strong 3-way linear correlation between soft- and hard-X-rays and radio emission, implying a coupling between the Comptonising corona and a radio-emitting compact jet. In this state the radio emission is linearly polarised at a level of around 2%, with an almost constant polarisation angle, indicative of a favored axis in this system probably related to the compact jet and/or black hole spin axis. In the Off X-ray state the radio emission declines with the X-ray emission to below detectable levels, suggesting that it is simply a lower-luminosity version of the Low-Hard state. In the High-Soft state both the hard-X-ray and radio emission are suppressed. We also note that the transitions from the Low-Hard state to the High-Soft state (and the reverse) are possibly associated with discrete ejection(s) of expanding relativistic plasma.
Key Words.:
stars:individual: GX 339–4, Cyg X–1 – accretion, accretion disk – radio continuum: stars – X-rays: stars – gamma-rays: stars1 Introduction
The X-ray source GX 339–4 is believed to harbor a black hole, based on the similarity of its X-ray spectral and timing properties with the black hole system Cyg X–1 (e.g. Samimi et al. 1979; Maejima et al. 1984; Ilovaisky et al. 1986; Makishima et al. 1986). Black hole candidates are known to exhibit transitions between various X-ray states, distinguished by their different spectral and timing properties. Five distinct X-ray states have been reported, namely the Off state, the Low-Hard state, the Intermediate state, the High-Soft state and the Very High state. See Tanaka & Lewin (1995) for a review of these properties in the Low-Hard and High-Soft states.
GX 339–4 and GS 1124–683 (Ebisawa et al. (1994)) are the only X-ray sources observed in all these states [see Miyamoto et al. (1991) for the Very High state and Méndez & van der Klis (1997) for the Intermediate state in GX 339–4]. Two new X-ray transient sources have also been observed in the Very High state, i.e XTE J1748–288 (Revnivtsev et al. 2000) and XTE J1550–564 (e.g. Sobczak et al. 1999, Homan et al. 2000). The superluminal sources GRO J1655–40 and GRS 1915+105 may also display behaviour related to X-ray spectral state changes (e.g. Méndez et al. 1998, Belloni et al. 2000). Spectral and timing properties of GX 339–4 in the Low-Hard state can be found in Wilms et al. (1999) and Nowak et al. (1999). In the Low-Hard state, a peak in the low-frequency power spectrum is seen at a period of 240 days, and is possibly related to a precessing accretion disk (Nowak et al. 1999).
Black hole candidates can be divided into two different classes of sources: the soft X-ray transients (SXTs) and the persistent black hole candidates. SXTs (Charles (1998)) are, by definition, transient and are usually associated with a low mass and late type stellar companion. GX 339–4 is persistent in soft-X rays (as are the other galactic black hole candidates Cyg X–1, 1E 1740.7–2942 and GRS 1758–258), but at hard X-rays GX 339–4 shows behaviour resembling that of the transient sources (Harmon et al. (1994); Rubin et al. (1998)). We note that LMC X–1 and LMC X–3 can also be considered as persistent black hole candidates in the Large Magellanic Cloud (Tanaka & Lewin (1995)).
Due to the faintness of the stellar companion relative to the accretion disk, the spectral type of the stellar companion of GX 339–4 has not been identified, but it is believed to be a low mass star with a possible orbital period of 14.8 hours (Cowley et al. (1987); Callanan et al. (1992)). Soria et al. (1999) suggested the true orbital period may be twice this value. The distance to GX 339–4 is about 4 kpc (Zdziarski et al. (1998)) with an optical extinction of 3.5 magnitudes (Corbel (1999)). Optical emission in GX 339–4 also displayed the state transitions (e.g. Motch et al. (1985)). GX 339–4 is usually bright and variable (V 15-17 mag.) in the Low-Hard state, faint in the Off state (V 20 mag.) and at an intermediate level in the High-Soft state (V 16.5 mag.). Most of the optical emission is believed to be dominated by the accretion flow, but the physical process behind its origin has not been fully understood (Fabian et al. (1982); Motch et al. (1983), Ilovaisky et al. 1986).
Although GX 339–4 has been studied extensively at high energies, little has been known until recently about its properties in the radio regime. It was discovered as a radio source in 1994 (Sood & Campbell-Wilson 1994) and a possible jet like feature has been reported by Fender et al. (1997a). In the Low-Hard state, Hannikainen et al. (1998) found a correlation between the radio, soft and hard X-rays emission on timescale of the order of 5 days over a period of one year. During the High-Soft state, we have shown that the radio emission from GX 339–4 disappeared until the return to the standard Low-Hard state (Fender et al. 1999b ). This behaviour is reminiscent of that observed in the 1996 High-Soft (or Intermediate) state of Cyg X–1 (Zhang et al. 1997).
This paper presents the results from a long term campaign of radio observations of GX 339–4 with the Australia Telescope Compact Array and the Molonglo Observatory Synthesis Telescope. Following the description of the characteristics of radio emission (light curve, spectra, variability and polarisation) from GX 339–4, we present evidence for the existence of a compact jet in this system. We then focus on the behaviour of GX 339–4 in the various X-ray states, as observed in radio, soft and hard X-rays. We demonstrate a strong coupling in the Low-Hard state of the compact jet with the Comptonising corona.
2 Observations
2.1 Molonglo Observatory Synthesis Telescope
The Molonglo Observatory Synthesis Telescope (MOST) consists of two co-linear cylindrical paraboloid reflectors each 778 m long, 12 m wide, and separated by 15 m (Robertson 1991). It is aligned on an east-west axis. The MOST operates at 843 MHz (35.6 cm) with a 3 MHz bandwidth and synthesises a beam of 4343 cosec() arcsec2 for a field of view at declination . In a full 12-hours observation with a 2323 cosec() arcmin2 field of view, the rms in the final image is 0.6 mJy.
The standard MOST pipeline (McIntyre & Cram 2000) has been used for calibration and imaging. Following the procedure of Hannikainen et al. (1998), we fitted the data from three sources besides GX 339–4 in each observation and scaling the fluxes so that the sum of these three reference sources remained constant (on the assumption that these sources do not vary). The flux values in Table 1 are the fitted peak flux of GX 339–4 multiplied by a correction factor. All point source fits from the synthesized map were performed with the MIRIAD IMFIT routine.
Uncertainties in the flux densities are given by the rms variation across the entire image, ignoring sources brighter than 10 mJy. This somewhat overestimates the peak flux uncertainty for partial synthesis (), because there may be some large-scale variation across the image due to incomplete cancellation of sidelobes. We have set upper limits to be 3 times this value.
2.2 Australia Telescope Compact Array
Since 1994, we have been performing observations with the Australia Telescope Compact Array (ATCA) a few times a year. We also found, using the ATCA archives, observations from 1991 and 1992. The ATCA synthesis telescope is an east-west array consisting of six 22 m antennas with baselines ranging from 31 m to 6 km. The continuum observations have been performed in two frequency bands (with a total bandwidth of 128 MHz for 32 channels), usually at 4800 MHz (6.3 cm) and 8640 MHz (3.5 cm) simultaneously and with sporadic observations at 2368 MHz (12.7 cm) and 1384 MHz (21.7 cm). Various array configurations have been used during these observations.
The ATCA has orthogonal linearly polarized feeds and full Stokes parameters (I, Q, U, V) are recorded at each frequency. B1934-638 was used for absolute flux and bandpass calibration, while B1646–50 or B1722–55 have been used as phase calibrators, in order to calibrate the antenna gains and phases as a function of time and to determine the polarisation leakages. Data are normally integrated over 10 s intervals. GX 339–4 was systematically offset by 10 from the array phase center. The editing, calibration, Fourier transformation, deconvolution and image analysis were carried out with the Multichannel Image Reconstruction, Image Analysis and Display (MIRIAD) software package (Sault et al. (1995); Sault & Killeen (1998)), allowing multifrequency synthesis of all four Stokes parameters. All ATCA results are summarized in Table 1. ATCA flux densities are plotted in Figure 2 in the top panels of Figures 10, 10, 12, 12, 14, 14 and 15.
| ATCA | MOST | ||||||
| Date | MJD | 8640 MHz | 4800 MHz | 2350 MHz | 1440 MHz | 843 MHz | |
| (UT Time) | (days) | (mJy) | (mJy) | (mJy) | (mJy) | (mJy) | spectral index |
| 1991:12:01 | 48591.50 | 1.10 0.10 | 1.60 0.12 | - | - | - | –0.64 |
| 1991:12:13 | 48603.50 | 1.90 0.10 | 2.10 0.10 | - | - | - | –0.17 |
| 1992:04:21 | 48733.50 | 0.60 0.08 | 0.40 0.06 | - | - | - | +0.69 |
| 1994:11:15 | 49671.50 | 11.8 0.10 | 11.7 0.10 | - | - | - | +0.01 |
| 1995:09:03 | 49963.50 | 5.20 0.20 | 5.30 0.20 | - | - | - | –0.03 |
| 1995:09:22 | 49982.50 | 4.5 1.0 | 4.6 1.0 | - | - | - | –0.04 |
| 1996:05:25 | 50228.13 | 0.6 | 1.2 | 1.8 | 1.8 | 2.3 0.7 | |
| 1996:05:27 | 50230.13 | 1.5 | 1.5 | 3.0 | 3.0 | - | - |
| 1996:05:28 | 50231.13 | - | - | - | - | 3.0 | - |
| 1996:07:10 | 50274.67 | 6.20 0.10 | 5.30 0.10 | - | - | - | +0.27 |
| 1996:07:13 | 50277.63 | 7.00 0.10 | 6.40 0.10 | - | - | 6.5 0.6 | + 0.05 |
| 1996:07:14 | 50278.54 | - | - | 6.0 0.1 | 5.2 0.2 | +0.26 | |
| 1996:12:15 | 50432.50 | 2.0 1.0 | 2.0 1.0 | - | - | - | +0.00 |
| 1997:02:04 | 50483.42 | 9.10 0.10 | - | - | - | 7.0 0.6 | +0.11 |
| 1997:02:06 | 50485.47 | - | - | 7.4 0.1 | 6.8 0.2 | 6.6 0.7 | +0.15 |
| 1997:02:11 | 50490.42 | 8.20 0.10 | - | - | - | 5.5 0.7 | +0.12 |
| 1997:02:18 | 50497.46 | 8.70 0.20 | - | 6.0 0.2 | 5.4 0.2 | 5.6 0.7 | +0.23 |
| 1997:04:30 | 50569.00 | 6.10 0.10 | 4.70 0.10 | - | - | - | +0.44 |
| 1997:07:22 | 50651.71 | - | - | - | - | 4.2 0.7 | - |
| 1997:08:01 | 50661.76 | - | - | - | - | 5.8 0.8 | - |
| 1997:08:10 | 50670.65 | - | - | - | - | 4.5 0.7 | - |
| 1997:08:15 | 50675.78 | - | - | - | - | 3.1 0.8 | - |
| 1997:09:14 | 50705.56 | - | - | - | - | 4.9 0.7 | - |
| 1997:10:18 | 50739.47 | - | - | - | - | 6.5 0.7 | - |
| 1997:11:16 | 50768.39 | - | - | - | - | 5.3 0.7 | - |
| 1997:12:07 | 50789.33 | - | - | - | - | 4.9 0.8 | - |
| 1998:01:01 | 50814.26 | - | - | - | - | 4.0 0.8 | - |
| 1998:01:09 | 50822.50 | - | 0.3 | - | - | 1.5 | - |
| 1998:01:10 | 50823.30 | - | - | - | - | 2.7 | - |
| 1998:01:14 | 50828.29 | 2.30 0.05 | 2.90 0.06 | - | - | - | –0.40 |
| 1998:01:26 | 50839.19 | - | - | - | - | 2.1 | - |
| 1998:01:27 | 50840.79 | 0.26 0.04 | 0.32 0.04 | - | - | - | –0.35 |
| 1998:01:31 | 50844.34 | - | - | - | - | 2.7 | - |
| 1998:02:07 | 50851.34 | - | - | - | - | 2.7 | - |
| 1998:02:22 | 50866.12 | - | - | - | - | 2.1 | - |
| 1998:04:03 | 50907.01 | - | - | - | - | 1.8 | - |
| 1998:04:04 | 50908.29 | 0.18 | 0.18 | - | - | - | - |
| 1998:04:18 | 50921.97 | - | - | - | - | 2.1 | - |
| 1998:07:04 | 50998.78 | - | - | - | - | 2.1 | - |
| 1998:08:29 | 51054.60 | - | - | - | - | 2.7 | - |
| 1998:11:12 | 51129.58 | 0.18 | 0.12 | - | - | - | - |
| 1999:01:13 | 51191.50 | - | - | - | 1.0 | - | - |
| 1999:01:18 | 51196.48 | - | - | - | - | 2.7 | - |
| 1999:01:23 | 51201.58 | 0.2 | 0.2 | - | - | - | - |
| 1999:02:13 | 51222.50 | 4.60 0.08 | 6.34 0.08 | - | - | - | –0.54 |
| 1999:02:20 | 51229.33 | - | - | - | - | 5.2 0.9 | - |
| 1999:02:21 | 51230.30 | - | - | - | - | 6.2 1.0 | - |
| 1999:02:25 | 51234.30 | - | - | - | - | 5.5 0.9 | - |
| 1999:03:03 | 51241.21 | 5.74 0.06 | 6.07 0.06 | - | - | - | –0.10 |
| 1999:04:02 | 51271.13 | 5.10 0.07 | 4.75 0.06 | - | - | - | +0.12 |
| 1999:04:22 | 51291.08 | 3.11 0.04 | 2.18 0.05 | - | - | - | +0.60 |
| 1999:05:14 | 51313.17 | 1.44 0.04 | 1.25 0.05 | - | 1.0 | 2.0 | +0.12 |
| 1999:06:25 | 51355.17 | 0.34 0.04 | 0.14 0.03 | - | - | - | - |
| 1999:07:07 | 51367.13 | 0.15 0.03 | 0.13 | - | - | - | - |
| 1999:07:29 | 51389.03 | 0.09 | - | - | - | - | - |
| 1999:08:17 | 51407.79 | 0.27 0.06 | - | - | - | - | - |
| 1999:09:01 | 51422.86 | 0.35 0.05 | - | - | - | - | - |
2.3 CGRO BATSE


The hard X sources in the sky have been continuously monitored by the BATSE instrument (Large Area Detectors) aboard the Compton Gamma - Ray Observatory (CGRO) since its launch in 1991. BATSE consists of eight identical uncollimated NaI(Tl) scintillation detector modules arranged on the corners of CGRO (Fishman et al. 1989). Any portion of the sky is occulted by the Earth several times a day. Using an Earth occultation technique (Harmon et al. (1994)), we were able to produce a detector count rate light curve. With the BATSE instrumental response, these count rates are then fitted using an optically thin thermal bremsstrahlung (OTTB) model at a fixed temperature kT = 60 keV (following the procedure of Rubin et al. 1998). This enables us to determine the daily flux values in the 20 - 100 keV energy band with typical 3 sensitivity of 75 mCrab. OTTB is not the only model able to fit the hard X-ray spectra of GX 339–4 (see Bouchet et al. 1993, Harmon et al. 1994, Grabelsky et al. 1995, Rubin et al. 1998, Trudolyubov et al. 1998, Smith et al. 1999a) but it is sufficiently good for the purpose of getting a daily flux measurement of GX 339–4 in the hard X-ray band. Sources with declination less (or more) than –(+) 43 degrees (which is the case for GX 339-4) will not be occulted for a few days every 52 days, due to spacecraft configuration, and this is responsible for the gaps in the BATSE data. Data points very close to this transition would have very high rms and have been flagged out. Data with nearby interfering sources have also been flagged. These flux measurements are plotted in the middle panel of Figures 10, 10, 12, 12, 14, 14 and 15 (or bottom panel when no soft X-ray data are available).
2.4 RXTE ASM
The All Sky Monitor aboard the Rossi X-ray Timing Explorer (RXTE) scans the X-ray sky in three energy bands (1.3–3 keV, 3–5 keV and 5–12.2 keV) five to ten times a day with typical dwell duration of 90 s. It provides a unique database on the activity in the soft X-ray sky. ASM consists of three Scanning Shadow Cameras with a field of view of 6 90 and a spatial resolution of 3′ 15′. The detectors are Position Sensitive Proportional Counters with a total effective area of 90 cm2. See Levine et al. (1996) for a detailed discussion of the RXTE ASM. The full energy ASM data are displayed in the lower panels of Figure 10, 10, 12, 12, 14, 14 and 15.
3 Radio light curves


3.1 Long term variability
Since the discovery of the radio counterpart by Sood & Campbell-Wilson (1994), GX 339–4 has been occasionally monitored by ATCA and MOST. The radio light curves of GX 339–4 using the MOST telescope at 843 MHz and the ATCA interferometer at 1384, 2368, 4800 and 8640 MHz are displayed in Figures 2 and 2. All these observations have been performed when GX 339–4 was in the Off state, Low-Hard state and High-Soft state. GX 339–4 is detected at a mean level of 5 mJy, with flux variations of 20 % on a timescale of days. Larger flux variations ( 50 %) occur on timescale of weeks. The maximum flux density reached by GX 339–4 during our observations (over a period of 8 years) is 12 mJy on 1994 November 15 at 4800 and 8640 MHz.


We have not detected any strong and brief increase of the radio flux density such as the intense radio flares of the galactic superluminal sources GRS 1915+105 (Rodríguez et al. 1995, Pooley & Fender (1997); Fender et al. 1999a ) or GRO J1655-40 (Hjellming & Rupen (1995), Hannikainen et al. 1999). It is possible that such flaring activity might have not been detected due to the irregular sampling of our observations, as these flares could be as short as a few days (e.g. GS 2023+338, Han & Hjellming (1992)). But based on the similarity of GX 339–4 with Cyg X–1 (see § 4) and on the lack of radio flaring activity in Cyg X–1 (Pooley et al. (1999); Brocksopp et al. (1999)), it is unlikely that flaring behaviour occurs in GX 339–4. We point out that the radio behaviour during the Very High state might be different from that outlined in this paper.
On several occasions, no radio emission has been detected from GX 339–4. These periods are usually associated with state transitions. In 1998 when GX 339–4 entered the High-Soft state, we observed a quenching of the radio emission associated with a suppression of the hard X-ray emission (Fender et al. 1999b ).
3.2 Short term variability
For a source as weak as GX 339–4, it is not possible to generate a statistically meaningful light curve with a time resolution of less than 10 minutes. A typical radio light curve during a 12 hour observation in the Low-Hard state is displayed in Figure 3. The radio flux density is almost constant on timescale of hours (flux variations with amplitudes lower than 25 % cannot be excluded). No radio quasi periodic oscillation (QPOs), similar to GRS 1915+105 (Pooley & Fender 1997), are detected in the Low-Hard state.
Following the quenching of the radio emission during the 1998 High-Soft state, we note that the return of the radio emission occured with an unusually optically thin radio spectrum on 1999 February 13. The radio light curve for this observation (Figure 4) displayed an oscillation of 130 minutes with an amplitude of 30 % of the average flux density. It is also possible that the oscillation at 8640 MHz preceeds the one at 4800 MHz by a few minutes, but this is limited by the sensitivity of ATCA. The rise time for radio emission is 100 minutes, which is the fastest variation detected in the radio regime from GX 339–4. In the 10 seconds lightcurve, there is no indication that the radio light curve is made of individual spikes.
Interstellar scintillation as the origin of this oscillation in the radio regime can be ruled out. Indeed, this effect is known to have a strong wavelength dependence (Romani et al. 1986), which is not observed here as the radio oscillations are essentially identical at both frequencies. We should also note that the “oscillations” in GRS 1915+105 have also been seen to be correlated with infrared and X-ray activity (Pooley & Fender 1997, Mirabel et al. 1998) and therefore cannot result from interstellar scintillation.
The X-ray emission (2-100 keV PCA data) on this date also showed unusually large variations of approximately greater than 2% rms variability on greater than 10 minutes timescales (i.e., frequencies Hz), as opposed to the more usual approximately less than 0.5% rms found in the Low-Hard state (Nowak et al. 1999). These X-ray observations occurred strictly simultaneously with the radio observations and will be discussed in further detail in a future paper. In Figures 5 and 6, we show the mean-subtracted X-ray and 4800 MHz radio lightcurves (with the former being multiplied by a factor of 30). Unfortunately, the X-ray lightcurve (RXTE) shows a number of gaps due to passage through the South Atlantic Anamoly. However, the first X-ray peak, in terms of duration and relative amplitude, is consistent with preceding the final radio peak by approximately 10,000 seconds. Longer simultaneous and uninterupted X-ray/radio observations, however, are required to confirm if such behaviour is characteristic of such a Soft to Hard X-ray transition state.
Based on the interpretation of the radio oscillations in GRS 1915+105 (Pooley & Fender (1997); Belloni et al. (1997); Mirabel et al. (1998)), it is possible that these oscillations correspond to discrete ejection events associated with state transitions.
In GRS 1915+105, the radio oscillations rise when the X-ray dips (Pooley & Fender 1997, Mirabel et al. 1998). We might be seeing directly (Figure 5) the same phenomena without the need to make the shift for Figure 6. If this was the case, the PCA data should show a significant hardening during the dip, as the inner accretion disk region disappears.
4 Characteristics of the radio emission
ATCA observations have been performed simultaneously at two frequencies, giving an estimate of the radio spectrum for every observation. The spectral indices (using a fitting procedure if more than two measurements are available, or = log(Sν) / log(), i.e. Sν ) are listed in Table 1. The spectrum is usually flat or slightly inverted with spectral index of . This inverted spectrum extends from 843 MHz to 9024 MHz (Figure 7). On a few occasions, there are some strong indications that this inverted synchrotron spectrum extends to the near-infrared (Corbel & Fender (2000)). A persistent inverted radio spectrum is not common for most radio emitting X-ray binaries (but see discussion below on Cyg X–1).

Apart from the possible hour ( 100 minutes) variability, the radio flux density of GX 339–4 is variable on timescales of a day. The size of the emitting region (see Table 2) cannot be larger than the minimum variability time scale times the light velocity (assuming no Doppler boosting). This implies an upper limit to the size of the radio emitting region of 2.6 1015 cm (or 170 a.u.). A distance of 4 kpc (Zdziarski et al. (1998); Corbel (1999)) implies an angular diameter of the source smaller than 43 mas. This upper limit is reduced to 1.8 1014 cm (i.e. 12 a.u.) if we take into account the radio rise time of 100 minutes on 1999, February 13, which is equivalent to a maximum angular size of 3 mas.
We can estimate a lower limit to the brightness temperature, TB, according to the relation: Sν = Bν(TB). = /4 is the solid angle subtended by a spherical emitting region of average angular diameter, , and Bν is the Planck function.
| Variability | Size | TB | ||
|---|---|---|---|---|
| (mas) | (cm) | (a.u.) | (K) | |
| One day | 43 | 2.6 1015 | 170 | 1.3 107 |
| 100 minutes | 12 | 1.8 1014 | 12 | 2.6 107 |
From this, we find that the brightness temperature is greater than 1.3 107 K (or 2.6 107 K for the oscillations at 4800 MHz). A coherent emission mechanism implies a smaller size for the emitting region and a higher brightness temperature. The high brightness temperature, associated with the inverted frequency spectra, suggest that GX 339–4 emits via self-absorbed (or optically thick) non-thermal synchrotron radiation from relativistic electrons.
A lower limit on the size of the emitting region (see Table 3), obtained from the inverse Compton losses limit (TB 1012 K) (see Wilms et al. 1999), gives a minimum size of 0.07 mas at 843 MHz, i.e. 4.8 1012 cm or 0.4 a.u. (higher frequencies could arise from a smaller region).
| Tb | Size | ||
|---|---|---|---|
| (K) | (mas) | (cm) | (a.u.) |
| TB 1012 | 0.07 | 4.8 1014 | 0.4 |
We note that if for the observation of 1999 February 13 the 10 ks X-ray/radio delay is real, then this implies a minimum propagation speed of from the X-ray emitting material to the radio emitting material.
The interesting characteristics of the radio spectra of GX 339–4 during the Low-Hard state are that they are continuously flat or inverted for a radio source at about the same intensity level. This is very similar to the radio emission of Cyg X–1 in its Low-Hard state (Martí et al. (1996); Pooley et al. (1999), Brocksopp et al. 1999) or the Z sources (e.g. Hjellming et al. 1990a, Hjellming et al. 1990b). The radio spectrum of Cyg X–1 is flat (i.e. ) up to 220 GHz (Fender et al. 2000b ) with an average flux density of 14 mJy. Although similar, the radio spectrum of Cyg X–1 is significantly much flatter than the one from GX 339–4. For most radio emitting X-ray binaries, optically thick synchrotron emission is usually associated with the beginning of a radio outburst, which then evolves to an optically thin decaying emission (Han & Hjellming (1992); Rodríguez et al. (1995), Fender et al. 1999a, Kuulkers et al. 1999), believed to be the results of the ejection and expansion of relativistic plasma, consistent with the overall picture of the van der Laan model (van der Laan (1966)).
As noted by Hjellming and Han (1995), stable emission from a radio source is difficult to maintain as relativistic plasma tends to expand and therefore implies a decaying radio emission. Relativistic plasmas are almost impossible to confine, therefore one needs a continuous injection of plasma in the radio emitting region in order to produce the stable radio emission. The optically thick spectra are produced from an inhomogeneous source with a range of optical depths. Therefore, the radio emission of GX 339–4 could be explained if one invokes continuous injection of relativistic particles at the base of a compact and conical jet [e.g. Blandford & Knigl (1979) or Hjellming & Johnson (1988)]. In this model, the higher radio frequencies would come from a region closer to the base of the jet (where the optical depth is too high for the lower frequencies).
Pooley et al. (1999) have reported modulation of the radio emission from Cyg X–1 at the orbital period of 5.6 days, with a stronger modulation at higher frequency. This indicates that the higher frequencies come from a region closer to the compact object and therefore at the base of the jet, which is in agreement with the conical jet model, such as the one of Hjellming & Johnson (1988) and also in agreement with basic Blandford and Knigl jet model.
It is interesting to note that a compact and continuous jet has now been detected in Cyg X-1 (Stirling et al. (1998, 2000)) from VLBA observations. The radio emitting region of Cyg X–1 is 2 6 mas with the smallest synthesised beam at 9 GHz (Fender 1999, private communication), which is equivalent to a typical size of ten astronomical units. This is about a factor 10 smaller than the physical size of the compact jet reported by Mirabel & Rodríguez (1999) for GRS 1915+105 in a weak optically thick radio state (similar to the Low-Hard state of GX 339–4 and Cyg X–1).
Such inverted or flat radio spectra, associated with weak radio emission, are commonly found in the compact core of Active Galactic Nuclei and are usually associated with small scale (or compact) jets (Marscher & Gear (1985); Falcke & Biermann (1996)). But as noted in Fender et al. (2000b), the spectra of compact jets in X-ray binaries are much flatter than “flat spectrum” AGNs where a high frequency cut-off is observed in the millimeter regime. Based on these similarities with Cyg X–1 and AGN, it is very likely that the radio emission from GX 339–4 arises from a compact, continuous and conical jet. This is consistent with the results from Wilms et al. (1999), which showed that radio emission from GX 339–4 originates from regions larger than the whole X-ray binary system. The above derived limits on the size of the emitting region in GX 339–4 are consistent with the size of the radio emitting region of Cyg X–1. The spectral index of the radio spectra might be related to the inclination of the compact jet, as suggested in Falcke & Biermann (1999).
5 Linear polarisation
During a session of three full 12 hours observations with ATCA in February 1997, GX 339–4 was bright enough in radio and the observation long enough that we were able to detect a significant amount of linear polarisation from the compact core of GX 339–4. For each observation (1997 February 4, 11 and 18) a level of 2% linearly polarized emission at 8704 MHz is observed with a position angle of the electric field vector of –58.7 8.3°, –74.4 4.7° and –60.0 6.3° respectively, i.e. a nearly constant direction. This is the level expected from optically thick synchrotron emission if one takes into account cellular depolarisation (the theoretical level should be around 12 %, Longair 1994). Measurements of the total intensity at two frequencies indicate that the radio spectra of GX 339–4 were optically thick, which is usual in the Low-Hard state.
Linear polarisation was again detected on 1999 March 3 (two years later) at a higher level of 5 % (both at 4800 MHz and 8640 MHz) during an optically thin radio event associated with the return of radio emission after the 1998 High-Soft state. The position angle of the electric field vector was –65.6 5.3° at 8640 MHz, in agreement with the orientation observed two years before. This suggests that the compact jet component dominates the linearly polarised radio emission. It is important to note that this constant angle indicates a favoured axis in the system, possibly related to the compact jet. The extended feature reported by Fender et al. (1997a) has a direction consistent with this favoured axis. For optically thick synchrotron emission, the electric field vector of the emitted radiation is parallel rather than perpendicular to the magnetic field (Longair (1994)). Its direction is indicated by the solid lines in Figure 8. This implies that the magnetic field is quite ordered within the compact jet and that its averaged orientation is relatively stable over a two years period.
We note a polarisation angle of –45.4 5.9° at 4800 MHz on 1999 March 3, possibly indicative of Faraday rotation. From the minimum apparent rotation of 10° between 4800 and 8640 MHz, we can get a minimum rotation measure of 40 rad m2, which is quite large. Detection of linear polarisation in GX 339–4 confirms that the mechanism at the origin of the radio emission is synchrotron and GX 339–4 is the second radio emitting X-ray binary, after GS 2023+338 (Han & Hjellming (1992)), to show linear polarisation during an optically thick radio emission state.
Recently, Fender et al. (2000a) reported the discovery of circularly polarised radio emission in SS 433. This is the first such detection in a radio emitting X-ray binary. Concerning GX 339–4, no circular polarisation has been detected at any time with the best 3 upper limit of 0.7% at 8640 MHz. This is still above the detection limits in SS 433 (0.6% at 1400 MHz decreasing to 0.3% at 8640 MHz).
6 Imaging the persistent radio jet in GX 339–4 ?
Radio emission from GX 339–4 involves a compact radio jet, therefore it is of prime interest to search for this jet in our data. But detection of such a compact jet is beyond the scope of ATCA observations, which can achieve spatial resolution of only 1 arcsec. ATCA observation can be useful to search for large scale structure, similar to the double-sided jet of 1E 1740.7–2942 (Mirabel et al. (1992)) or GRS 1758–258 (Rodríguez et al. (1992)).
The most sensitive observations, coupled with the best available resolution, have been performed in February 1997. They consist of three full 12 hours observing runs spaced by a week with the 6A array, giving baselines ranging from 0.34 km to 6 km (these observations have been partly presented in Corbel et al. (1997)). As ATCA is able to observe simultaneously at two frequencies, we have selected both of them in the 3 cm band at 8384 MHz and 9024 MHz. We have been using the multi-frequency synthesis technique to improve our spatial resolution (Sault & Wieringa (1994)), i.e. all 32 spectral channels of the 128 MHz bandwidths of each frequency have been retained at their original position and have been simultaneously used during the imaging process. The two frequencies have been chosen in order to complement each other and provide the best u - v coverage in the 3 cm band. In order to reduce any artifacts due to phase errors, we have used a cycle of 8 minutes on GX 339–4 and 2 minutes on the closest phase calibrators B1646–50 ( 4 degrees away from GX 339–4). The size of the synthesised beam is typically 1.3″ 2.3″. A natural weighting map (providing the best signal to noise ratio) is displayed in Figure 8 (this image combines the three ATCA runs).

The radio map of GX 339–4 is compatible with a single point source, without any extended emission around the core, ruling out the presence of a persistent large scale radio jet. A uniform weighting map of GX 339–4, which gives a higher resolution (up to 0.6″ E-W) but higher rms noise, is also compatible with a point source. If a jet exists in GX 339–4, it has to be very compact with angular size of less than 1″, i.e. lower than 0.02 pc or 4000 AU for a distance to the source of 4 kpc. This is consistent with the size of the compact jet recently detected in Cyg X–1. GX 339–4 is not bright enough for standard VLBI observations from the southern hemisphere at present.
We note that these ATCA observations have been performed when GX 339–4 was in a Low-Hard state. A possible large scale jet has been reported by Fender et al. (1997a), also during a Low-Hard state, but our observations failed to confirm it. Their report of a jet-like feature had been preceded by a period of quenched radio emission (see § 7.5). It is also possible that Fender et al. (1997a) observed a transient phenomenon.
We have also generated a radio image of GX 339–4, combining a wide range of array configurations (from the 375 m to the 6 km array). This shows that there is no synchrotron nebula around the point radio source, such as the one detected around Cir X–1 (Stewart et al. (1993)). The best position of the radio counterpart is: (2000) = 17h02m49.4s and (J2000) = –48°47′23.3″ with a total uncertainty of 0.13″.
7 Radio, soft and hard X-rays behaviour
In 1998, when GX 339–4 entered the High-Soft state, we observed the quenching of the compact radio jet (Fender et al. 1999b). The transitions from the Low-Hard state to the High-Soft state, and also the return to the Low-Hard state, have been both accompanied by an unusually optically-thin synchrotron event lasting around three weeks. This could possibly be interpreted as discrete ejection events associated with state transitions, and it could be a general property of state transitions in black hole binaries. Following the results acquired during the 1998 High-Soft state, we now concentrate on all available data in order to show that the radio:X-ray behaviour of GX 339–4 follows a clear pattern. We displayed in a chronological order the radio data together with the hard and soft X-ray data (if available) to highlight the behaviour of GX 339–4 at these wavelengths.


7.1 MJD 48350-48750: 1991-04-04 to 1992-05-08
This period corresponds to the first hard X-ray outburst (bright Low-Hard state) detected by BATSE (Harmon et al. 1994, Rubin et al. (1998)). In addition to the BATSE light curve in Figure 10, we have also displayed the soft X-ray (1-20 keV) light curve from the All Sky Monitor onboard Ginga (Kitamoto (1993)) and the first two measurements and detection of GX 339–4. Unfortunately, no Ginga data are available after MJD 48531. From the spectral index, we can infer that these radio observations correspond to optically thin events. The radio spectrum is becoming flatter () between the two observations (from a spectral index of –0.64 0.28 to –0.17 0.17 ), which is identitical to the end of the 1998 High-Soft state (Fender et al. 1999b ).
This hard X-ray outburst started around MJD 48440, the soft and hard X-rays are correlated until the hard X-rays reached their maximum on MJD 48523. This was followed by a fast decline in hard X-rays when the source became very soft with a steeper power law spectrum (Harmon et al. 1994), indicative of a transition to a High-Soft state. This optically thin radio event was detected (December 1991) about 70 days after the beginning of the High-Soft state. According to our results on the 1998 High-Soft state of GX 339–4 (Fender et al. 1999b ), the radio event at MJD 48590 probably corresponds to a discrete ejection event (or the refuelling of the compact jet) at the end of the High-Soft state, which was therefore very short. There is a corresponding slight increase in the hard X-ray flux (from BATSE) at the same time ( MJD 48590).
The OSSE spectrum in November 1991 (Grabelsky et al. 1995) is consistent with GX 339–4 still being in its High-Soft state. Trudolyubov et al. (1998) reported that GX 339–4 was in the Off state on February-March 1992 (one upper limit of 19 mCrab (35-150 keV) on 1992 March 7), in agreement with the previous picture and indicative of a very short High-Soft state. It should be noted that the return from the 1998 High-Soft state to the standard Low-Hard state has also been followed by a transition to an X-ray Off state (see § 8).
7.2 MJD 49200-49550: 1993-08-01 to 1994-07-17
During this period (Figure 10), a third outburst (these hard X-ray outbursts are still the Low-Hard state, and should not be confused with the High-Soft state) was detected by BATSE (Rubin et al. 1998). The outburst was very similar to the 1991 hard X-ray outburst, unfortunately no soft X-ray data are available for this period. The four MOST data points around MJD 49500 do not fit in the standard radio - hard X rays (see § 9) correlation scheme (as previously noted by Hannikainen et al. 1998). Based on the fast drop of the hard X-ray emission at MJD 49425, we can speculate that it corresponds to a transition to a High-Soft state and that similarly to December 1991, these MOST data points would correponds to an optically thin decaying discrete ejection event at the end of the High-Soft state. As MOST is operated at one frequency only, we cannot confirm the optically thin nature of this radio event. As in 1991, the duration of the High-Soft state would have been around 70 days.
7.3 MJD 49550-49750: 1994-07-17 to 1995-02-02
Observations during a hard X-ray outburst [B4 in Rubin et al. (1998)] revealed that the radio emission follow the general trend of the hard X-ray flux (Figure 12). No flaring activity, in the radio domain, accompanies this outburst. The highest radio flux (12 mJy) is reported around the maximum of the outburst with a flat radio spectrum between 4800 and 8640 MHz.
7.4 MJD 49750-50050: 1995-02-02 to 1995-11-29
GX 339–4 is still in its typical Low-Hard state with weaker outbursts (Figure 12). Radio emission followed the general trend of hard X-ray emission. The radio spectrum is again flat.
7.5 MJD 50150-50350: 1996-03-08 to 1996-09-24
This is an interesting period (Figure 14) when radio emission is not detected several times. And this quenched radio state does not correspond to a High-Soft state as indicated by the very low flux detected by RXTE/ASM. The two MOST non-detections around MJD 50200 are consistent with GX 339–4 being in the Off state and the following MOST data points represent a return to a Low-Hard state in agreement with the optical level of V = 17 mag. on MJD 50215 reported by Smith et al. (1999b).
A hard X-ray outburst occured after MJD 50250 (1996-06-16). It is detected in all three regimes (radio, soft and hard X-rays). The radio and hard X-ray observations are consistent with a simultaneous onset, but with a faster rise in radio. Soft X-rays appeared with a significant delay of about 15 days but with a faster rise than hard X-ray and radio emissions.
15 days is significantly longer than the expected viscous timescale at the outer edge ( 400 GM/c2; see Wilms et al. 1999, Zdziarski et al. 1998) of a spherical X-ray emitting corona, whether it is radiatively efficient or “advection dominated”. Such time delays would be more characteristic of viscous timescales at the outer edge of the accretion disk. It is well known that in the Low-Hard state, increased flux tends to imply softer spectra (see Wilms et al. 1999, and references therein), and therefore we may be seeing such variations as the disk accretion rate changes on the viscous timescales of the outer disk. RXTE, OSSE and BATSE observations during this outburst have been discussed by Smith et al. (1999a) and Smith et al. (1999b).
At the peak of this outburst (1996 July 12) the radio spectrum was very inverted with spectral index up to +0.54 0.05 and it corresponds to the period when Fender et al. (1997a) reported a possible jet-like feature in GX 339–4 on a much larger scale than the compact jet (a phase error could not be totally ruled out during these observations). Prior to this hard-X outburst, radio emission was not detected from GX 339–4 during 20 days, with the strongest measurement giving a 3 upper limit of 0.6 mJy at 8640 MHz. This is reminiscent of quenched radio emission from Cyg X–3 prior to major ejection events (Waltman et al. (1996); Fender et al. 1997b , McCollough et al. 1999).
7.6 MJD 50350-50600: 1996-09-24 to 1997-06-01
This period (Figure 14) illustrates again the overall behaviour of GX 339–4 in the Low-Hard state, with a strong correlation of emission in the radio, soft and hard X-ray domains. The radio spectra are flat, indicative of the optically thick emission from the compact jet. The observations with the highest signal to noise ratio have been performed in February 1997 ( MJD 50490). See Nowak et al. (1999) and Wilms et al. (1999) for XTE observations during this period.
8 A transition to the Off state after the 1998 High-Soft state

This period (MJD 50650-51450: 1997-07-21 to 1999-09-29) is displayed in Figure 15. The first part of this plot has been discussed in detail in Fender et al. (1999b). It corresponds to the 1998 transition from the Low-Hard state to the High-Soft state (Belloni et al. (1999)) and then back to the Low-Hard state. One observation has been added in Figure 15 (GX 339–4 was not detected) at the end of the 1998 soft X-ray outburst on MJD 51215. The important point to note is that radio emission from GX 339–4 rose from a level of 0.7 mJy (1 at 843 MHz) to 6.3 mJy on MJD 51223 (at 4800 MHz), i.e. the reappearance of radio emission in less than seven days. Moreover this state transition was accompanied by an optically thin synchrotron event, probably related to a discrete ejection events, similarly to the beginning of the High-Soft state (Fender et al. 1999b ).
It is interesting to note that the hard X-ray emission reappears 2 weeks before the radio emission. This can be understood if one consider the hot corona as the base of the jet. In the High-Soft state the corona is believed to shrink to a very small size (e.g. Esin et al. 1998). The return to the Low-Hard state can be understood as a “refill” of the corona, which then can later provide relativistic electrons to the compact jet.
The return to the Low-Hard state has been followed by a smooth transition to an Off state with radio and hard X-ray emissions getting weaker as the soft X-rays vanished. GX 339–4 was detected on 1999, March 3 at 6 mJy and on 1999 July 7 at 0.15 mJy. On 1999, July 27 the radio emission was below the detection limit of our observations (3 upper limit of 0.09 mJy at 8640 MHz). It was detected two weeks later at 0.3 mJy, again preceded by an increase in hard X-rays.
During this transition to the Off state, the radio spectrum was always slightly inverted, indicative of optically thick synchtrotron emission. Therefore the compact radio jet is still a characteristic feature of GX 339–4 even in the Off state. The Off state is related to a lower mass accretion rate, which probably reduces the electron density in the accretion disk and in the corona and therefore in the compact jet. From the point of view of the radio emission at least, the Off state can be viewed as a weaker luminosity version of the Low-Hard state. Actually, Kong et al. (2000) also found that the Off state was an extension of the Low-Hard state, based on BeppoSAX observations of GX 339–4 in the Off state. All the radio observations performed in 1999 have been simultaneous with soft X-ray (RXTE and ASCA) and optical observations. This will be discussed in more detail in a forthcoming paper.
9 Radio, soft and hard X-ray correlations


Hannikainen et al. (1998) reported a correlation between the radio emission at 843 MHz (from MOST observations) and soft and hard X-rays on timescales of 5 days. In Fender et al. (1999b), we showed that this correlation doesn’t hold during the High-Soft state, and that radio and hard X-ray emission are both suppressed during the High-Soft state, following the quenching of the compact jet.
We have used our radio data (spanning over 8 years) to explore this correlation at several radio frequencies with both ATCA and MOST. Unlike Hannikainen et al. (1998), we have not performed any averaging of the measurements with the exception of non simultaneous radio and X-ray observations. In Figure 16, we plot the radio flux density (ATCA and MOST) from GX 339–4 as a function of hard X-rays (BATSE flux in the 20-100 keV band). We observe a very good correlation of radio emission with hard X-ray flux. This correlation is better seen with ATCA measurements rather than MOST observations, because of ATCA’s higher sensitivity. The correlation is observed at all radio frequencies (not surprising as the radio spectrum of GX 339–4 is nearly flat). In the figure showing the MOST measurements, two events (labelled 1 and 2) are clearly separated from the other data points. As pointed out before, these events are related to possible discrete plasma ejection events associated with a transition from a High-Soft state to a Low-Hard state.
The linear Pearson correlation coefficient is 0.93 for the radio and hard X-ray measurements. A least-square polynomial fit to the ATCA data gives the following function between the radio flux density Scm and the 20-100 keV hard X-ray emission SHXR (in 10-2 ph cm-2 s-1, in the same band the Crab nebula is at a level of 0.32 ph cm-2 s-1):
| (1) |
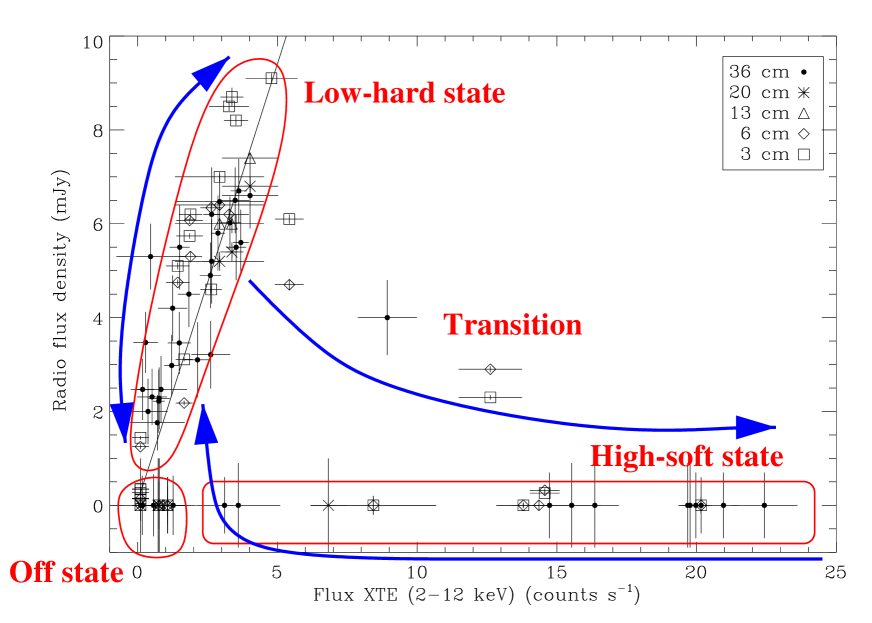
If we now concentrate on the radio flux density as a function of soft X-ray emission (2-12 keV RXTE/ASM count rate), the overall picture seems more complicated at first sight, but this is only because it displays the various behaviours of GX 339–4 in its different X-ray states (Figure 17). The data points are divided in four groups, indicative of the observed three different X-ray states and of the transition between the High and Low states. As noted before, the radio emission is quenched in the High-Soft state (which correspond to high RXTE/ASM count rate and no radio emission). Althought few measurements have been taken during a transition from the Low-Hard state to the High-Soft state, they follow a clear pattern in Figure 17.
By taking only the radio measurements during the Low-Hard state, we note that there is also a strong correlation between the radio flux density and the soft X-ray emission. This correlation extends to very weak levels of emission (Off state), as the 1999 return to the Low-Hard state has been followed by a transition to the Off state with the radio flux density getting weaker simultaneously with the soft X-ray emission (Figure 15).
The linear Pearson correlation coefficient is 0.84 for the radio and soft X-ray emission in the Low-Hard state. A least-square polynomial fit to the ATCA data gives the following function between the radio flux density Scm and the 2-12 keV soft X-ray emission SSXR (in count s-1, in the same band the Crab nebula is at a level of 74 count s-1):
| (2) |
This analysis shows that there is a very strong 3-way correlation between the radio flux density, the soft and hard X-ray emission during the Low-Hard state. In the Low-Hard state, emission from the inner accretion disk does not contribute significantly in the soft X-ray band (e.g. Belloni et al. 1999), which emission is dominated by the Comptonising corona. This correlation indicates that there is a strong coupling between the compact jet (at the origin of radio emission) and the corona (soft and hard X-rays). A similar correlation has also been observed in Cyg X–1 during the Low-Hard state (Brocksopp et al. 1999). As noted in Fender et al. (1999b), it is possible that the corona is at the base of the compact jet; the high energy tail of the electron distribution being responsible for the synchrotron emission observed at radio (and possibly higher) frequencies.
The correlation between the corona and the compact jet may reflect variability resulting from changes in the accretion rate, therefore implying a correlation between the compact jet, the corona and the accretion rate. The thermal emission from the inner part of the accretion disk is generally not observed in the Low-Hard state, but it might also reflect the changes in the accretion rate. Such questions could be addressed by future observations with XMM and Chandra. We should note that these correlations may result from the precession of the accretion disk as suggested by Brocksopp et al. (1999) for Cyg X–1.
The fact that the correlation between the radio and the X-ray flux in the Low-Hard state is consistent with being linear is somewhat difficult to understand in the context of advection dominated models that postulate large outflows (e.g., Blandford & Begelman 1999). In the absence of such large outflows, standard ADAF models fail to produce, by several orders of magnitude, the observed radio flux (Wilms et al. 1999). In a wind-producing ADAF model, a decrease in luminosity is associated in part, at least, with a further decrease in radiative efficiency. This, however, is expected to result in a greater rate of mass outflow. Therefore one expects the radio flux to decrease somewhat more slowly than the X-ray flux, in contrast to the linear dependence observed. If in fact the transition to the Low-Hard state is a transition to an ADAF state, perhaps then the radiative efficiency remains relatively constant with further decreases in flux.
Following the equation of Marscher (1983), hard X-rays resulting from Synchrotron Self-Compton emission from the compact jet of GX 339–4 can be neglected as it is negligible compared to the contribution from the corona. A similar conclusion has been drawn by Brocksopp et al. (1999) for Cyg X–1.
10 Conclusions
The following list summarizes the conclusions we have been able to draw from this multi-wavelength analysis of the behaviour of GX 339–4:
-
•
In the Low-Hard X-ray state, we observe a very strong 3-way correlation between the radio, soft and hard X-rays emission, believed to be the result of a coupling between the Comptonising corona and a compact jet. Models of persistent accreting black holes would need to take into account this coupling in the Low-Hard state and the quenching of the radio jet in the High-Soft state. The Off X-ray state is consistent with being a lower-luminosity Low-Hard state, in all three energy bands.
-
•
The radio spectrum is flat or slightly inverted. A similar behaviour is observed in the black hole Cyg X–1. The radio emission can be understood as synchrotron emission from a compact jet, with quasi-continuous injection of relativistic plasma.
-
•
Transitions from the Low-Hard state to the High-Soft state (or vice versa) are possibly associated with discrete ejection(s) of expanding relativistic plasma.
-
•
The pattern of behaviour observed in radio, soft- and hard-X-rays is sufficient to explain in broad terms all the observations over several years.
-
•
Linear polarisation has been detected from the radio emission of GX 339–4 with a nearly constant polarisation angle, which points to a favored axis in the system. This direction is almost certainly related to the direction of the outflow, and in turn to the inner disc and/or black hole rotation axes.
Acknowledgements.
The Australia Telescope is funded by the Commonwealth of Australia for operation as a National Facility managed by the CSIRO. The MOST is owned and operated by the University of Sydney, with support from the Australian Research Council and the Science Foundation within the School of Physics. RXTE ASM results are kindly provided by the ASM/RXTE teams at MIT and at the RXTE SOF and GOF at NASA’s GSFC. We are grateful to D. Campbell–Wilson and D. Hunstead for their help with the MOST observations. We would like to thanks Dr R. Ramachandran for useful discussion on interstellar scintillation and Prof. S. Kitamoto for provinding the Ginga ASM data. S.C. would like to thank C. Bailyn, C. Chapuis., C. Gouiffès, R. Jain, M. Mouchet, H. Negoro, R. Ogley, B. Sault, H. Sol, M. Tagger and J. Wilms for useful discussions and A. Harmon, M. McCollough and C. Robinson for their help with the BATSE data. RPF was supported during the period of this research by EC Marie Curie Fellowship ERBFMBICT 972436.References
- Belloni et al. (1997) Belloni, T., Méndez, M., King, A.R., van der Klis, M. & van Paradijs, J. 1997, ApJ, 479, L145
- Belloni et al. (1999) Belloni, T., Méndez M., van der Klis M., Lewin W.H.G. & Dieters S. 1999, ApJ, 519, L159
- Belloni et al. (2000) Belloni, T., Klein-Wolt, M., Méndez, M., van der Klis, M. & van Paradijs, J. 2000, A&A, 355, 271
- Blandford & Knigl (1979) Blandford, R.D. & Knigl, A. 1979, ApJ, 232, 34
- Blandford & Begelman (1999) Blandford, R.D. & Begelman M.C. 1999, MNRAS, 303, L1
- Bouchet et al. (1993) Bouchet, L. et al. 1993, ApJ, 407, 739
- Brocksopp et al. (1999) Brocksopp C., Fender R.P., Larionov V., Lyuty V.M., Tarasov A.E., Pooley G.G., Paciesas W.S. & Roche P. 1999, MNRAS, 309, 1063
- Callanan et al. (1992) Callanan P.J., Charles P.A., Honey W.B. & Thorstensen J.R. 1992, MNRAS, 259, 395
- Charles (1998) Charles, P.A. 1998, Black Holes in our Galaxy: observations, In: Theory of Black Hole Accretion Disks, Abramowicz, M.A., Björnsson, G. & Pringle, J.E. (Eds), Cambrige Contemporary Astrophysiscs, CUP, 1999, p.1
- Corbel et al. (1997) Corbel S., Fender R.P., Durouchoux P., Sood R.K., Tzioumis A.K., Spencer R.E. & Campbell-Wilson D. 1997, In: Proceedings of the 4th Compton Symposium, eds. Dermer C.D., Strickman M.S., Kurfess J.D., AIP conf. proc. 410, Woodbury, New York, p. 937
- Corbel (1999) Corbel, S. 1999, PhD Thesis, “Multiples facettes des étoiles compactes: distance, extinction optique et comportement multi-longueur d’onde”, Université Pierre et Marie Curie (Paris VI)
- Corbel & Fender (2000) Corbel, S. & Fender, R.P. 2000, in prep.
- Cowley et al. (1987) Cowley, A.P., Crampton, D. & Hutchings, J.B. 1987, AJ, 92, 195
- Ebisawa et al. (1994) Ebisawa K., Ogawa, M., Aoki, T., Dotani, T., Takizawa, M., Tanaka, Y. & Yoshida, K. 1994, PASJ, 46, 375
- Esin et al. (1998) Esin A.A., Narayan R., Cui W., Grove J.E. & Zhang S.N. 1998, ApJ, 505, 854
- Fabian et al. (1982) Fabian, A.C., Guilbert, P.W., Motch, C., Ricketts, M., Ilovaisky, S.A. & Chevalier, C. 1982, A&A, 111, L9
- Falcke & Biermann (1996) Falcke, H. & Biermann, P.L. 1996, A&A, 308, 321
- Falcke & Biermann (1999) Falcke, H. & Biermann, P.L. 1999, A&A, 342, 49
- (19) Fender R.P., Spencer R.E., Newell S.J. & Tzioumis A.K. 1997a, MNRAS, 286, L29
- (20) Fender R.P., Bell-Burnell, S.J., Waltman, E.B., Pooley, G.G., Ghigo, F.D. & Foster, R.S. 1997b, MNRAS, 288, 849
- (21) Fender R.P., Garrington S.T., McKay D.J., Muxlow T.W.B., Pooley G.G., Spencer R.E., Stirling A.M. & Waltman E.B. 1999a, MNRAS, 304, 865
- (22) Fender R.P. et al. 1999b, ApJ, 519, L165
- (23) Fender, R.P., Rayner, D., Norris, R., Sault, R.J. & Pooley, G. 2000a, ApJ, 530, L29
- (24) Fender R.P, Pooley, G.G., Durouchoux, P., Tilamus, R.P.J. & Brocksopp, C. 2000b, MNRAS, 312, 853
- Fishman et al. (1989) Fishman G.J. et al. 1989, in Proc. of the GRO Science Workshop, ed. W.N. Johnson (Greenbelt: NASA/GSFC), 2-39
- Grabelsky et al. (1995) Grabelsky, D.A., Matz, S.A., Purcell, W.R., Ulmer, M.P., Grove, J.E., Johnson, W.N., Kinzer, R.L., Kurfess, J.D., Strickman, M.S. & Jung, G.V. 1995, ApJ, 441, 800
- Hannikainen et al. (1998) Hannikainen D.C., Hunstead R.W., Campbell-Wilson D. & Sood R.K. 1998, A&A, 337, 460
- Hannikainen et al. (1999) Hannikainen D.C., Hunstead R.W., Wu, K., McKay, D. & Sault, R. 1999, In: Proc. 19th Texas Symposium on Relativistic Astrophysics and Cosmology, in press
- Harmon et al. (1994) Harmon B.A. et al. 1994, ApJ, 425, L17
- Han & Hjellming (1992) Han, X. & Hjellming, R.M. 1992, ApJ, 400, 304
- Hjellming & Johnston (1988) Hjellming R.M. & Johnston K.J. 1988, ApJ, 328, 600
- (32) Hjellming, R.M., Han, X.H., Córdova, F.A., & Hasinger, G. 1990a, A&A, 235, 147
- (33) Hjellming, R.M. et al. 1990b, ApJ, 365, 681
- Hjellming & Rupen (1995) Hjellming, R.M. & Rupen, M.P. 1995, Nature, 375, 464
- Hjellming & Han (1995) Hjellming R.M. & Han X. 1995, In: X-ray binaries, eds. Lewin W.H.G., van Paradijs J. & van den Heuvel E.P.J., Cambridge Astrophysics Series 26, Cambridge University Press, p.308
- Homan et al. (2000) Homan, J., Wijnands, R., van der Klis, M., Belloni, T., van Paradijs, J., Klein-Wolt, M., Fender, R.P. & Méndez, M. 2000, ApJ, submitted, astro-ph/0001163
- Ilovaisky et al. (1986) Ilovaisky, S.A., Chevalier, C. Motch, C. & Chiappetti, C. 1986, A&A, 164, 67
- Kitamoto (1993) Kitamoto, S. 1993, In: Proceedings of the 4th International Conference on Plasma Physics and Controlled Nuclear Fusion, ESA SP-351, p. 297
- Kong et al. (2000) Kong, A.K.H., Kuulkers, E., Charles, P.A. & Homer, L. 2000, MNRAS, 312, L49,
- Kuulkers et al. (1999) Kuulkers, E., Fender R.P., Spencer R.E., Davis R.J. & Morison I. 1999, MNRAS, 306, 919
- Longair (1994) Longair, M.S. 1994, In: High Energy Astrophysics, (Cambridge: Cambridge Univ. Press)
- Levine et al. (1996) Levine A.M., Bradt H., Cui W., Jernighan J.G., Morgan E.H., Remillard R., Shirey R.E. & Smith D. 1996, ApJ, 469, L33
- Maejima et al. (1984) Maejima, Y., Makishima, K., Matsuoka, M., Ogawara, Y., Oda, M., Tawara, Y. & Doi, K. 1984, ApJ, 285, 712
- Makishima et al. (1986) Makishima, K., Maejima, Y., Mitsuda, K., Bradt, H.V., Remillard, R.A., Tuohy, I.R., Hoshi, R. & Nakagawa, M. 1986, ApJ, 308, 635
- Marscher (1983) Marscher, A.P. 1983, ApJ, 264, 296
- Marscher & Gear (1985) Marscher, A.P. & Gear, W.K. 1985, ApJ, 298, 114
- Martí et al. (1996) Martí, J., Rodríguez, L.F., Mirabel, I.F. & Paredes, J.M. 1996, A&A, 306, 449
- McCollough et al. (1999) McCollough M.L. et al. 1999, ApJ, 517, 951
- McIntyre & Cram (2000) McIntyre V. & Cram L. 2000, in preparation
- Méndez & van der Klis (1997) Méndez M. & van der Klis M. 1997, ApJ, 479, 926
- Méndez et al. (1998) Méndez M., Belloni, T. & van der Klis M. 1998, ApJ, 499, L187
- Mirabel et al. (1992) Mirabel, I.F., Rodríguez, L.F., Cordier, B., Paul, J. & Lebrun, F. 1992, Nature, 358, 215
- Mirabel et al. (1998) Mirabel, I.F., Dhawan, V., Chaty, S., Rodríguez, L.F., Martì, J., Robinson, C.R., Swank, J. & Geballe, T.R., 1998, A&A, 330, L9
- Mirabel & Rodríguez (1999) Mirabel, I.F. & Rodríguez, L.F. 1999, ARAA, 37, 409
- Miyamoto et al. (1991) Miyamoto S., Kimura K., Kitamoto S., Dotani T. & Ebisawa K. 1991, ApJ, 383, 784
- Motch et al. (1983) Motch, C., Ricketts, M.J., Page, C.G., Ilovaisky, S.A. & Chevalier, C. 1983, A&A, 119, 171
- Motch et al. (1985) Motch, C., Ilovaisky, S.A., Chevalier, C. & Angebault, P. 1985, Space Sci. Rev., 40, 219
- Nowak et al. (1999) Nowak M., Wilms J. & Dove J.B. 1999, ApJ, 517, 355
- Pooley & Fender (1997) Pooley, G.G. & Fender, R.P. 1997, MNRAS, 292, 925
- Pooley et al. (1999) Pooley G.G., Fender R.P. & Brocksopp C. 1999, MNRAS, 302, L1
- Revnivtsev et al. (2000) Revnivtsev, M.G., Trudolyubov, S.P. & Borozdin, K.N. 2000, MNRAS, 312, 151
- Robertson (1991) Robertson, 1991, Aust. J. Phys., 44, 729
- Rodríguez et al. (1992) Rodríguez, L.F., Mirabel, I.F. & Martí, J., 1992, ApJ, 401, L15, ApJ, 401, L15
- Rodríguez et al. (1995) Rodríguez, L.F., Gérard, E., Mirabel, I.F., Gómez, Y. & Velásquez, A. 1995, ApJS, 101, 173
- Romani et al. (1986) Romani, R.W., Narayan, R. & Blandford, R. 1986, MNRAS, 220, 19
- Rubin et al. (1998) Rubin B.C., Harmon B.A., Paciesas W.S., Robinson C.R., Zhang S.N. & Fishman G.J. 1998, ApJ, 492, L67
- Samimi et al. (1979) Samimi, J., Share, G.H., Wood, K., Yentis, D., Meekins, J., Evans, W;DE., Shulman, S., Byram, E.T., Chubb, T.A. & Friedman, H. 1979, Nature, 278, 434
- Sault & Wieringa (1994) Sault, R.J. & Wieringa, M.H. 1994, A&AS, 108, 585
- Sault et al. (1995) Sault R.J., Teuben P.J. & Wright M.C.H. 1995, In: Astronomical Data Analysis Software and Systems IV, Shaw R., Payne H.E. & Hayes J.J.E. (eds), ASP conf. ser. 77, 433
- Sault & Killeen (1998) Sault R.J. & Killeen N.E.B. 1998, The Miriad User’s Guide Sydney: Australia Telescope National Facility
- (71) Smith, I.A., Liang, E.P., Lin, D., Moss, M., Crider, A., Fender, R.P., Durouchoux, P., Corbel, S. & Sood, R., 1999a, ApJ, 519, 762
- (72) Smith, I.A., Filippenko, A.V. & Leonard, D.C. 1999b, ApJ, 519, 779
- Smith & Liang (1999) Smith, I.A. & Liang, E.P. 1999, ApJ, 519, 771
- Sobczak et al. (1999) Sobczak, G.J., McClintock, J.E., Remillard, R.A., Levine, A.M., Morgan, E.H., Bailyn, C.D. & Orosz, J.A., 1999, ApJ, 517, L121
- Sood & Campbell-Wilson (1994) Sood, R.K. & Campbell-Wilson, D. 1994, IAU Circ. 6006
- Soria et al. (1999) Soria R., Wu K. & Johnston H.M. 1999, In: Proc. 19th Texas Symposium on Relativistic Astrophysics and Cosmology, CD-ROM, in press
- Stewart et al. (1993) Stewart, R.T., Caswell, J.L., Haynes, R.F. & Nelson, G.J. 1993, MNRAS, 261, 593
- Stirling et al. (1998) Stirling A., Spencer R. & Garrett M. 1998, New Astronomy Reviews, 42, 657
- Stirling et al. (2000) Stirling, A. et al. 2000, in prep
- Tanaka & Lewin (1995) Tanaka Y., Lewin W.H.G. 1995, In:X-ray binaries, eds. Lewin W.H.G., van Paradijs J. & van den Heuvel E.P.J., Cambridge Astrophysics Series 26, Cambridge University Press, p.126
- Trudolyubov et al. (1998) Trudolyubov, S. et al. 1998, A&A, 334, 895
- van der Laan (1966) van der Laan, H. 1966, Nature, 211, 1131
- Waltman et al. (1996) Waltman, E.B., Foster, R.S., Pooley, G., Fender, R.P. & Ghigo, F.D. 1996, AJ, 112, 2690
- Wilms et al. (1999) Wilms J., Nowak M.A., Dove J.B., Fender R.P. & Di Matteo T. 1999, ApJ, 522, 460
- Zdziarski et al. (1998) Zdziarski A.A., Poutanen J., Mikołajewska J., Gierliǹski M., Ebisawa K. & Johnson W.N. 1998, MNRAS, 301, 435
- Zhang et al. (1997) Zhang S.N., Mirabel I.F., Harmon B.A., Kroeger R.A., Rodríguez L.F., Hjellming R.M. & Rupen M.P. 1997, In: Proc 4th Compton Symposium, AIP conf. proc. no. 410, p. 141