22institutetext: Dept of Physics, Soweto Campus, Vista University, Bertsham 2013, Johannesburg, South Africa
Limits on magnetic field strength of the extended nebula of PSR B1706-44 from optical, X-ray and TeV observations
Abstract
The detection of unpulsed TeV emission from PSR B1706-44 raised the question if this VHE emission results from inverse Compton scattering of multi-TeV electrons on the CMBR and other soft photon fields. This hints at the existence of an unseen synchrotron nebula, which is larger than the observed compact X-ray nebula. In a search for the synchrotron counterpart of the TeV nebula, we have taken V-band CCD images of the region around the PSR B1706-44 pulsar position. By rejecting all point source contributions down to the diffuse sky limit, we were able to search for such extended plerionic synchrotron emission on scale sizes limited by the angular resolution of the CANGAROO imaging TeV observations. By combining the V-band flux limits with the observed TeV flux, we were able to obtain upper limits for the magnetic field strength as a function of the radius of the assumed TeV nebula. Assuming that the radio plerion also defines the size of the TeV plerion, we constrain the steady state particle spectral index to values between 4 and 5.5, with a field strength limit of about 3 G. This compares with an index of inside the 1’ compact X-ray nebula.
Key Words.:
Magnetic fields – Methods: data analysis – pulsars: individual: PSR B1706-44 – Radiation mechanisms: non-thermal – X-rays – gamma-rays1 Introduction
PSR B1706-44 is a young Vela-like pulsar (spin-down age 17.5 kyr), with a period of 102 ms and a large spin-down power (Ė = 3.4 x 1036 ergs/s). It was discovered during a 20 cm radio pulsar survey of the southern Galactic plane (Johnston et al. 1992), and later detected in soft X-rays during the ROSAT mission (Becker et al. 1992, 1995) and identified as a pulsed GeV source by EGRET (Thompson et al. 1992). Very high energy (VHE) -ray observations above 1 TeV from CANGAROO (Kifune et al. 1995; Kifune 1997) and above 0.3 TeV from Durham (Chadwick et al. 1997) detected and confirmed the existence of unpulsed radiation of statistical significance from this source. The CANGAROO detection is consistent with a point source, with angular extend not exceeding – the pixel size of the imaging camera. A dispersion based distance measure of Taylor & Cordes (1993) places PSR B1706-44 at 1.8 kpc. A possible SNR G 343.1-2.3 association with the pulsar was proposed by McAdam et al. (1993), but this was later found to be unlikely by Frail et al. (1994) and Nicastro et al. (1996).
Chakrabarty & Kaspi (1998) gave a red-band upper limit of to the pulsar. A 3 upper limit to the pulsar magnitude of was given by Lundqvist et al. (1999), and this is consistent with the theoretical prediction of (Urama & Okeke 1998, and references therein). Mignani et al. (1999), using the same data as Lundqvist et al., obtained an upper limit of .
The photon flux above 1 TeV from this unpulsed source is only two times smaller compared to the flux of the Crab Nebula at the same energy. This is remarkable in the context of a synchrotron-inverse Compton (on external photon fields) interpretation for the TeV -rays from PSR B1706-44, since the synchrotron nebula of this source is very weak compared to the Crab Nebula’s synchrotron intensity. Whereas the Crab Nebula’s intense synchrotron emission is the result of a large ( G) field, we must have a much weaker field for this plerion to avoid a bright synchrotron nebula.
De Jager (1995) speculated that a Vela-like compact synchrotron nebula (, Harnden et al. 1985) may be present, which would account for most of the unpulsed X-ray emission from this source, since the pulsar wind magnetic field (which scales as ) would predict a compact synchrotron nebula, if the conditions are similar to Vela. The corresponding particle density required for the synchrotron nebula would however be too low to produce a detectable inverse Compton compact nebula, since the target photon density from the CMBR and Galactic disk would be too small.
A compact nebula was indeed discovered (Finley et al. 1998), which confirms the abovementioned interpretation. The scenario of Harding & de Jager (1997), with a detailed analysis by Aharonian et al. (1997) may apply in this case: electrons are streaming away from the compact X-ray nebula into a low-B extended plerion. If the diffusion coefficient for electrons in the extended plerion is small enough, it may be possible to trap enough electrons to account for the TeV emission by IC scattering.
Frail et al. (1994) detected a radio synchrotron nebula associated with the pulsar, which has a radius of at 20 cm wavelength. This may represent the low energy counterpart of the TeV nebula, since the associated in the radio nebula is smaller than the pulsar driven field in the compact X-ray nebula, and the size is just smaller than the angular resolution of the CANGAROO telescope.
If the TeV -rays originate from the extended (radio?) nebula, we will expect a bright extended nebula in optical and/or X-rays, if the field strength is large enough. No extended X-ray nebula was however seen, resulting in an upper limit of four times the flux of the point source/compact X-ray nebula at 1 keV, for (K. Brazier 1998, personal communication). This is consistent with the expectation that the pulsar field strength (which drops as outside the light cylinder) should start to drop below the ambient field strength of a few G at a distance of a few arcminutes (de Jager & Harding 1998). The consequence of this is that both the synchrotron brightness and synchrotron characteristic frequencies should drop with increasing . Scaling from the Durham detection above 0.3 TeV, and the expected G in the extended nebula (de Jager & Harding 1998), we may use equation (5) of Aharonian et al. (1997) to calculate the synchrotron frequency which corresponds to the Durham detected -rays near 0.3 TeV, assuming that the CMBR is mostly responsible for the inverse Compton scattering. This gives a frequency of
which is within a factor of 3 from the V-band. The non-detection of the unpulsed component at 20 GeV (Thompson et al. 1996) hints at a marginal turnover in the -ray spectrum (de Jager & Harding 1998), which corresponds to a turnover frequency as low as Hz, which is well below the V-band.
At a distance of 1.8 kpc to the source, we expect significant interstellar absorption in the blue and UV bands. We therefore take wide field V-band images as a compromise between interstellar absorption and avoiding a spectral turnover at too low frequencies. By taking overlapping images, we cover a total field-of-view of about , which should include the expected TeV source. Even if the full extend of the TeV source is , we still expect a typically centrally brightened image, resulting in a radial gradient from the source. Failure to detect the optical counterpart will allow us to set upper limits on the magnetic field strength in the extended nebula, since any stronger field should have resulted in a brighter optical nebula.
2 Observations and data analyses
V band CCD observations of PSR B1706-44 were carried out on May 24, 1999 at the South African Astronomical Observatory (SAAO) 1.0 m telescope in Sutherland. Five frames, each (pixel size = 0.31 arcsec), were taken. The first one was centered on the radio pulsar position (Johnston et al. 1992, 1995), whereas the other four frames were offset in such a way that they have an overlap of 10% with each other around the pulsar position. The overall region observed around the pulsar is . The observation time for each frame was 12 minutes. Table 1 gives the position (RA, Dec), the starting time (MJD), values and the duration time (seconds) log for the five frames.
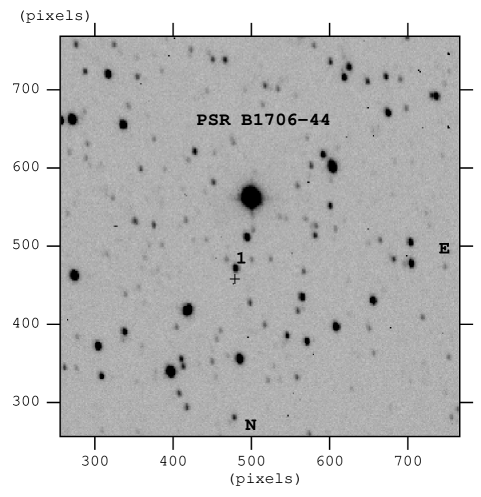
Observations were affected by the moonlight (about 60% bright). The average counts for each frame were decreasing with time, probably due to the moon’s effect across the sky. The data were cleaned and flat-fielded using the IRAF image-processing software. Fig. 1 shows a V band CCD image of the central frame with the pulsar and the standard star positions labeled + and 1 (Mignani et al. 1999, their Figs. 1 & 2), respectively. Only the inner part (25% of the total area) of Frame 1 is shown on Fig. 1.
| Frame | RA (J2000) Dec | MJD (start) | K | time(sec) |
|---|---|---|---|---|
| 1 | 17 09 42 -44 28 57 | 51322.80399 | 29.7 | 720 |
| 2 | 17 09 52 -44 31 20 | 51322.81410 | 28.7 | 720 |
| 3 | 17 09 33 -44 26 34 | 51322.82833 | 29.2 | 720 |
| 4 | 17 09 52 -44 26 34 | 51322.83872 | 28.3 | 720 |
| 5 | 17 09 33 -44 31 20 | 51322.85028 | 28.6 | 720 |
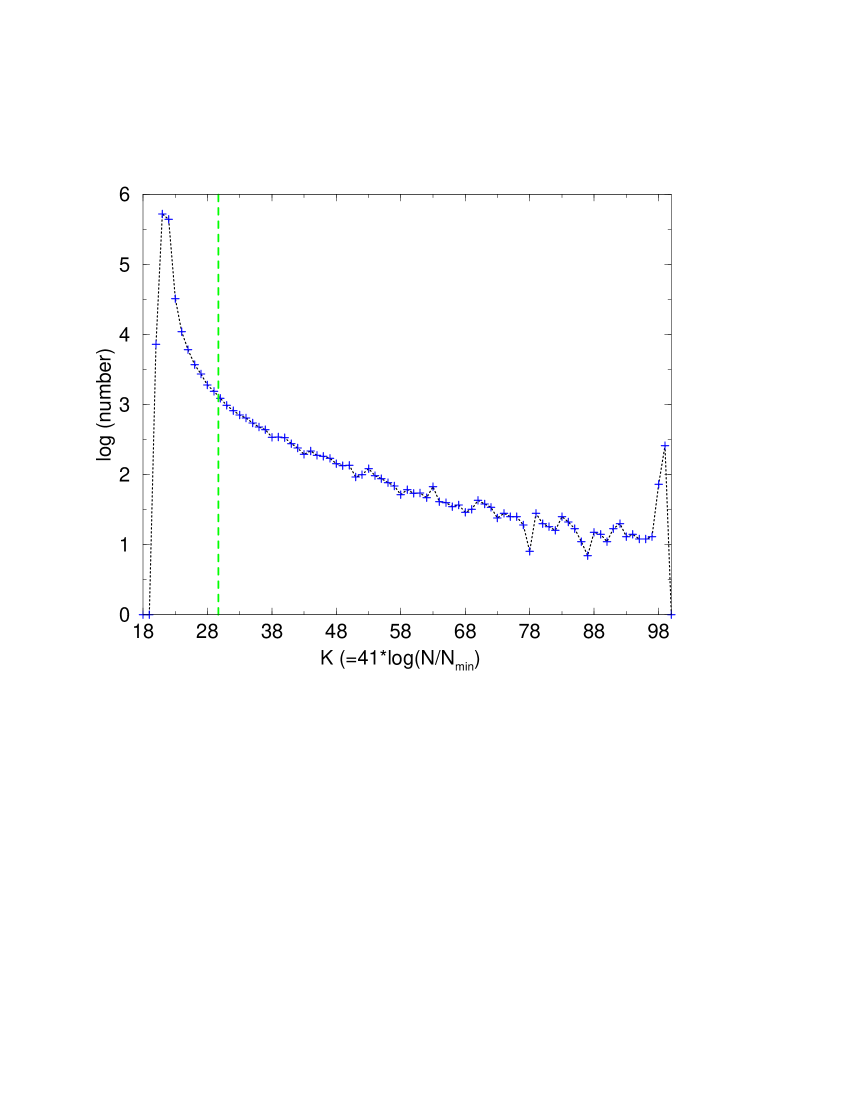
For each frame, we made a histogram of the number of pixels versus intensity per pixel using a logarithmic binning procedure prescribed by
where () is a normalizing constant, as shown in Fig. 2 for the central frame. This binning procedure ensures that all intensities are confined to the interval and 100.
Whereas the diffuse emission is expected to be confined to a rather narrow low- peak in the histogram, the pixels contaminated by point sources should show a broad tail. Fig. 2 indeed shows such behaviour. It can be shown that the weak plerionic emission is expected to contribute to the low -values (), so that we can reject the star–like objects by cutting at (for frame 1) as shown in Fig. 2. This rejects only 10% of the pixels, so that we preserve 90% of the plerionic component. The threshold value of K for each frame is given in Table 1, and probably depends on the phase of the moon and the background bright stars (in each frame), which contribute to the background for each frame. Note that the final results are not sensitive to the threshold .
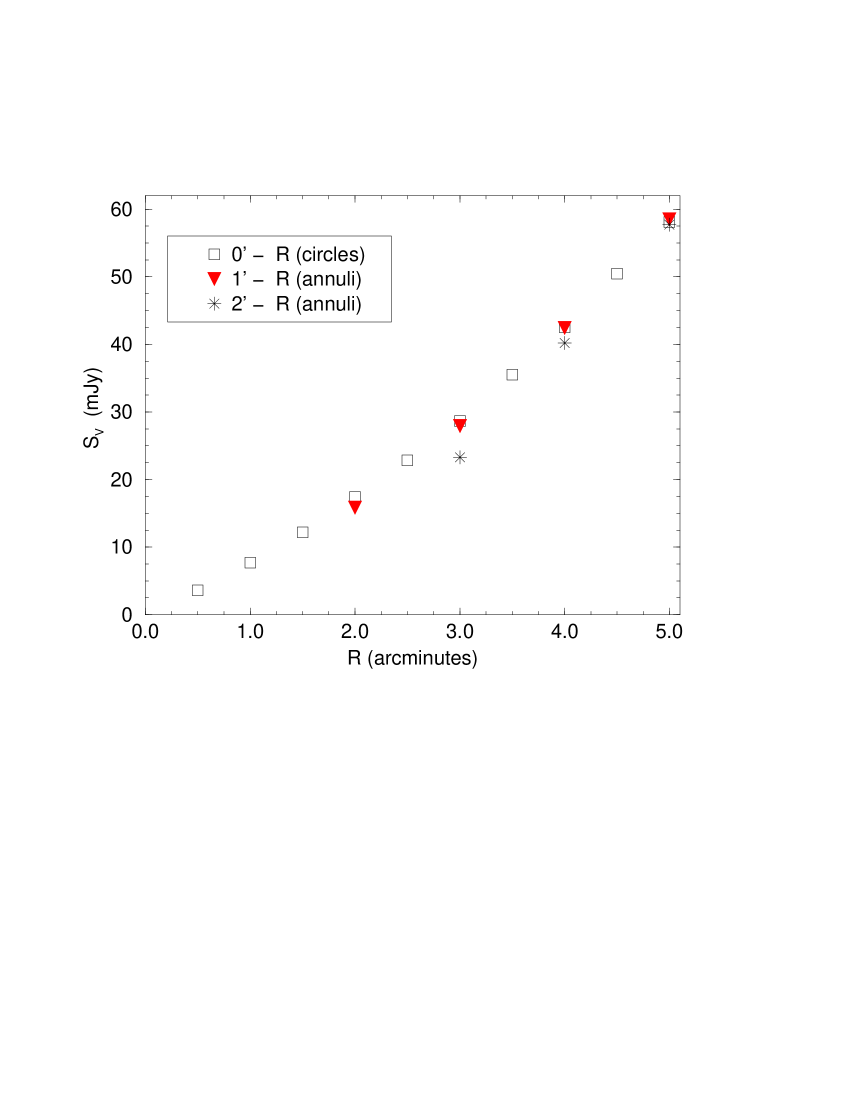
By renormalising the count rate of each frame to the count rate of the central frame, we were able to construct a composite image of a region around the pulsar. Since the plerionic structure is expected to be circular around the pulsar (the radio nebula is at least circular), we constructed annuli around the pulsar and made a plot of the mean count rate per pixel versus radius of the annuli. These count rates are constant with radius within statistics for to , which means that there is no evidence for a centrally brightened source, and hence no evidence for a plerionic structure centered on the pulsar.
3 Upper limits
The 3 upper limits for plerionic emission confined in circles, as well as annuli, are shown in Fig. 3. These upper limits were converted to absolute intensities, , using the observed counts from Star 1 (see Fig. 1) of Chakrabarty & Kaspi (1998) with mag.
The 3 upper limits increase with as expected, and at (compact X-ray nebula), our 3 upper limit is , while for an extended nebula of about 4 arcminutes, the upper limit is .
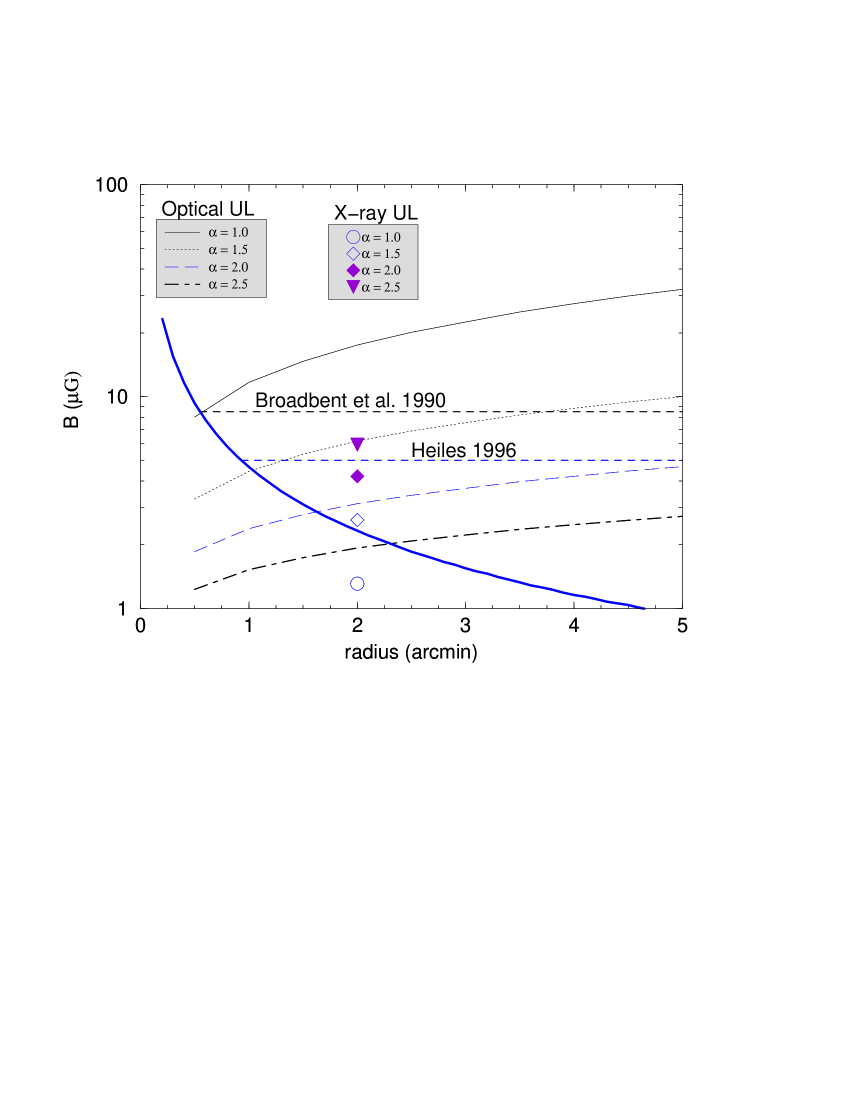
Assuming that the synchrotron spectral index, , of the nebula is the same in both the optical and X-ray regions, the monochromatic X-ray flux, , at 1 keV is given by where (= 1 keV) and (= 2.3 eV) are the X-ray and optical energies, respectively. The observed optical flux can be expressed as , where is the optical depth due to interstellar absorption, with for kpc. Using the above relations and the de Jager et al. (1995) expression for the TeV -ray IC energy spectrum (their Equation 2), we calculate the upper limits to the magnetic fields for different values of between 1.0 and 2.5, inclusively. Fig. 4 shows the curves for = 1.0, 1.5, 2.0 and 2.5, as well as the magnetic field limits from the X-ray upper limits for for similar values of . The magnetohydrodynamic curve of Kennel & Coroniti (1984) model, with (equipartition between particles and fields), is superimposed on Fig. 4, and it is considered as the lower limit to the extended nebula at large radii (). Also shown in Fig. 4 are the Galactic field strengths at the source according to Heiles (1996) and Broadbent et al. (1990).
4 Discussions
Our search for an extended nebula synchrotron counterpart to the TeV nebula did not reveal any nebular structure around PSR B1706-44. The TeV observations do hint at the existence of such a plerionic structure, but our results constrain the nebular magnetic field strength if we assume that the TeV -rays originate from the IC scattering of energetic pulsar wind electrons on the CMBR. At , we find that the optical and X-ray limits are complementary: the spectral index is constrained to to 2.3, whereas G. This limit is barely above the pulsar wind solution, but below the average Galactic field values shown in Figure 4. Furthermore, our constraints on are marginally consistent with measured for the compact X-ray nebula (Finley et al. 1998).
Our optical observations and the information gathered from other wave bands (mainly from X-ray and -ray energies) show that better quality observations (dark moon) should improve these limits, or, result in a detection. Polarimetry of the “extended nebula” of PSR B1706-44 may also help to clarify the status of synchrotron emission.
References
- (1) Aharonian, F. A., Atoyan, A. M., Kifune T., 1997, MNRAS, 291, 162
- (2) Becker, W., Brazier, K. T. S., Trümper, 1995, A&A, 298, 528
- (3) Becker, W., Predehl, P., Trümper, J., Ögelman, H. B., 1992, IAU Circ, 5554
- (4) Broadbent, A., Haslam, C. G. T., Osborne, J. L., 1990, Proc. 21st ICRC (Adelaide), 3, 229
- (5) Chadwick et al., 1997, Proc. 25th ICRC (Durban), 3, 189
- (6) Chakrabarty, D., Kaspi, V. M., 1998, ApJ, 498, L37
- (7) de Jager, O. C., 1995, Towards a Major Atmospheric Cherenkov Detector IV, ed. M. Cresti, Padova, p42
- (8) de Jager, O. C., Harding, A. K., Baring, M. G., Mastichiadis, A., 1995, Proc. XXIV ICRC (Rome), 2, 528
- (9) de Jager, O. C., Harding, A. K., 1998, Neutron Stars and Pulsars : Thirty Years after the Discovery: Proc. Int. Conf. on Neutron Stars & Pulsars, ed. N. Shibazaki, N. Kawai, S. Shibata & T. Kifune, Universal Academy Press, p483
- (10) Frail, D. A., Goss, M., Whiteoak, J. B. Z., 1994, ApJ, 437, 781
- (11) Finley, J. P., Srinivasan, R., Saito, Y., Hiriyama, M., Kamae, T., Yoshida, K., 1998, ApJ, 493, 884
- (12) Harding, A. K., de Jager, O. C., 1997, Towards a Major Atmospheric Cherenkov Detector –V, ed. O. C. de Jager, Wesprint, Potchefstroom, p64
- (13) Harnden, F. R., Jr., Grant, P. D., Seward, F. D., Kahn, S. M., 1985, ApJ, 299, 828
- (14) Heiles, C., 1996, ASP Conf. Proc. 97, Polarimetry of the Interstellar Medium, ed. W. G. Roberge & D. C. B. Whittet, p457
- (15) Johnston, S., Lyne, A. G., Manchester, R. N., Kniffen, D. A., D’Amico, N., Lim, J., Ashworth M., 1992, MNRAS, 255, 401
- (16) Johnston, S., Manchester, R. N., Lyne, A. G., Kaspi, V. M., D’Amico, N., 1995, A&A, 293, 795
- (17) Kifune, T., 1997, Towards a Major Atmospheric Cherenkov Detector –V, ed. O. C., de Jager, Wesprint, Potchefstroom, p55
- (18) Kifune, et al., 1995, ApJ, 438, L91
- (19) Kennel, C. F., Coroniti, F. V., 1984, ApJ, 283, 710
- (20) Lundqvist, P., Sollerman, J., Ray, A., Leibundgut, B., Sutaria, F., 1999, A&A, 343, L15
- (21) McAdam, W. B., Osborne, J. L., Parkinson, M. L., 1993, Nature, 361, 516
- (22) Mignani, R. P., Caraveo, P. A., Bignami, G. F., 1999. A&A, 343, L5
- (23) Nicastro, L., Johnston, S., Koribalski, 1996, A&A, 306, L49
- (24) Taylor, J. H., Cordes, J. M., 1993, ApJ, 441, 674
- (25) Thompson, D. J., et al., 1992, Nature, 359, 615
- (26) Thompson, D. J., et al., 1996, ApJ, 465, 385
- (27) Urama, J. O., Okeke, P. N., 1998, Proc. SALT/HET Workshop, Science with SALT, ed. D. A. H. Buckley, p95