What’s wrong with AGN models for the X-ray background ?
Abstract
The origin of the hard X–ray background (XRB) as a superposition of unabsorbed and absorbed Active Galactic Nuclei is now widely accepted as the standard model. The identification of faint X–ray sources in ROSAT, ASCA, and BeppoSAX medium–deep surveys and their average spectral properties are in broad agreement with the model predictions. However, AGN models, at least in their simplified version, seem to be at odds with some of the most recent findings calling for substantial revisions. I will review the recent XRB “best fit” models and discuss how the foreseen XMM and Chandra surveys will be able to constrain the allowed parameter space.
KEYWORDS: Cosmology, Diffuse emission, X-rays, Active Galactic Nuclei
1. Introduction
It has been recognized, already a few years ago, that a self–consistent AGN model for the XRB requires the combined fit of several observational constraints in addition to the XRB spectral intensity such as the number counts, the redshift and absorption distribution in different energy ranges, the average spectra and so on (Setti & Woltjer 1989). First attempts towards a “best fit” solution relied on simplified assumptions for the AGN spectral properties and for the evolution of their luminosity function (Madau, Ghisellini & Fabian 1994 (MGF94), Comastri et al. 1995 (CSZH95), Celotti et al. 1995 (CFGM95)). A three step approach has been followed to build the so–called baseline model: the first step is to assume a single average spectrum for the type 1 objects which is usually parameterized as a power law plus a reflection component from a face–on disk and a high–energy cut–off at a few hundreds of keV. A distribution of absorbing column densities for type 2 objects is then added in the second step. Finally the template spectra are folded with an evolving XLF which, in the framework of unified models, does not depend on the amount of intrinsic obscuration. The number density and absorption distribution of obscured sources are then varied until a good fit is obtained. The baseline model led to a successful description of most of the observational data available before 1995 and to testable predictions for the average properties of the sources responsible for the bulk of the XRB. The increasing amount of data from soft and hard X–ray surveys combined with the study of nearby bright sources has been used to obtain a more detailed description of the AGN X–ray spectra and absorption distribution. In addition, the optical identification of sizeable samples of faint AGNs discovered in the ROSAT, ASCA and BeppoSAX surveys has shed new light on the evolution of the AGN luminosity function opening the possibility to test in more detail the AGN synthesis model predictions. As a consequence, the modelling of the XRB has attracted renewed attention and several variations/improvements with respect to the baseline model have been proposed. However, despite the increasing efforts, a coherent self–consistent picture of “the” XRB model has yet to be reached, as most of its ingredients have to be extrapolated well beyond the present limits. Besides the interest in a best–fit model it is by now clear that the problem of the origin of the XRB is closely related to the evolution of accretion and obscuration in AGN. As a consequence, the XRB spectrum should be considered as a useful tool towards a better understanding of the history of black hole formation and evolution in the Universe (Fabian & Iwasawa 1999) and the interplay between AGN activity and star–formation (Franceschini et al. 1999; Fabian this volume).
2. Recent Observational constraints
2.1. The XRB spectrum
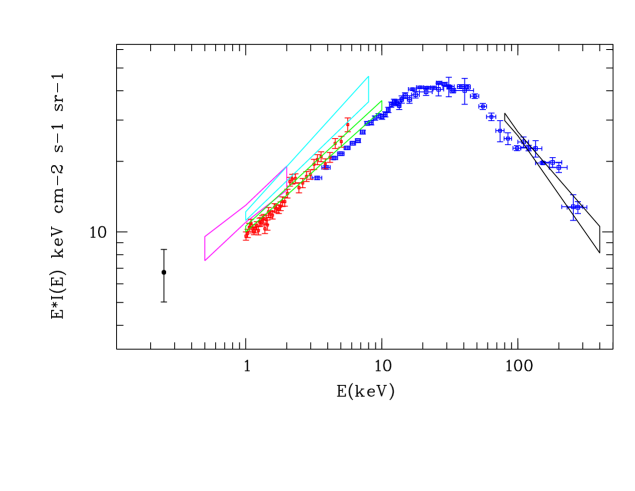
The low energy (below 10 keV) XRB spectrum has been measured with the imaging detectors onboard ROSAT, ASCA, and BeppoSAX and a summary of the results is given in Figure 1 together with a compilation of recent re–analysis of the HEAO1 A2 and A4 experiments data. The comparison between the different datasets in the overlapping 1–8 keV energy range points to a systematic difference in the normalization of the XRB flux while the average spectrum is similar among all the observations. The largest deviation is of the order of 40 % between the HEAO1 A2 and BeppoSAX data (see Vecchi et al. 1999 for a more detailed discussion). Such a discrepancy could be due to residual, not fully understood, cross–calibration errors among the different detectors and/or to field–to–field fluctuations. These findings cast shadows on the intensity and the location of the XRB peak as measured by HEAO1 A2 ( 43 keV cm-2 s-1 sr-1 at 30 keV; Gruber et al. 1999). Indeed a simple extrapolation of the BeppoSAX and HEAO1 A4 MED best fit spectra imply that the XRB spectrum peaks at 23 keV with a much higher intensity introducing an extra–degree of freedom in AGN models parameter space. A new measurement of the 10–100 keV spectrum would be extremely important. Unfortunately such observations are not foreseen in the near future.
2.2. The AGN spectrum
As far as the model of the XRB is concerned, the most important parameters to deal with are a good estimate of the average continuum slope and of the absorption column density. The broad–band energy range exploited by BeppoSAX turned out to be extremely useful to probe column densities as high as 1024-25 cm-2, to assess the strength of the reflection component which peaks around 20–30 keV, and the shape of the low–energy soft–excess emission below 1 keV. In addition ASCA observations of sizeable samples of relatively faint AGNs have allowed to probe the spectral properties of high–luminosity high–redshift objects. The most important new results emerging from these observations can be summarized as follows:
The fraction of heavily obscured (24 log 25) and Compton thick (log 25) sources in the local Universe is much higher than previously thought (Risaliti, Maiolino & Salvati 1999) and a fraction as high as 50% of the Seyfert 2 in the local Universe could be obscured by these large column densities.
Soft excess emission is uncommon among bright Seyfert 1 galaxies (Matt this volume) and nearby quasars (George et al. 2000) and estimated to be present in less than 30 % of AGN.
First observations of high redshift quasars suggest a flattening of the power law slope which cannot be ascribed to the reflection component (Vignali et al. 1999).
Despite intensive searches for high luminosity highly absorbed objects (the so–called type 2 quasars) these sources appear to be elusive and only a few bona–fide examples have been reported in the literature (i.e. Barcons et al. 1998; Georgantopoulos et al. 1999).
2.3. The evolution of the AGN X-ray luminosity function
The evolution of the AGN XLF has been extensively studied mainly in the soft X–rays and usually parametrized with a pure luminosity evolution (PLE) model (i.e. Boyle et al 1994). A major step forward in the determination of the soft XLF has been recently achieved by Miyaji et al. (2000). Combining the results of several ROSAT surveys it has been possible to explore the low-luminosity high-redshift tail of the XLF in much greater detail than before. The results favour a luminosity dependent density evolution (LDDE) as the best description of the available data. In agreement with previous studies, X-ray selected AGN undergo strong evolution up to a redshift = 1.5–2.0 and a levelling–off or a weak negative evolution up to 4–5. Two parametric descriptions (LDDE1 and LDDE2) encompassing the statistically acceptable fits to the soft XLF have been worked out by Miyaji and collaborators. The integration of the LDDE1 and LDDE2 XLF up to 5 accounts for about 60 % and 90 % of the soft XRB respectively.
3. The AGN models parameter space
3.1. Warnings
Before discussing and comparing the various models, it is important to stress the strong coupling between the input spectral parameters and those describing the XLF evolution, which instead are often uncorrectly considered to be independent in the models. Indeed the X–ray luminosities are usually computed converting count rates into fluxes assuming a single valued (relatively steep) slope. This procedure might easily lead to a wrong estimate of the intrinsic luminosity for a very hard absorbed spectrum or if the soft X–ray flux is due to a component not directly related to the obscured nucleus (as in the case of a thermal spectrum from a starburst or scattered emission). According with the XRB baseline model, absorbed AGN become progressively more important towards faint fluxes and thus an additional spurious density evolution term can be introduced in the derivation of the XLF. It turns out that not only the evolution and the space density of obscured AGN are highly uncertain, but also the common practice to consider the soft XLF as representative of the properties of type 1 objects is likely to contain major uncertainties especially when extrapolated to higher energies. Unfortunately our present knowledge of the AGN spectral and evolutive properties does not allow to disentangle the spectral and evolutionary parameters, leaving this ambiguity in all the XRB synthesis models.
3.2. An incomplete tour of the parameter space
The baseline model (cfr 1) has been recently extended, taking into account some of the new observational findings described in 2, by several authors: Gilli, Risaliti & Salvati 1999 (GRS99); Miyaji, Hasinger & Schmidt 1999 (MHS99); Wilman & Fabian 1999 (WF99); Pompilio, La Franca & Matt 2000 (PLM00). A good agreement among the various models has been reached on the high energy cut–off in the input spectrum (300–500 keV), which is basically fixed by the XRB shape above 40 keV (Comastri 1999), and on the and values. GRS99 and MHS99 adopted the LDDE model for the evolution of the XLF and also introduced a cut–off in the luminosity distribution of absorbed AGN for 1044 erg s-1 to cope with the lack of type 2 QSO. The absorption distribution has been fixed according to the recent BeppoSAX results only in the GRS99 model. PLM00 and WF99 both stressed that a proper treatement of the high energy spectrum of heavily obscured (24 log 25) objects has important consequences for the modelling. In particular the evolution of the obscured to unobscured ratio as a function of redshift (PLM00) or the need of super–solar abundances to better fit the XRB peak at 30 keV (WF99; but see 2.1) have been invoked.
Table. 1 - Comparison of model parameters
| Model | XLFa | Evolution | QSO2b | SEe | CTf | ||
|---|---|---|---|---|---|---|---|
| MGF 94 | 2-10 | PLE | Yes | Fitted | 0.9 | No | Yes |
| CSZH 95 | 0.3-3.5 | PLE | Yes | Fitted | 0.9 | Yes | Yes(*) |
| CFGM 95 | 2-10 | PLE | Yes | Fitted | 0.9 | No | Yes |
| MHS 99 | 0.5-2.0 | LDDE1 | No | Fitted | 0.7 | Yes | No |
| GRS 99 | 0.5-2.0 | LDDE1 | No | Fixed | 0.9 | Yes | Yes(*) |
| WF 99 | 2-10 | PLE | Yes | Fitted | 0.9 | No | Yes |
| PLM 00 | 0.3-3.5 | PLE | Yes | Fitted | 0.9 | Yes/No | Yes |
a Energy range of the adopted XLF; b Presence of type 2 quasars; c Absorption distribution; d Spectral energy slope; e Presence of soft excess emission in the model spectrum; f Presence of Compton thick sources (The * indicates that a simplified treatment has been employed)
A comparison between the various models (all of them providing a fairly good description of the present data) is made difficult by the large dispersion in the starting assumptions among the different authors (see Table 1) and also by the relatively large uncertainty in the XRB spectrum normalization (see 2.1).
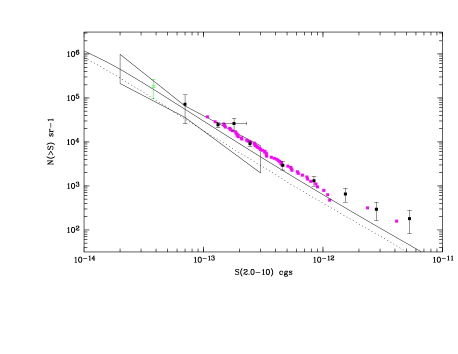
The most up-to-date treatment of the XLF evolution has been adopted only by GRS99 and MHS99 who also made an attempt to correct for the biases described in 3.1. In both cases the model predictions fall short the hard X–ray (2–10 keV and especially 5–10 keV) counts at relatively bright 10-13–10-12 cgs fluxes. This effect, which is less severe for MHS99 given the very hard input spectrum ( = 0.7 plus reflection), can be explained by the relatively low average luminosity of absorbed sources which show up only at fainter fluxes. The hard X–ray counts are better accounted for in PLE models (Fig. 2), which however are based on a less appropriate description of the XLF and include high luminosity highly absorbed sources. It is worth noting that source counts at fluxes 10-13 cgs, both in the soft and hard bands, should not be entirely accounted for by AGN models as a non negligble fraction of these relatively bright sources are not AGN. The 2–10 keV and 5–10 keV counts are best fitted by those models without soft excess emission in type 1 objects. However in this case the predicted average spectrum of faint sources in the ROSAT band ( 0.5–0.6) is much harder than the observed value ( 1.0, Hasinger et al. 1993).
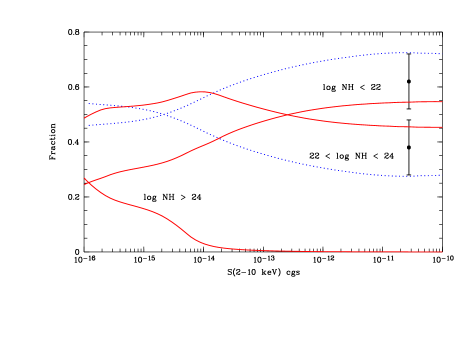
Another inconsistency of most of these models concerns the relatively small expected percentage of type 1 unobscured AGN at the 2–10 keV fluxes currently sampled. Indeed optical identifications of medium–deep ASCA surveys (Boyle et al. 1998; Akiyama et al. 2000) suggest that the fraction of unabsorbed broad line AGN is of the order of 60–70 % while only one third of the sources should be type 1 AGN on the basis of the models predictions (but see 4). The fraction of type 1 AGN can be increased assuming an LDDE2 model for the evolution of the XLF and a flat = 0.7 spectrum for high luminosity objects (Vignali et al. 1999). With these parameters a good fit to the hard XRB spectrum can be obtained even without including heavily obscured ( 1024) sources. As a result the relative ratio between absorbed and unabsorbed objects at relatively bright fluxes (Fig. 3) decreases significantly. However also within this model the hard X–ray counts are seriously underestimated (being consistent with the dotted line in Fig. 2) owing to the decreased emissivity of hard absorbed sources.
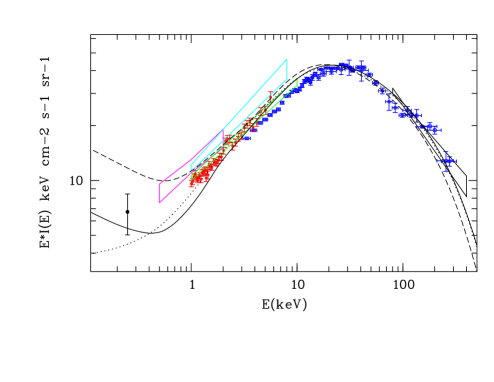
As an example of the link between the various parameters I have computed three different models which provide a good fit to the overall XRB spectrum but differ in the choice of the input spectra and XLF evolution (Fig. 4). Assuming a high fraction of type 1 objects as in the LDDE2 scenario a soft excess component cannot be accomodated as the 1/4 keV background would be overpredicted. On the other hand the class of PLE models without soft excess (which better reproduce the hard X–ray counts, but with the caveats discussed above) suggest a possible contribution from other, steep spectrum, sources to the 0.25 keV background.
4. Is there a way out ?
The main message emerging from what discussed above is that a self–consistent description of all the observational constraints is still lacking. The major problem is the discrepancy between the predictions of those models computed assuming the most up–to–date results, and the high energy ( 2 keV) source counts. One obvious possibility is a substantial contribution from non–AGN, flat spectrum sources. Extremely hard ( 0.2) power–law tails above a few keV, possibly originating in advection dominated accretion flows, have been recently discovered in a small sample of nearby elliptical galaxies (Allen, Di Matteo & Fabian 2000). It has been proposed (Di Matteo & Allen 1999) that these objects constitute the missing population needed to fill the gap between the hard counts and the AGN model predictions. However in this case elliptical galaxies should be a non–negligible fraction of the already identified X–ray sources in ASCA and BeppoSAX surveys at variance with the present breakdown of optical identifications.
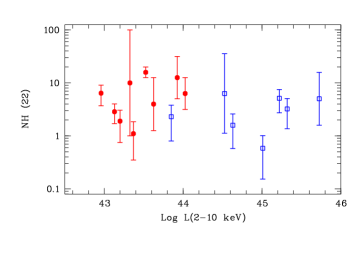
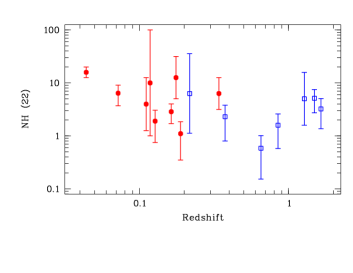
Another interesting possibility, which would allow to include high luminosity highly absorbed AGN in the models and at the same time reproduce most of the observational constraints, is that the optical properties of X–ray obscured AGN are different from what expected (i.e. narrow lined AGN). In this respect the identification of the first High Energy LLarge Area Survey (HELLAS) carried out with BeppoSAX in the 5–10 keV band (Fiore et al. 1999, and this volume) is providing new and unexpected results. In particular, X–ray absorbed AGN are identified with objects which show a large variety of optical classification, such as intermediate type 1.5–1.9 objects, red quasars (Vignali et al. 2000) and even broad line “blue” quasars. A similar behaviour has been also reported for a sample of ROSAT AGN (Mittaz, Carrera, Page this volume). It is also interesting to note that large columns of cold gas have been detected in Broad Absorption Line quasars (Brandt et al. this volume) and in several Broad Line Radio galaxies and radio quasars observed by ASCA (Sambruna, Eracleous & Mushotzky 1999). Although the statistics is not yet good enough to reach firm conclusions, it is quite possible that the correlation between X–ray absorption and optical appearance of AGN change with redshift and/or luminosity (Fig. 5). A decreasing value of the dust–to–gas ratio as a function of the X–ray luminosity would provide a possible explanation of this effect.
5. Conclusions
In order to achieve a major improvement in the exploration of XRB models parameter space, the resolved fraction of its energy density should be of the order of 50–60 % or higher.
Table. 2 - Resolved fraction of the XRB
| 2-10 keV Flux interval | Relative % | Integral % |
|---|---|---|
| 10-11 | 0.5 | 0.5 |
| 10-12-10-11 | 2 | 2.5 |
| 10-13-10-12 | 8 | 10.5 |
| 10-14-10-13 | 32.5 | 43 |
| 10-15-10-14 | 39 | 82 |
| 10-16-10-15 | 16 | 98 |
| 10-16 | 2 | 100 |
The expected contribution of AGN to the 2–10 keV XRB is reported in Table 2 as a function of flux. The model parameters are such to account for an intensity of 7 10-8 erg cm-2 s-1 sr-1 (in between the ASCA and BeppoSAX measurements) at 10-17 cgs. The predictions are model dependent and should be considered as indicative. Nevertheless it is clear that at the fluxes sampled by the foreseen Chandra and XMM medium–deep surveys most of the XRB will be resolved allowing to unveil the nature of the sources making the bulk of its energy density. The most important challenge for XRB models will be the study of X–ray absorption and luminosity distribution for 2–10 keV fluxes 10-13 cgs, the search for heavily obscured AGN which according to the predictions are expected to show up in a substantial fraction below 10-14 cgs (cfr. Fig. 3), and the optical–infrared follow–up of X–ray obscured sources.
ACKNOWLEDGEMENTS
Partial support from ASI contract ARS-98-119 and MURST grant Cofin98-02-32 is acknowledeged. I thank G. Zamorani and R. Gilli for useful discussions.
REFERENCES
Allen S.W., Di Matteo T., Fabian A.C., 2000, MNRAS 311, 493
Akiyama M., et al., 2000, ApJ in press (astro-ph/0001289)
Barcons X., et al., 1998, MNRAS 301, L25
Boyle B.J., et al., 1994, MNRAS 271, 639
Boyle B.J., et al., 1998, MNRAS 296, 1
Cagnoni I., Della Ceca R., Maccacaro T., 1998, ApJ 493, 54
Celotti A., Fabian A.C., Ghisellini G., Madau P., 1995, MNRAS 277, 1169
Comastri A., Setti G., Zamorani G., Hasinger G., 1995, A&A 296, 1
Comastri A., 1999, Astr. Lett. & Comm. 39, 181
Di Matteo T., Allen S.W., 1999, ApJ 527, L21
Fabian A.C., Iwasawa K., 1999, MNRAS 303, L34
Fiore F., et al., 1999, MNRAS 306, L55
Franceschini A., et al., 1999, MNRAS 310, L5
Gendreau K.C., et al., 1995, PASJ 47, 5
Gendreau K.C., Barcons X., Fabian A.C., 1998, MNRAS 297, 41
Georgantopoulos I., et al., 1996, MNRAS 280, 276
Georgantopoulos I., et al., 1999, MNRAS 305, 125
George I.M., et al., 2000, ApJ 531, 52
Gilli R., Risaliti G., Salvati M., 1999, A&A 347, 424
Gruber D.E., et al., 1999, ApJ 520, 124
Hasinger G., et al., 1993, A&A 275, 1
Kinzer R.L., et al., 1997, ApJ 475, 361
Madau P., Ghisellini G., Fabian A.C., 1994, MNRAS 270, L17
Miyaji T., et al. 1998, A&A 334, L13
Miyaji T., Hasinger G., Schmidt M., 1999, Adv. Space Res. in press
Miyaji T., Hasinger G., Schmidt M., 2000, A&A 353, 25
Ogasaka Y., et al., 1998, AN 319, 43
Piccinotti G., et al., 1982, ApJ 253, 485
Pompilio F., La Franca F., Matt G., 2000, A&A 353, 440
Risaliti G., Maiolino R., Salvati M., 1999, ApJ 522, 157
Roberts T.P., Warwick R.S., 1998, AN 319, 34
Sambruna R.M., Eracleous M., Mushotzky R.F., 1999, ApJ 526, 60
Setti G., Woltjer L., 1989, A&A 224, L21
Ueda Y., et al., 1999, ApJ 524, L11
Vecchi A., Molendi S., Guainazzi M., et al., 1999, A&A 349, L73
Vignali C., Comastri A., Cappi M., et al., 1999, ApJ 516, 590
Vignali C., Mignoli M., Comastri A., et al., 2000, MNRAS in press (astro-ph/0002279)
Wilman R.J., Fabian A.C., 1999, MNRAS 309, 862