On breaking the age-metallicity degeneracy in early-type galaxies: Outflows versus Star Formation Efficiency
Abstract
A simple model of chemical enrichment in cluster early-type galaxies is presented where the main parameters driving the formation of the stellar component are reduced to four: infall timescale (), formation epoch (), star formation efficiency () and fraction of gas ejected in outflows (). We find that only variations in or can account for the colour-magnitude relation, so that the most luminous galaxies had low values of ejected gas and high efficiencies. Less massive galaxies can be either related to a lower star formation efficiency (-sequence) or to an increased outflow rate (-sequence). The combination of chemical enrichment tracks with population synthesis models (Bruzual & Charlot 2000) is used to explore the correlation between mass-to-light ratios and masses. A significant slope mismatch is found between stellar and total ratios, which cannot be explained by an age spread and implies a non-linear correlation between total and stellar mass: . The sequences driven by star formation efficiency () and outflows () are shown to predict different trends at high redshift. The variation with redshift of the slope of the fundamental plane will increase significantly in the efficiency sequence — driven by age — and will slightly decrease in the outflow sequence — driven by metallicity. The evolution of the zero point is similar in both cases and within the observational errors of current observations. Measurement of the dependence of the tilt of the fundamental plane on redshift will break the degeneracy between outflows and star formation efficiency, which will enable us to determine whether the colour-magnitude relation is controlled by age or metallicity.
keywords:
galaxies: evolution — galaxies: formation — galaxies: elliptical — galaxies: clusters.1 Introduction
The process of galaxy formation and evolution can be explored in two complementary ways: A “forwards” approach takes into account the physics underlying the most basic processes of structure evolution and star formation and — after finding a suitable set of initial conditions — evolves the system forward so that the final output is compared with observations. This is the philosophy behind N-body simulations or semi-analytic modelling (e.g. Baugh et al. 1998; Kauffmann & Charlot 1998). On the other hand, a “backwards” approach simplifies the physics behind galaxy formation and evolution to a phenomenological problem comprising a reduced set of parameters, using local observations as constraints. Then the system is evolved backwards so that the predictions for a given set of parameters are compared with observations at moderate-to-high redshifts (e.g. Bouwens, Broadhurst & Silk 1998a,b). This “brute force” method allows one to search a reasonable volume of parameter space, throwing light on processes, such as star formation, which are otherwise too complicated to tackle from basic principles.
Cluster early-type galaxies are ideal candidates for a comparison between models and observations. Significant samples of these galaxies can be found over a large redshift range. Furthermore, the tight observed correlations such as the colour-magnitude relation or the fundamental plane can be used as powerful constraints on a phenomenological backwards approach. The list of observed clusters at moderate to high redshift is quite large (e.g. Dressler et al. 1999 ; Stanford, Eisenhardt & Dickinson 1998; Oke, Postman & Lubin 1998; Van Dokkum 1999) and ever increasing (e.g. Yee et al. 1999). Clusters observed at redshifts yield valuable information about the epoch of star formation, pushing it to very high redshift ().
Unfortunately, the direct spectrophotometric determination of the star formation history is hampered by the age-metallicity degeneracy (Worthey 1994; Ferreras, Charlot & Silk 1999) which allows the variations of most of the spectrophotometric observables to be explained either by a range of ages or metallicities. Broadband photometry is strongly dependent both on age and metallicity but even spectral indices targeting single lines such as Balmer absorption or magnesium abundance can change both with age and metallicity. Not surprisingly, a similar age estimation technique based on spectral indices applied to similar sets of elliptical galaxies yields contradictory results: Kuntschner (2000) and Kuntscher & Davies (1998) find coeval stellar populations in Fornax cluster ellipticals so that the colour range is explained by a metallicity sequence. On the other hand, the sample of field and group ellipticals observed by González (1993) and further analysed by Trager et al. (2000) presents a relatively large spread in ages. Hence, the issue of the stellar age distribution in galaxies still requires the aid of modelling. We will show that incorporating chemical enrichment allows one to potentially solve the age-metallicity degeneracy problem. The next three sections describe our chemical enrichment model and the meaning of the reduced set of parameters used to trace the star formation history in cluster ellipticals. §5 deals with the comparison of predicted and observed mass-to-light ratios and its use at high redshift to discriminate between a mass sequence driven by age or metallicity. Finally in §6 we discuss the predictions and list the main conclusions.
2 Model description
The basic mechanisms describing chemical enrichment in galaxies can be reduced to infall of gas, metal-rich outflows triggered by supernovae, and a star formation prescription. Ferreras & Silk (2000, hereafter FS00) described one such simple model for an exponentially decaying infall rate of primordial gas in terms of five parameters: flow rate, timescale and delay of infall, ejected fraction in outflows, and star formation efficiency. Monotonically decreasing star formation rates (SFRs) always encounter the so-called G-dwarf problem. In FS00 the problem was avoided by assuming the metallicity effect was predominant with regard to the spectrophotometric output, thereby enabling us to convolve simple stellar populations with different metallicities given by the chemical enrichment equations but with an average common age.
The G-dwarf problem arises when comparing the predictions of closed box models with the observed paucity of low-metallicity low-mass stars in the halo of our galaxy (Van den Bergh 1962). However, this problem extends to all galaxies and morphologies (Worthey et al. 1996) since any model assuming a monotonically decreasing infall rate overproduces low-metallicity, low-mass stars. These models can be readily ruled out for bright cluster early-type galaxies because the convolution in age and metallicity of simple stellar populations with the chemical enrichment tracks predicted by these models yield or colours which are significantly bluer than the observed values, , for Coma or Virgo (Bower, Lucey & Ellis 1992). The solution to this problem involves either pre-enrichment, i.e. shifting the zero-point of the metal abundance by assuming non-primordial infall (e.g. Sansom & Proctor 1998), or imposing an initial stage of moderate star formation that enriches the interstellar medium, followed by a second stage where most of the stars (with non-primordial abundances) are formed. Several authors (Elbaz, Arnaud & Vangioni-Flam 1995; Chiappini, Matteucci & Gratton 1997) have suggested two-stage processes to solve this problem, as well as a top-heavy initial mass function for the first star forming stage that overproduces high mass stars for a prompt enrichment of the interstellar medium, motivated by the fact that starbursts can be best explained by top-heavy mass functions (Charlot et al. 1993).
In this paper we present a model which avoids these assumptions and solves the G-dwarf problem by considering infall of primordial gas with a rate given by a gaussian distribution. This infall combined with a linear Schmidt law results in a gaussian profile for the star formation rate which is a suitable way of parametrizing a strongly peaked starburst. Furthermore, the extension of this profile to disk galaxies, and in particular to our own galaxy, accounts for the observed metallicity distribution of stars (Rocha-Pinto & Maciel 1996, Wyse & Gilmore 1995): the first stars are formed in a stage with a low SFR, but their contribution to the enrichment of the IGM, along with an increasing SFR with time yields a large population of stars with metallicities close to solar. Once the IGM has reached a very large metallicity — after the peak in the SFR — a low formation rate keeps the tally of stars with a high metal content as low as observed. In this scenario, the difference between early-type and late-type galaxies would amount to an extra component in the SFR for late-type systems, which continue to form stars at a slow rate (Ferreras & Silk, in preparation). Hence, the work in this paper uses the same chemical enrichment equations (described in FS00) based on the formalism described by Tinsley (1980), with just four parameters describing the star formation process, namely:
-
Star Formation Efficiency (): The star formation rate is modelled by a linear Schmidt law, whose proportionality constant determines the formation efficiency. This parameter is a phenomenological approximation to the complex physics underlying star formation. Its inverse represents the timescale in Gyr over which the SFR is extended for a sharply peaked infall of gas. In the Instantaneous Recycling Approximation (IRA), the SFR () and the infall rate () are related by:
(1) (2) is the ejected fraction of gas in outflows — defined below — and is the returned fraction. Low values of extend the process of star formation, generating a larger age spread of the stellar populations.
-
Gas Outflows (): Part of the metal-enriched gas in the IGM is heated by supernovae and ejected from the galaxy, decreasing the effective yield. This will be modulated by the gravitational potential well of the galaxy, so that bright and massive galaxies have lower ejected fractions and so, higher metal abundances (Larson 1974, Arimoto & Yoshii 1987). represents the fraction of gas being ejected at each timestep.
-
Formation redshift (): This parameter describes the epoch — — at which the infall rate (or roughly the SFR) was maximum.
-
Infall timescale (): Determines the duration of infall, so that the infall rate can be written:
(3)
For a given set of these four parameters (,, ,) the equations give a chemical enrichment track which is used to convolve the simple stellar populations from the models of Bruzual & Charlot (2000) both in age and metallicity, to obtain a spectral energy distribution for a given redshift. Motivated by recent results of the angular power spectrum of the Cosmic Microwave Background (Melchiorri et al. 1999), we assume a flat cosmology with a cosmological constant (, , H km s-1Mpc-1), although figure 1 shows the result for an open cosmology () in the range of infall parameters ( and ). The fiducial Initial Mass Function (IMF) chosen is a hybrid one between the Scalo (1986) and the Salpeter (1955) IMF with mass cutoffs . We have adopted the behaviour of the Scalo IMF for low stellar masses () and a Salpeter IMF for the high mass end. The shallow slope of the former for low masses better explains the observations, whereas the steeper slope at high masses of the Salpeter IMF seem to explain better the stellar populations in starbursts. For comparison purposes we show the difference between a Salpeter IMF and our mass function when calculating the correlation between mass-to-light ratio and mass (§5).
Broadband colours are computed from the spectral energy distribution obtained for a given star formation history described by these four parameters (,,,). The colour-magnitude relation observed in local clusters is used as a constraint, so that a one-to-one mapping is assumed between colour and absolute luminosity. We have used the observations of Coma early-type galaxies (ellipticals and lenticulars) by Bower et al. (1992), whose colour-magnitude relation has a scatter ( mag) as small as the uncertainties expected from population synthesis models (Charlot, Worthey & Bressan 1996). Hence, for a given colour obtained from the spectral energy distribution we infer an absolute luminosity:
| (4) |
This correlation was obtained by a robust two-stage linear fit technique which computes a first estimate of slope and zero point using absolute deviations (e.g. Press et al. 1992) and then applies a least-squares fit to the resulting sample after culling points that deviate more than a given threshold. This method prevents outliers from contributing significantly to the final slope and zero point. In this case the number of outliers was 4 out of 36 galaxies. Once the -band absolute luminosity is found, the total stellar mass is obtained using the predicted mass-to-light ratio.

3 Constraints from bright cluster galaxies
The colour of the brightest galaxies in clusters at several redshifts is one of the strongest and most robust constraint that can be imposed on the model parameters. Rest frame colour is very sensitive to age (as well as metallicity). The red colours of the brightest early-type systems observed in Coma () need a dominant population of old stars with a metallicity around solar or higher. Hence, large infall timescales () or low formation redshifts are readily ruled out since they predict bluer colours. Furthermore, observations of clusters at moderate redshifts (e.g. Ellis et al. 1997; Stanford, Eisenhardt & Dickinson 1998; Dressler et al. 1999) have found a colour-magnitude relation consistent with passive evolution, imposing again an old age and high metal content. This motivates the need to use a low ejected fraction () as well as a high star formation efficiency () in order to reproduce the spectrophotometric properties of these galaxies. Figure 1 shows the constraint on infall parameters for the brightest galaxies using a grid of models with and . The constraint imposes a colourcolour correlation between and as observed in Coma and Virgo (Bower et al. 1992) with a scatter of mag. Notice that as long as the bursting stage is short enough ( Gyr), formation redshifts as low as can be accomodated with the photometric data (Ferreras et al. 1999). In fact, a simple stellar population (which is the extreme case of the model described in this paper as ) gives a color of for a stellar population with solar metallicity and formation redshift . This corresponds to a bright () cluster galaxy. The constraint imposes a colour F555WF814W (which maps into restframe ) redder than for the brightest cluster galaxies, as observed in Cl0016+16 (, Ellis et al. 1997 ). The high redshift constraint requires as observed in cluster RX J0848.9+4452 (, Rosati et al. 1999). These constraints rule out models with infall timescales Gyr, which reduces the main star formation episode to less than Gyr. The formation redshift is less restricted, allowing the possibility of , or even with a flat cosmology with a cosmological constant ().
The constraint on the allowed volume of parameter space with respect to infall and its subsequent process of star formation shown in figure 1 is rather robust as it takes into account an observable with a very small uncertainty, namely the broadband colours of the most luminous galaxies. Any significant process of star formation at later stages will readily translate into bluer colours which are ruled out by observations. The modelling of star formation rate as a gaussian profile allows the extension of single burst models to processes where several bursts of star formation take place, as in a “gaseous” merger scenario. The spectrophotometric predictions of a multi-burst scenario can be mimicked by a single gaussian infall rate with a longer time scale (Ferreras & Silk 2000b). Hence, if we consider RX J0848.9+4452 as a representative cluster which will evolve into something like Coma or Virgo, then any hierarchical merging scenario should yield gaseous mergers only at epochs earlier than . Merging stages at lower redshifts should not trigger any significant star formation, for example involving gas-poor progenitors and hot gas, as hinted at by observations of red merging galaxies in cluster MS ( Van Dokkum et al. 1999).
It is worth emphasizing at this point that the brightest galaxies we are dealing with in this model represent the brightest “non-peculiar” systems. Hence, the very brightest cluster galaxies (BCGs) such as cDs should be excluded. In a recent paper, Aragón-Salamanca, Baugh & Kauffmann (1998) analysed the evolution with redshift of a sample of BCGs in 25 clusters in the redshift range . They found no evolution, or even a fading of the absolute -band luminosity which can be explained by a significant change (a factor of 2) in the stellar mass of these galaxies between redshifts and . In the formalism of our model, the reddest — thereby brightest — galaxies are obtained in the corner of parameter space associated with high star formation efficiency (). This implies the star formation rate will be approximately given by the infall rate . For the allowed values of infall parameters (, ) shown in figure 1, the change in stellar mass between redshifts and is very small, and so this model would not be compatible with BCGs. This type of galaxy requires a strong merger rate at late times (). Furthermore, the mergers should undergo no star formation, involving progenitors with either very little gas or hot gas. On the other hand, the evolution of the bulk of cluster early-type systems was explored in a sample of 38 clusters in a similar redshift range () by analysing the near-infrared luminosity function (De Propris et al. 1999). A significant positive luminosity evolution was found for the Schechter parameter which traces the luminosity of the brightest galaxies. The evolution of is found to be compatible with the passive evolution of a simple stellar population, which is consistent with the models presented in this paper for the range of infall parameters shown in figure 1.
4 Exploring parameter space
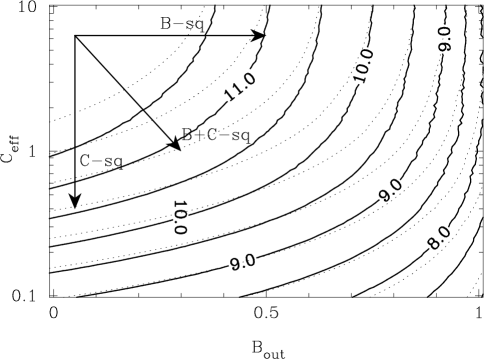
Once we have fixed a region in parameter space for the brightest “non-peculiar” cluster galaxies, we can extend the model to all early-type systems by exploring the parameters describing star formation efficiency and fraction of ejected gas in outflows. Figure 2 shows a contour of stellar masses for two realizations of infall (, Gyr, dotted lines) and (, Gyr, solid lines). The only constraint imposed is the colour-magnitude relation in Coma in order to relate colour — obtained from the star formation history described by a chosen set of parameters (, , , ) — and luminosity, or stellar mass. The contours change slightly with infall parameters but the qualitative behaviour is unchanged. We need both a high star formation efficiency and a low ejected fraction in outflows to account for the most massive galaxies. Lowering the SF efficiency will generate a significant spread in stellar ages that will yield colours that are too blue compared with the observations. On the other hand, a higher ejected fraction will decrease the effective yield, so that the average metallicity will be lower, blueing the predicted colours with respect to the observations. Hence, regardless of the choice of parameters, we find the brightest cluster galaxies to lie in a well-defined corner of the 4-dimensional parameter space explored in this paper. Lower mass galaxies are harder to identify because of a degeneracy between outflow rates and star formation efficiency. The blueing of galaxies as we progress down in luminosity along the colour-magnitude relation can be explained either by decreasing the average metallicity of the stellar populations (i.e. a range of ejected fractions, ) or by increasing the fraction of younger stars (i.e. a range of SF efficiencies, ). The real picture will likely involve a range both in and . At low redshift it is hard to disentangle the contribution from these two parameters, mainly caused by the age-metallicity degeneracy (Worthey 1994). However, these two alternative mechanisms will predict different evolutions with lookback time: as we go to higher redshift, the sequence driven by SF efficiency (hereafter sequence) will show stronger evolutionary scars because of the larger scatter in age, whereas the sequence driven by outflows (hereafter sequence) will be unaffected until the observations go back to the epoch of star formation.

Figure 3 shows the predicted distributions of stellar ages (left) and metallicities (right). The average (top) and standard deviation (bottom) of these distributions are shown for three sequences: , and driven by outflows, star formation efficiency and a mixture of both, respectively. All of these models have Gyr, ; the sequence fixes ; the sequence fixes ; and the mixed sequence imposes a correlation between these two parameters. We expect the star formation efficiency to be higher in more massive galaxies (where the ejected fraction should be lower), hence we have chosen: , as an illustrative example. An outflow-driven sequence generates a pure metallicity sequence where the stellar populations of all galaxies are coeval. This is the model favored by the analysis of the colour-magnitude relation by Kodama et al. (1998) for a sample of 17 clusters in a wide redshift range (). In a sequence the colour-magnitude relation is due to a pure mass-metallicity correlation, so that the brightest galaxies have higher metal abundances. On the other hand, a or a model represents mixed age+metallicity sequences as it generates a significant age spread of the stellar populations as well as a metallicity range. A pure age sequence explored in other papers (e.g. Kodama & Arimoto 1997) is ruled out when including chemical enrichment for any reasonable assumption about the star formation history of the galaxy. The low metallicity expected in the fainter galaxies can therefore be explained either by a lower effective yield caused by gas outflows, or by a low star formation efficiency that slows down the process of enrichment. Nagashima & Gouda (1999) mention the effect of the UV background radiation as a possible alternative to supernovae winds to suppress chemical enrichment. However, in this scenario it seems hard to motivate the correlation found with respect to luminosity (e.g. a stronger feedback should be expected from the UV background for the fainter galaxies). Figure 3 shows that a sequence implies a Gyr age difference between the brightest systems and galaxies with a larger age spread for the fainter galaxies, as expected for a system with a lower star formation efficiency. This model would thus be consistent with the smaller age and metallicity scatter found in Coma ellipticals (Jørgensen 1999). This age difference is negligible for local clusters, since the predicted youngest stars are still too old ( Gyr) to be detected spectrophotometrically. However, predictions between a coeval sequence and a sequence at lookback times Gyr (i.e. ) differ significantly as shown below (§5). A sequence predicts a small age and metallicity spread in faint ellipticals. In this case the observed photometric scaling relations are just driven by the average metallicity.
5 Mass-to-Light ratios: Stellar versus Observed
The evolution of the stellar mass-to-light ratio is a suitable probe for the analysis of the ages of the stellar populations in galaxies because of its weak dependence on metallicity (especially when measured in NIR passbands). However, observed ratios carry large uncertainties and systematic offsets as they are computed from central velocity dispersions (), sizes () and surface brightnesses (), requiring a prescription for the structure in order to infer masses and luminosities. From a simple dimensional analysis, we can write the mass and luminosity of a galaxy as:
| (5) |
| (6) |
The proportionality constant only depends on the way the surface brightness is defined with respect to the effective size. However, depends on the structure of the galaxy, which requires a dynamical model (e.g. King 1966; Bender, Burstein & Faber 1992), usually assumed to be invariant with regard to galaxy mass or size (i.e. homologous). Furthermore, a comparison between observations and model predictions depends on a prescription that relates stellar and total matter. Despite all these caveats, mass-to-light ratios are one of the best candidates for breaking the age-metallicity degeneracy.

Figure 4 shows the predicted ratios in two passbands: optical () and NIR () for a grid of (thin) and (bold) sequences. A mixed sequence would be represented by a trajectory between the grid spanned by these lines. The results are shown for three different infall timescales Gyr. The solid triangles are the observations of Coma cluster galaxies from Mobasher et al. (1999), whereas the dots represent ellipticals in 11 clusters from the sample of Pahre (1999). The slope of the correlation between mass-to-light ratios and masses is in the band and in band, whereas purely stellar ratios yield slopes around and in the and bands, respectively. This mismatch cannot be related to a different stellar population. Being a strongly age-dependent observable, the only way to generate the observed slopes in would require a stellar age spread with respect to galaxy mass whose restframe colour would significantly disagree with the colours in moderate redshift cluster ellipticals. As a simple check to confirm this, we used simple stellar populations (SSP, i.e. no age or metallicity spread). If we relate the brightest galaxies () to a SSP with an age of 12 Gyr and a super-solar metallicity , the required age for the SSP for a galaxy which would explain the observed slope should be Gyr () or Gyr (). These two possibilities yield colours of and respectively, so that the latter is barely consistent with the observed broadband photometry in nearby clusters (Bower et al. 1992). However, this hypothesis fails when considering moderate redshift clusters: for instance, cluster Cl0016+16 () has a well-defined red-envelope in a large range of luminosities (Ellis et al. 1997), yet the lookback time ( Gyr in our adopted cosmology) would be larger than the expected age for the stars in the fainter galaxies !
Hence, the only plausible way to solve this slope mismatch is by imposing a non-linear correlation between total mass (including dark matter) and stellar mass. A simple power law (FS00) has been used in figure 4 to transform predicted stellar masses and mass-to-light ratios to total masses and . The agreement is good in both bands, which means the observed slope difference in the fundamental plane between passbands can be explained by the stellar populations alone. This result agrees with the analysis of Jørgensen (1999) who refers to a higher fraction of dark matter in the most massive ellipticals in order to account for the mismatch between age estimates using ratios (which involves the total mass of the galaxies) or indices (involving just the stellar component). However, one should bear in mind that there are alternative explanations for this slope mismatch, such as a systematic variation of the initial mass function or the breaking of the homology for the structural parameters of early-type systems (Jørgensen 1999; Pahre et al. 1998). Graham & Colless (1997) examined the effect of a non-homologous light profile in 26 early-type systems in the Virgo cluster and found no differences in the fundamental plane from estimates using a universal de Vaucouleurs profile.
Notice the scatter of the correlation is not the minimum one can obtain when computing the fundamental plane. The dependence of the fundamental plane on the observables (velocity dispersion, surface brightness and galaxy size) is not precisely the one inferred for the correlation between mass-to-light ratio and mass. This scatter has an observational component as well as an intrinsic contribution. The intrinsic part can be related to differences in either the stellar ages or the initial mass function of galaxies with the same mass. The former can be caused by slightly different formation redshifts or infall timescales. Notice the predictions of ratios for three different infall timescales in figure 4. A variation of 1 Gyr in infall timescale can account for changes in roughly of order dex. Furthermore, a non-universal IMF will add a variation around dex. The top-center panel displays the predictions for our fiducial “hybrid” IMF and a Salpeter IMF with the same mass cutoffs (). A different cutoff or slope at the high mass end will not change the result very much since these changes only have an effect on metallicity. However, changes in the low mass end of the IMF will significantly alter the mass-to-light ratio. Our “hybrid IMF” behaves like a Scalo function at low masses, whereas a Salpeter mass function produces a large fraction of low mass stars, thereby increasing the stellar ratio.

The different age distributions obtained for the and sequences generate different predictions for the evolution of the slope of the correlation between stellar ratio and mass. We have shown above that a sequence (driven by outflows) is equivalent to a metallicity sequence. Hence, a very small slope change is expected since mass-to-light ratios are not very sensitive to metal abundance. Furthermore, the decrease in will be greater at higher metallicities (i.e. for the brightest galaxies), so that the correlation will get flatter. In order to quantify the slope change, an index is defined as the slope change between redshift and using mass-to-light ratios in the passband, namely:
| (7) |
Hence, a sequence predicts small negative values for . On the other hand, a sequence is driven by age, so that the faintest galaxies — which will have a younger stellar population — will decrease their ratios with redshift faster than the brighter (and older) galaxies. This corresponds to a more significant and positive value for . Figure 5 shows the evolution of the slope (top panels) and zero point (bottom panels) of the correlation between mass-to-light ratio and mass for a range of infall timescales (left) or formation redshifts (right). The points show the observations of a few clusters in restframe band: Coma (), Cl 1358+62 (), Cl 0024+16 (), MS 2053+03 () and MS1054-03 () from the compilation in Van Dokkum et al. (1998). Any sequence (, , ) will predict a decrease of the zero point as the stellar populations get younger at higher redshift, although the zero point decreases faster for a sequence, for which the average stellar population is younger. Current observations of moderate redshift cluster ellipticals allow an estimate of the zero point but not of the slope with enough accuracy. For instance, the study of Jørgensen et al. (1999) with clusters at low and moderate redshifts seem to indicate a steepening of the correlation between and mass, thereby favouring a sequence. However, selection effects could actually mimic such behaviour. Forthcoming spectroscopic observations of cluster ellipticals will enable us to estimate this slope, thereby allowing us to determine the importance of outflows and star formation efficiency in the evolution of cluster early-type galaxies.
6 Discussion
A simple phenomenological treatment is described in this paper, where the mechanisms underlying the evolution of galaxies are reduced to a set of four parameters. The star formation rate is assumed to follow a linear Schmidt law whose proportionality constant is used to describe a varying star formation efficiency (). The supply of primordial gas fuelling star formation is controlled by gaussian infall characterised by the epoch at which the infall rate is maximum (), and the width of the gaussian profile gives a characteristic infall timescale (). The model is allowed to eject a fraction () of the enriched gas, thereby lowering the effective yield. A first stage in this analysis involves finding a suitable pair of infall parameters (,) which are capable of generating the restframe colours of the brightest cluster galaxies. The colour constraints imposed by the reddest (and brightest) galaxies in clusters at moderate and high redshift allow us to discard long infall timescales and recent star formation epochs. One could argue that the constraint on the star formation history of the brightest systems need not be the same as for less massive ellipticals. However, the current most plausible scenarios for galaxy formation assume either a simultaneous process of star formation regardless of galaxy mass, or a hierarchical structure where the most massive galaxies might have undergone the latest bursts of star formation. Furthermore, the possibility of an “inverted-hierarchical” scenario can still be accomodated in this model, as long as the constraints imposed (, Gyr) are held even for the less massive galaxies.
Out of the four parameters considered in the model, we have found that — within the framework of this model — only the SF efficiency () and the ejected fraction in outflows () help determine the mass sequence in cluster early-type galaxies. Infall parameters (,) do not appreciably change much the output unless very recent stages of star formation are included. However, this will result in restframe colours that are in contradiction with observations. The efficiency parameter generates a significant spread in the age distribution of stars, although mixed with a metallicity range (any model with a reasonable IMF must include this range of abundances). Alternatively, a range of outflow rates result in a range of metallicities with no significant spread in ages. Both mechanisms are degenerate in local clusters because the average age of the stellar populations predicted for any model at are too old to be able to disentangle the effects of age and metallicity. However, the predictions of age-sensitive observables at high redshift differ noticeably for these two sequences. Unfortunately, present data is not capable of ruling out one model against the other, but the continuing flow of data from clusters at moderate-to-high redshift will eventually enable us to break this degeneracy. A sequence driven by efficiency ( sequence) predicts a steepening of the slope of the fundamental plane, whereas a sequence — driven by outflows — predicts no change or a slight decrease of this slope. High precision observations of the dynamical and spectrophotometric properties of cluster galaxies at high redshift will confirm the importance of either age or metallicity in the mass range of cluster ellipticals.
Acknowledgments
The authors would like to thank the anonymous referee for useful comments and suggestions.
References
- [1] Aragón-Salamanca, A., Baugh, C. M. & Kauffmann, G. 1998, MNRAS, 297, 427
- [2] Arimoto, N. & Yoshii, Y. 1987, A& A, 173, 23
- [3] Baugh, C. M., Cole, S., Frenk, C. S. & Lacey, C. G., 1998, ApJ, 498, 504
- [4] Bender, R., Burstein, D. & Faber, S. M. 1992, ApJ, 399, 462
- [5] Bouwens, R., Broadhurst, T. & Silk, J. 1998a, 506, 557
- [6] Bouwens, R., Broadhurst, T. & Silk, J. 1998b, 506, 579
- [7] Bower, R. G., Lucey, J. R. & Ellis, R. S. 1992, MNRAS, 254, 601
- [8] Bruzual, G. & Charlot, S. 2000, In preparation
- [9] Charlot, S., Ferrari, F., Mathews, G. J. & Silk, J. 1993, ApJ, 419, L57
- [10] Charlot, S., Worthey, G. & Bressan A. 1996, ApJ, 457, 625
- [11] Chiappini, C., Matteucci, F. & Gratton, R. 1997, ApJ, 477, 765
- [12] De Propris, R., Stanford, S. A., Eisenhardt, P. R., Dickinson, M. & Elston, R. 1999, AJ, 118, 719
- [13] Dressler, A., Smail, I., Poggianti, B. M., Butcher, H., Couch, W. J., Ellis, R. S. & Oemler, A. 1999, ApJS, 122, 51
- [14] Elbaz, D., Arnaud, M. & Vangioni-Flam, E. 1995, A&A, 303, 345
- [15] Ellis, R. S., Smail, I., Dressler, A., Couch, W. J., Oemler, A., Butcher, H. & Sharples, R. M. 1997, ApJ, 483, 582
- [16] Ferreras, I., Charlot, S. & Silk, J. 1999, ApJ, 521, 81
- [17] Ferreras, I. & Silk, J. 2000, ApJ, March 20, astro-ph/9910385 (FS00)
- [18] Ferreras, I. & Silk, J. 2000b, in Cosmic Evolution and Galaxy Formation, ed. R. Terlevich et al. (ASP), astro-ph/0002392
- [19] González, J. J. 1993, Ph.D. thesis, UC Santa Cruz
- [20] Graham, A. & Colless, M. 1997, MNRAS, 287, 221
- [21] Jørgensen, I. 1999, MNRAS, 306, 607
- [22] Jørgensen, I., Franx, M., Hjorth, J. & Van Dokkum, P. G. 1999, astro-ph/9905155
- [23] Kauffmann, G. & Charlot, S. 1998, MNRAS, 294, 705
- [24] King, I. R. 1966, AJ, 71, 64
- [25] Kodama, T. & Arimoto, N. 1997, A& A, 320, 41
- [26] Kodama, T., Arimoto, N., Barger, A. J. & Aragón-Salamanca, A. 1998, A&A, 334, 99
- [27] Kuntschner, H. & Davies, R. L. 1998, 295, L29
- [28] Kuntschner, H. 2000, MNRAS, in press, astro-ph/0001210
- [29] Larson, R. B. 1974, MNRAS, 169, 229
- [30] Melchiorri, A. et al. 1999, astro-ph/9911445
- [31] Mobasher, B., Guzmán, R., Aragón-Salamanca, A. & Zepf, S. 1999, MNRAS, 304, 225
- [32] Nagashima, M. & Gouda, N. 1999, astro-ph/9906184
- [33] Oke, J. B., Postman, M. & Lubin, L. M. 1998, AJ, 116, 549
- [34] Pahre, M. A., De Carvalho, R. R. & Djorgovski, S. G. 1998, AJ, 116, 1606
- [35] Pahre, M. A. 1999, ApJS, 124, 127
- [36] Press, W. H., Teukolsky, S. A., Vetterling, W. T. & Flannery, B. P. “Numerical Recipes in C”, 1992, Cambridge
- [37] Rocha-Pinto, H. J. & Maciel, W. J. 1996, MNRAS, 279, 447
- [38] Rosati, P., Stanford, S. A., Eisenhardt, P. R., Elston, R., Spinrad, H., Stern, D. & Dey, A. 1999, AJ, 118, 76
- [39] Salpeter, E. E. 1955, ApJ, 121, 161
- [40] Sansom, A. E. & Proctor, R. N. 1998, MNRAS, 297, 953
- [41] Scalo, J. M. 1986, Fund.Cosm.Phys. 11, 1
- [42] Stanford, S. A., Eisenhardt, P. R. & Dickinson, M. 1998, ApJ, 492, 461
- [43] Tinsley, B. M. 1980, Fund.Cosm.Phys., 5, 287
- [44] Trager, S. C., Faber, S. M., Worthey, G. & González, J. J. 2000, AJ, in press, astro-ph/0001072
- [45] Van den Bergh 1962, AJ, 67 486
- [46] Van Dokkum, P. G., Franx, M., Kelson, D. D. & Illingworth, G. D. 1998 , ApJ, 504, L17
- [47] Van Dokkum, P. G. 1999, Ph.D. thesis, Groningen
- [48] Van Dokkum, P. G., Franx, M., Fabricant, D., Kelson, D. D. & Illingworth, G. D. 1999, ApJ, 520, L95
- [49] Worthey, G. 1994, ApJS, 95, 107
- [50] Worthey, G., Dorman, B. & Jones, L. A. 1996, AJ, 112, 948
- [51] Wyse, R. & Gilmore, G. 1995, AJ, 110, 2771
- [52] Yee, H. K. C., Gladders, M. D. & López-Cruz, O. 1999, astro-ph/9908001