A New Probe of the Molecular Gas in Galaxies:
Application to M101
Abstract
Recent studies of nearby spiral galaxies suggest that photodissociation regions (PDRs) are capable of producing much of the observed HI in galaxy disks. In that case, measurements of the observed HI column density and the far–ultraviolet (FUV) photon flux responsible for the photodissociation process provide a new probe of the volume density of the local underlying molecular hydrogen. We develop the method and apply it to the giant Scd spiral M101 (NGC 5457). The HI column density and amount of FUV emission have been measured for a sample of 35 candidate PDRs located throughout the disk of M101 using the Very Large Array and the Ultraviolet Imaging Telescope. We find that, after correction for the best-estimate gradient of metallicity in the ISM of M101 and for the extinction of the ultraviolet emission, molecular gas with a narrow range of density from 30–1000 cm-3 is found near star-forming regions at all radii in the disk of M101 out to a distance of kpc, close to the photometric limit of .
In this picture, the ISM is virtually all molecular in the inner parts of M101. The strong decrease of the HI column density in the inner disk of the galaxy at kpc is a consequence of a strong increase in the dust-to-gas ratio there, resulting in an increase of the formation rate on grains and a corresponding disappearance of hydrogen in its atomic form.
1 Introduction
Massive gas clouds in the ISM are considered to be the progenitors of young stars in the conventional picture of star formation in galaxy disks. The gas may initially be either in an atomic or in a molecular state (Elmegreen, 1995) depending on the ambient physical conditions (UV flux and gas pressure), but as the volume densities increase through self-gravity, the gas becomes mostly molecular on its way to forming stars. Once the gas is molecular and at densities above , the cooling rate is so high (e.g. Goldsmith & Langer (1978)) that rapid collapse follows. The rate-determining step in the conventional picture is then the aggregation of HI or diffuse and the formation of Giant Molecular Clouds. Elmegreen (1993) has discussed this problem in detail.
For many late-type systems, the rate-determining step along the path to star formation appears to be the conversion of HI clouds into . The fraction of the ISM in atomic form is thought to increase as one progresses along the Hubble Sequence towards the late-type galaxies (see e.g. the review by Roberts & Haynes (1994)). Furthermore, the atomic fraction is thought to dominate the molecular by an order of magnitude or more for a significant number of actively-star-forming galaxies of types Sc and later (Young & Knezek, 1989).
However, in recent years evidence has been accumulating that a significant fraction of the HI in the ISM of galaxies is in fact not a precursor to the star formation process, but instead is produced by photodissociation of the by UV photons emanating from nearby newly-formed massive stars. In that case, either the way we compute the molecular fraction in galaxies via the CO(1-0) emission is wrong, or our ideas of how to control the otherwise runaway collapse of molecular clouds to form stars need further modification. Shu (1997) has summarized the view that magnetic fields may be a controlling factor in cloud collapse.
The dissociation process was first described by Stecher & Williams (1967). The absorbs photons emitted at 1108 Å and 1008 Å via electronic transitions in the Lyman () and Werner () bands. In the subsequent decay to the vibrationally excited levels of the ground electronic state, % of the molecules will dissociate. Photons with wavelengths as long as Å can continue to create HI by dissociating the “pumped” () via additional Lyman and Werner band transitions. The UV fluorescence spectrum predicted from this process was first observed by Witt et al. (1989) in the nebula IC 63.
The initial evidence that HI may be a product of the star formation process rather than a precursor to it was discovered in a comparison of the morphology of dust lanes and HI ridges in a prominent spiral arm of the galaxy M83 (NGC 5236) by Allen et al. (1985, 1986). This comparison showed that the ridges defining the HI spiral arms peaked not on the dust lanes, as would have been expected in the conventional picture of density-wave-triggered star formation (Roberts, 1969), but instead they were co-linear with the chain of HII regions created by young massive stars forming downstream from the dust lane. Other studies followed on M83 and other nearby spiral galaxies and have generally reached the same conclusions: for M83 (Tilanus & Allen, 1993) , for M51 (Vogel et al., 1988; Tilanus & Allen, 1987; Tilanus et al., 1988; Tilanus & Allen, 1989, 1990, 1991; Rand et al., 1992; Knapen et al., 1992), and for M100 (Knapen & Beckman, 1994, 1996).
Infrared data are providing important support for this picture. For instance, models constrained by KAO measurements of the m [CII ] line indicate that photodissociation may produce as much as 70%–80% of the HI in the disk of NGC 6946 (Madden et al., 1993). More recently, spectra of nearby galaxies taken with the ISO satellite indicate that the bulk of the mid-infrared emission from galaxy disks arises in photodissociation regions (PDRs) (Laurent et al., 1999; Roussel, Sauvage, & Vigroux, 1999; Vigroux et al., 1999).
Photodissociation therefore appears to be an important, and in some cases perhaps even the dominant, factor in defining the appearance and distribution of HI in galaxies, at least over the main body of their stellar disks. In the PDR picture, HI is produced on the surfaces of molecular clouds by the action of far-UV photons from nearby O and B (and some A) stars. The physics of PDRs has been worked out in detail (see e.g. the review by Hollenbach & Tielens (1999)), partly in response to new observational results on the infrared spectra of nearby Galactic star-forming regions such as Orion.
Recognition of the layered structure of the different atomic and molecular species which exist in dense, bright PDRs like the Orion Bar (, Tielens et al. (1993)) requires linear resolution better than pc, and the HI layer in this case would be only pc thick. However, PDRs are also formed by modest UV fluxes incident on low-density clouds, and the HI layers in this case are much thicker. For example, Williams & Maddalena (1996) have identified a large, low-density PDR in the Galaxy, near the molecular cloud G216-2.5. In this case, the HI layer is probably 10-50 pc thick (), and appears in projection as an object about pc in size. While the IR emission from such large, low-density PDRs is hard to detect (but see Luhman & Jaffe (1996)), the HI emission is actually easier to measure, since the PDR is larger and therefore covers a larger fraction of the radio telescope beam at 21 cm. The problem with such measurements in the Galaxy which Williams and Maddelena had to circumvent is the confusion of the HI profiles by unrelated gas along the same line of sight. Synthesis imaging radio telescopes can now offer linear resolutions of order 100–200 pc in the nearby galaxies, and the confusion problem can be minimized by choosing galaxies which are viewed more face-on.
The combination of high spatial resolution ( pc) HI mapping along with far ultraviolet (FUV) and H imagery provides a unique opportunity to explore the details of the photodissociation picture in external galaxies. FUV imagery at Å ( eV) directly measures the lower energy photons which can dissociate “pumped” molecular gas, and serves as a tracer for the more energetic photons in the range Å which start the pumping process for ground-state . H imagery is used to assess the importance of extinction, which may be substantial in the far ultraviolet. Allen et al. (1997), hereafter A97, have used this technique with the Sb(r)I-II galaxy M81, finding that patches of HI emission are often located at the periphery of star forming regions mapped in the FUV, as expected for PDRs. The HI column densities in M81 are consistent with the photodissociation of a low density molecular gas by relatively modest UV fluxes111However, A97 did not adjust their results for the possible effects of internal extinction of the UV flux in M81, nor for changes in the dust-to-gas ratio. As we shall see in this paper, both corrections can be important..
In this paper, we extend the work of A97 to the Sc(s)I galaxy M101 and carry out a much more extensive and quantitative analysis of the data. Owing to its proximity (7.4 Mpc, Kelson (1996)), its nearly face–on orientation, and the availability of FUV, H, and HI data, M101 is the next obvious candidate for this type of work. The best angular resolution presently available in HI for M101 is ; this corresponds to pc, just adequate to permit identification of the larger PDRs, but still not sufficient to provide much morphological detail. The M101 data are discussed in §2; they have all been drawn from existing archival data sets. A representative sample of PDRs is identified and discussed in §3. The volume density of the gas, , associated with each PDR is derived in §3.5. The implications of the resulting radial profile of are discussed in §4.
The method used in this paper provides a new probe for studying the molecular gas content of galaxies which can be compared with the conventional results obtained from using the CO molecular emission (e.g. Solomon et al. (1983)). Questions have been raised about the reliability of CO as a tracer for molecular hydrogen in galaxy disks (e.g. Allen (1996); Combes (1999)), and it is of interest to explore other ways of establishing the amount and physical state of the ISM in different parts of galaxies.
2 Archival Data Used
The FUV image of M101 was obtained by the Ultraviolet Imaging Telescope (UIT) (Stecher et al., 1992, 1997) during the Astro-2 mission with the B1 filter ( Å, Å) and an exposure time of 1310 s. The spatial resolution and pixel spacing of the image are FWHM and , respectively. Astrometric and photometric uncertainties are and %, respectively. An image of the H emission with resolution FWHM was obtained from L. van Zee and M. Haynes. The VLA 21 cm line data were provided by R. Braun. The spatial resolution is FWHM (215 pc), and the pixel spacing is (72 pc). The velocity channels are separated by 5.16 km s-1 and the velocity resolution is 6.2 km s-1. We re-derived a map of the HI column density, (HI ), by using the pixels in the channel maps whose values exceed 3 times the noise value of 16.8 K. The radial profile of the HI column density derived from our data agrees with the original data portrayed in Figure 8a of Braun (1997). Full-size images of the FUV, H, and HI emission from M101 can be found in Waller et al. (1997), Van Zee et al. (1998), and Braun (1995), respectively.
The original astrometry of the FUV and H images appears to be excellent based upon the general agreement in the positions of FUV peaks and H sources, and in the large–scale spatial distribution of the FUV continuum and the H and 21 cm line emission. The astrometry of the HI images is intrinsically , owing to the calibration procedures used at the VLA. The FUV and H images are then smoothed and resampled to match the spatial resolution and pixel spacing of the HI data.
3 Results and Analysis
The relationship between the FUV, H, and HI emission is illustrated in Figures 1 and 2. Boxes indicate the locations of regions shown in more detail in Figures 3 through 6. These regions are chosen arbitrarily to provide examples of the detailed FUV, H, and HI morphology. A large–scale spatial correspondence between the 21 cm line emission and the FUV and H emission is observed, as expected in both the conventional and photodissociation pictures. Star formation occurs where “sufficient amounts” of gas have accumulated in the conventional picture. However, that picture does not yet provide a quantitative connection between e.g. the amount of precursor gas (both atomic and molecular) which is present and the number of young stars formed from it. Determining this relation from the observations is currently an active area of research in the study of star formation in galaxies (e.g. Kennicutt (1998)).
On the other hand, the photodissociation picture provides a direct, quantitative connection between the FUV flux emanating from a region of recent star formation, the volume density of the , and the column density of the surrounding HI . We have chosen in what follows to interpret our results in terms of the photodissociation picture. While we clearly favor such an approach, we must emphasize that our data, by themselves, do not provide a definitive argument against the conventional picture.
3.1 FUV and H: Mapping Star Forming Regions
Extinction effects are much stronger at 1500 Å than in the visual, as indicated by reddening curves for the Milky Way (e.g. (Savage & Mathis, 1979)) and the Small Magellanic Cloud (e.g. (Hutchings, 1982)). This fact raises the concern that ultraviolet–based studies may be biased if entire star forming regions are totally obscured at FUV wavelengths. For this reason, A97 explore the effects of extinction in M81 by comparing the FUV and H emission. These authors find a strong correspondence between the small–scale structure of the FUV and H emission in M81, with every bright, reliable H source having a FUV counterpart. This suggests that the FUV morphology is relatively unaffected by extinction, or at least that the FUV and the H are affected in the same way.
To explore the importance of extinction in M101, we examined a set of non–stellar H sources for FUV counterparts. We selected objects with the simple goal of constructing a set of representative sources distributed across the galaxy which could be examined interactively for FUV counterparts. The automated point source extraction routines found in GIPSY and IRAF are sufficient for this purpose, yielding H sources when using a peak intensity threshold of 15. The resulting set does not form a statistically complete sample. Visual inspection of the data reveals that approximately 10% of the sources lack a detectable FUV counterpart within a radius of (360 pc), at the present sensitivity. A comparison with the H images of M101 presented in Hodge et al. (1990) shows that these sources are in fact real HII regions, and not artifacts. Examples of H sources without FUV counterparts may be seen in Figure 3; these sources tend to be fainter H peaks. Source coordinates are given in Table 1. Sources such as those observed at RA = , Dec, and at RA = , Dec = are foreground stars, based upon the continuum and narrow–band imagery of Hodge et al. (1990). The existence of equally faint H sources with FUV counterparts indicates that the lack of FUV emission is more likely to be an extinction effect than a sensitivity issue.
We conclude that FUV wavelengths effectively map the locations of the majority of the star forming regions in M101, without severe extinction effects. (The amount of extinction will be discussed further in Section 3.5.2). In this case, FUV mapping offers an additional advantage over H mapping in that FUV wavelengths will trace older sites of star formation in which ionizing stars are no longer present. Such FUV–bright/H–dim sites are powered primarily by B stars, whose photon energies are still favorable for the dissociation of . A97 find that 10% of 144 FUV sources in M81 do not exhibit H emission. We identified FUV sources distributed across M101, using a threshold peak intensity of . Of these, the brightest 177 (half of the sources) were visually examined for the presence of H counterparts. Approximately 7% of the 177 sources do not appear to have an H counterpart within (360 pc), at the present sensitivity. Examples of such sources are seen in Figure 5 at A) RA(1950) = , Dec(1950) = ; B) RA = , Dec = ; C) RA = , Dec = .
In the remainder of the paper, we focus our attention on a smaller sample of approximately 100 FUV sources. The selection criteria were driven by our desire to identify a set of representative sources distributed across M101, manageable in size. The resulting sample is not intended to be statistically complete. The sample contains all FUV sources with peak intensities identified by the point source extraction routines. These sources comprise 2/3 of the set. The remaining sources were chosen by eye to bring the total number of sources to , while keeping the distribution uniform across the galaxy. This technique ensures that we do not exclude sources that may have been missed by the point source extractors. The added sources have peak intensities of . All but one (a weak elongated source) belong to the set of 350 sources discussed above. The properties of the H and HI emission are not considered during the source selection.
3.2 The Detailed Morphology of the FUV and HI
The small–scale relationship between the FUV and the HI emission is shown in Figures 4 and 6. The general distribution of the HI gas follows that of the diffuse FUV emission, with enhancements in the 21 cm line emission seen near FUV peaks, as in M81. All but 2 of the FUV sources exhibit 21 cm line emission within 800 pc of the source. Specific regions of interest in M101 include the area surrounding SN 1951, located at RA(1950) = , Dec(1950) = , at the inner edge of the prominent eastern spiral arm. Here, FUV emission is coincident with and extends from the site of the NGC 5462 HII region (RA(1950) = , Dec(1950) = , our Figure 4, see also Figure 7 of Viallefond et al. (1981)). Emission from the 21 cm line lies along the periphery of the HII region but is absent in the vicinity of SN1951 itself. Within the framework of the photodissociation picture, an explanation for this morphology could be that this is a region of intense past and present star formation, as evidenced by the FUV, H and radio continuum emission. Generations of supernovae prior to SN1951 may have evacuated much of the surrounding molecular gas, resulting in the apparent hole in the gas distribution. Non–ionizing photons may have dissociated the skins of the remaining molecular gas clouds, creating the observed HI which neatly curves around the existing FUV–emitting regions. A sketch of the spatial relationships between the FUV, H, and HI emission in this type of situation may be found in Case IV, Figure 8 of A97.
A case in which the star forming regions may lie above the mid–plane of the galaxy is seen at RA = , Dec = in Figure 4. Here, the NGC 5461 complex shows enhanced HI emission slightly offset from the main FUV source, as well as spatially coincident HI . The NGC 5447 complex, with peaks at RA = Dec and RA = and Dec = , in Figure 6 is another example of this morphology, which occurs when HI appears spread over the FUV-emitting region but without much associated extinction. The HI in this case is behind the FUV source along the line of sight, as in Case I, Figure 8 of A97.
Another interesting morphological behavior is exemplified by the small FUV–bright/H–dim source located in the HI depression at RA = Dec = , just north of NGC 5447 in Figure 6. This site may represent an older star forming region which has blown a hole through the plane of the galaxy. Non–ionizing photons from the remaining B stars could be dissociating the walls of the hole, producing the observed HI . This scenario corresponds to that illustrated in Case III, Figure 8 of A97.
Finally, we note that the large loop of HI centered at approximately RA = , Dec = in Figure 4 presents a case where some of the PDRs may be obscured. The northern portion of the loop shows the presence of fainter H sources and only weak FUV emission. The southern portion of the loop contains multiple, brighter FUV sources, however. Some of these sources also appear to lack H counterparts, and may be older sites of star formation (e.g. the FUV peak located at RA = , Dec = ). This behavior could be explained if star forming regions in the northern portion of the loop lie closer to the mid–plane of the galaxy, in a behavior intermediate between Cases I and II in Figure 8 of A97. The northern sources may also be younger sites of star formation which have not had sufficient time to break through the ISM. These types of sources are clearly in the minority, however; the locations of the majority of candidate PDRs are effectively mapped by the FUV emission.
3.3 Candidate PDRs
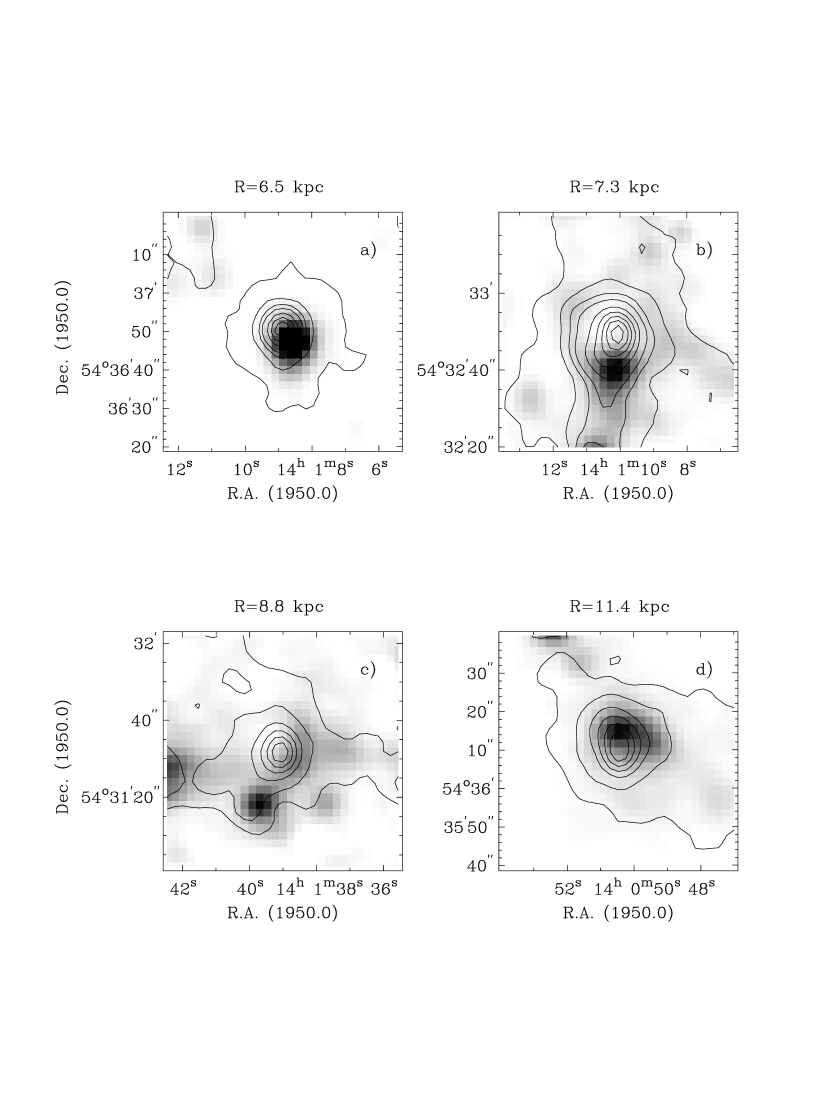
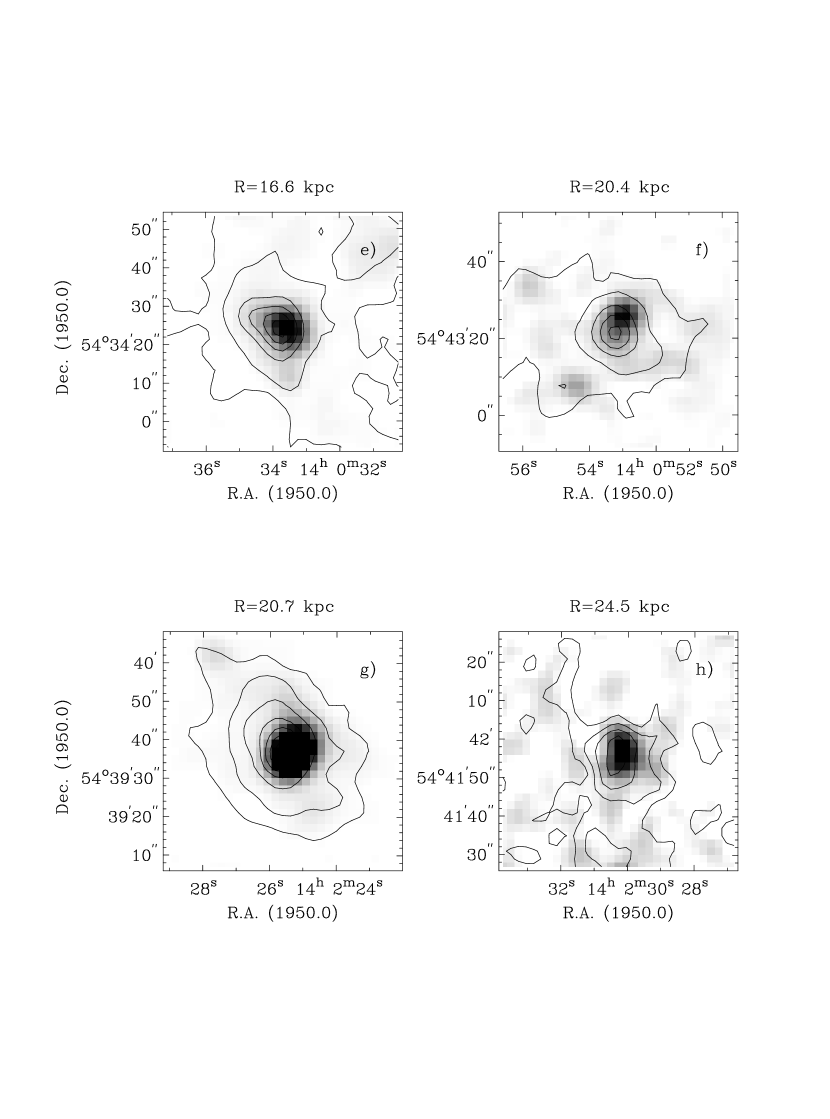
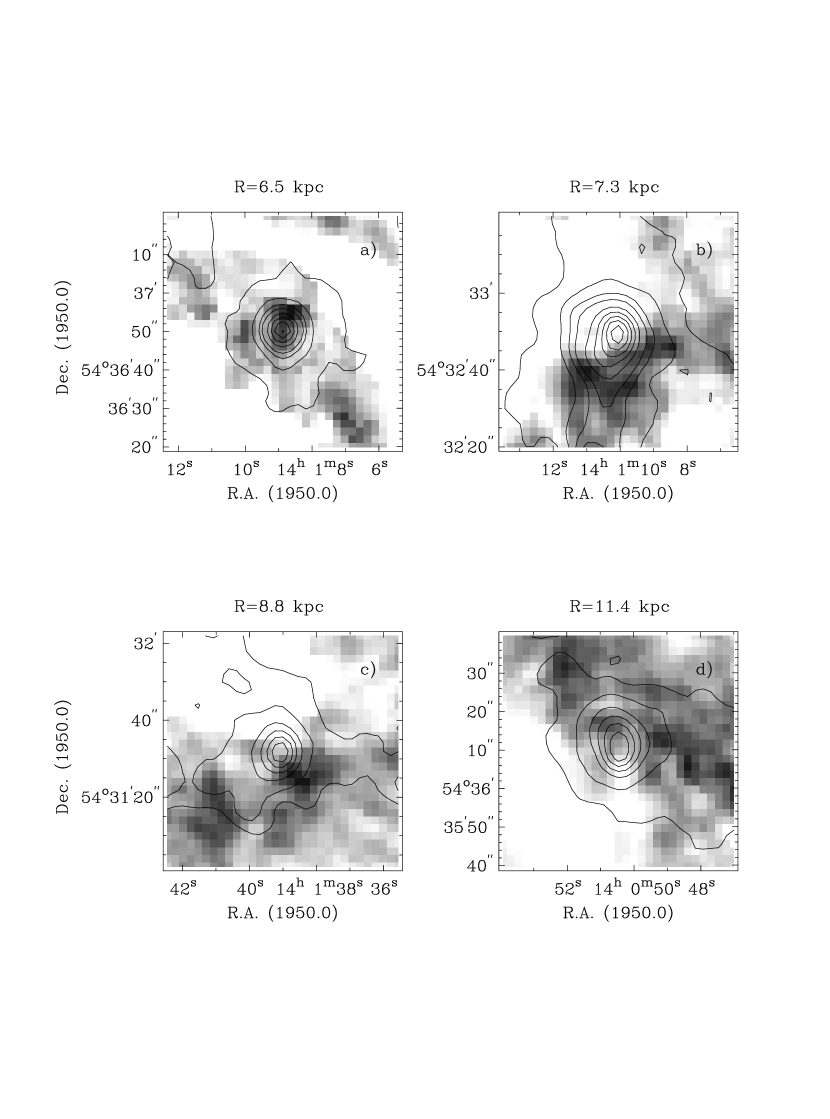
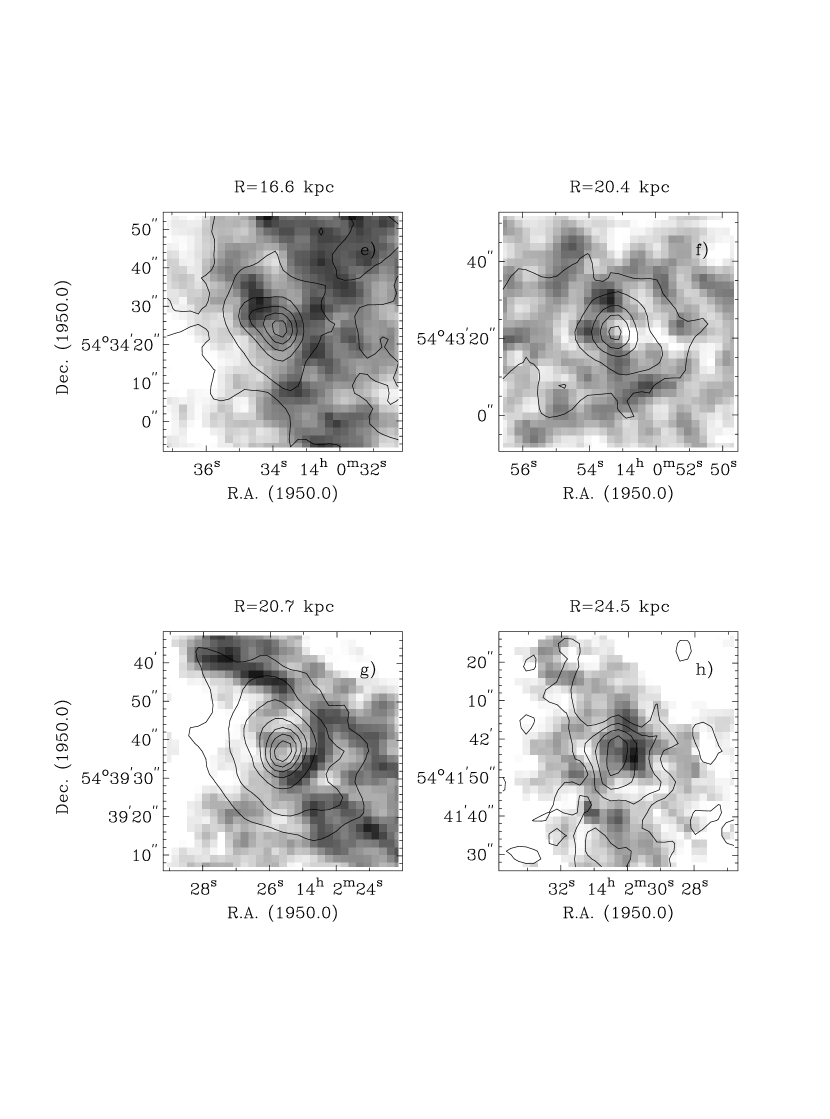
We have used the UIT data to select a group of candidate PDRs for further study. Of the FUV–bright sources, we identified 35 regions for which 1) the total FUV flux and 2) the distance between the FUV source and the peaks of the associated 21 cm line emission could be reliably measured. The selected sources are therefore relatively isolated and in areas containing detectable HI . The primary selection criterion is in fact confusion, as 95% of the rejections were based upon the presence of another significant FUV source within (540 pc). Two sources were rejected due to a lack of 21 cm emission within a radius of ; one additional source was rejected due to the weakness of the HI emission. The locations of the 35 selected regions are shown in Figure 7. The regions are classified into two subsets according to the intensity of the FUV flux seen by the neighboring HI clouds. The HI column density is directly related to in the photodissociation picture (see Section 3.4). Regions in Figure 7 marked with small square boxes are characterized by a narrow range of such that . These regions represent a set of “standard UV fluxes.” Regions designated by open circles have FUV fluxes outside of this range. The FUV, H, and HI morphologies of typical candidate PDRs are illustrated in Figures 8 through 10.
The quantity is given by , where ergs cm-2 s-1 Å-1 is the solar neighborhood value at 1500 Å (A97, and references therein), is the total FUV flux observed by UIT in , is the distance between the FUV source and the peak of the neighboring HI emission in parsecs, and is the adopted distance to M101 (in parsecs). The value of is based upon the values of the local interstellar radiation field given by Draine (1978) and illustrated in Figure 1 of Van Dishoeck & Black (1988). The solar neighborhood value varies weakly over the wavelength range of the UIT B1 filter; the adopted value of would change by less than 10% if we were to convolve the Draine (1978) curve with the UIT B1 filter profile.
The measurements of and , the associated column density, are dependent upon the morphology of the source. As seen in Figure 10, multiple patches of 21 cm emission neighbor each source. Each patch serves as an equally valid probe of the surrounding ISM. We determine by calculating the average HI surface brightness in successive annuli for each PDR. The annuli are centered upon the FUV source. The quantity is defined as the radius at which the surface brightness profile first reaches a local maximum. To measure the associated column density, , we identify the brightest patch of 21 cm line emission located at a distance from the FUV source. The adopted value of corresponds to the brightest pixel within the patch. The distance between the brightest pixel and the FUV source is always within 0.5 pixels of . This measurement of is preferred to the average value of obtained from the surface brightness profiles since the annuli include regions lacking 21 cm line emission. The average values therefore underestimate the column densities in the local ISM.
The measurements of , , , and for each region are listed in Table 2 and displayed in Figures 12 through 15 respectively. Filled circles represent the regions with . The values of the sky background and any surrounding diffuse FUV emission have been removed from the measurements of . This is accomplished by measuring the average FUV surface brightness in successive annuli centered on the FUV source. The amount of diffuse sky background per unit area is measured at the radius at which the FUV surface brightness levels off in the resulting radial profile. This value is subtracted from the total FUV flux contained within this radius. The FUV fluxes (Figure 12) vary by a factor of 100, but show no clear radial trend. With regard to the correspondence between the FUV and HI emission, Figures 10 and 13 show many cases in which the small–scale HI emission is slightly offset from or surrounds a FUV peak. Roughly half (16/35) of the FUV sources display an enhancement in the HI emission within 250 pc. For another 16 sources, the separation between the FUV and HI peaks ranges from 250 pc to pc. While the photodissociation scenario suggests that the HI enhancements are associated with the FUV emission, we remind the reader that other interpretations of the data may be valid, and that the observed morphology may simply reflect the general distribution of HI enhancements in M101. The HI enhancements for the remaining 3 sources are fairly distant from the FUV sources ( pc) and may not be associated with the FUV source. The values of do not display a significant radial trend (Figure 13). The resulting values of cover a large range (Figure 14), with no obvious trends with radius in the data. Values of represent the peak column density associated with each source. Figure 15 indicates that the values of cover a wide range and tend to increase with increasing radius. This situation reflects the central deficit of 21 cm line emission in M101, a feature which is commonly observed in galaxies.
Finally, the projected separation between the FUV and H sources () is given (Figure 16) in order to further quantify the effects of extinction discussed in §3.1. The majority of the FUV sources (85%, 30/35) have an H counterpart located within (215 pc; the FWHM of the HI image), as seen in Figure 16. Of the remaining sources, 4 have H emission which is slightly offset (215 pc 315 pc). The remaining FUV source lacks an obvious nearby H counterpart, with the nearest H source located over 600 pc away. This source may be an older star forming region. The separation between the FUV and H emission is independent of the distance from the center of M101.
3.4 The Quantitative Link Between the FUV and the HI
The column density of HI produced in a PDR is fundamentally linked to the amount of far–ultraviolet (FUV) emission incident upon it and the local molecular gas volume density. The production of HI is calculated with the same physics as the production of the H2 near–infrared emission lines by fluorescence. Following e.g. Sternberg (1988),
| (1) |
where
| = | the HI column density, | |
| = | the effective grain absorption cross section per H nucleus, | |
| = | the average unattenuated photodissociation rate, | |
| = | the formation rate coefficient, | |
| = | the FUV intensity relative to the local ISRF, and | |
| = | the total volume density of the gas. |
The quantity is a dimensionless function of , the absorption self–shielding function , and the column density of molecular hydrogen :
becomes constant for large values of due to self–shielding (Sternberg, 1988).
Our analysis ignores the ionized component of the HI , which is produced by photons of higher energy ( eV) than those we measure ( eV). If such photons are present in the flux impinging on the molecular cloud, then some of the HI would disappear into HII and we would be underestimating . However, in general both the PDR models and the highest-resolution observations in the Galaxy (e.g. figures 3 and 30 in Hollenbach & Tielens (1999)) show that most of the HII appears closer to the exciting stars than does the HI , so any correction ought to be small.
Equation 1 is strongly dependent upon the dust–to–gas ratio () and weakly dependent upon the gas temperature (), since
where and refer to values in the solar neighborhood, and represents the efficiency of H2 formation. The product is likely to be constant to within a factor of 2 (Hollenbach et al., 1971).
Equation 1 also contains a dependence upon the level of obscuration in the immediate vicinity of the FUV source. While the variable represents the intrinsic FUV flux associated with the star-forming region, we generally observe an attenuated FUV flux. Assuming any extinction associated with the star-forming region is in the form of an overlying screen of optical depth , . Since the ISM in the immediate vicinity of the FUV source will have been disturbed by stellar winds and any prior supernovae, we do not attempt to link , the local obscuration of the FUV source at 1500 Å, to that implied by , the larger-scale dust–to–gas ratio.
Assuming solar neighborhood values of cm2, s-1, cm3 s-1, and (Sternberg, 1988), and neglecting the weak temperature dependence of , equation 1 becomes:
| (2) |
where .
The behavior of as a function of is displayed for , and , , and in Figure 17. (These values of and are appropriate for the outer regions of M101, as discussed in Section 3.5.) Values of cm-2 are not likely to be observed as the atomic gas probably becomes optically thick at this point:
for spin temperatures of K and profile FWHMs of km s-1 typical of M101 (Braun, 1997), and for optical depths of , corresponding to a ratio between the brightness and kinetic temperatures of . This value is appropriate for the highest-brightness regions of M101, as indicated in Figure 8a of Braun (1997). Figure 17 also shows the measurements for each of the 35 candidate PDRs. The data indicate that the properties of observed regions in M101 are consistent with photodissociation of an underlying molecular gas of moderate volume density.
3.5 The Volume Density
Equations 1 and 2 also suggest that our measurements of the HI column density and the FUV emission may be used to estimate the molecular gas density in M101. Solving for the volume density of the gas yields:
| (3) |
for and .
This method provides a new probe of the molecular gas volume density with several advantages, including: 1) the method is independent of the CO/ conversion factor, 2) the FUV emission can be directly measured from the UIT data, 3) the 21 cm line emission is insensitive to the excitation conditions in the ISM. The main disadvantages are: 1) the results are strongly dependent on the value of , which will vary throughout the galaxy, 2) the relationships contain a weak dependence on the gas temperature which is not yet well understood, 3) the amount of extinction affecting the FUV fluxes must be evaluated, and 4) the observed values of N(HI ) represent upper limits since the unknown geometry of the individual PDRs prohibits inclination corrections. This method is also biased towards regions where significant amounts of gas are present, i.e. regions which are massive enough to have formed some dozens of O–B stars in the last 10–100 years.
3.5.1 The Dust–to–Gas Ratio
Values of derived from the data in Table 2, assuming a constant Milky Way dust–to–gas ratio and no extinction () are also given in Table 2 as . These values suggest that the volume density of the gas may decrease as a function of radius. However, the metallicity in M101 also changes strongly with radius (e.g. Kennicutt & Garnett (1996) and references therein). Since metal–rich regions also tend to be dustier, the observed radial trend in volume density most likely reflects a change in the dust–to–gas ratio.
To investigate this possibility, a measure of the dust–to–gas ratio is needed. Following Issa et al. (1990) and Schmidt & Boller (1993), we assume that is directly proportional to the metallicity, as traced by the oxygen abundance. Radial profiles of the quantity for M101 are given in Kennicutt & Garnett (1996) for different values of the calibration between the ([OII ] [O III ] abundance parameter and oxygen abundance. The radial profiles appear to be linear for the Dopita & Evans (1986) and McCall et al. (1985) calibrations or to steepen somewhat in the central regions for the Edmunds & Pagel (1984) calibration. In the rest of the paper, we refer to the metallicity gradients in terms of the calibration source, but remind the reader that the gradients all refer to the Kennicutt & Garnett (1996) data. Figure 18 shows the range of radial dependence of the dust–to–gas ratio for M101. Values of derived using dust–to–gas ratios based upon the Edmunds & Pagel type metallicity gradient are shown in Figure 19. This figure shows values increasing from cm-3 in the central star forming regions of M101 to cm-3 in the periphery of the galaxy. The trend is similar for the Dopita & Evans or the MRS type metallicity gradients, although slightly lower values are obtained ( cm-3 to cm-3). Values of derived using an average of the Dopita & Evans and MRS type metallicity gradients are shown in Figure 20.
3.5.2 Obscuration Effects
The discussion up to this point has assumed that extinction effects in these FUV–bright regions are negligible, based upon the fact that the clear majority of H sources have FUV counterparts. Studies of FUV–bright regions in M81 and M51 suggest that such regions are still obscured by dust with optical depths ranging from to (Hill et al., 1995, 1997), however. These values would translate to non–negligible reddenings of at least 1 to 9 magnitudes at 1500 Å. We use the H and H measurements of Scowen et al. (1992) to apply an extinction correction to our values of . These authors find that the central regions of M101 are characterized by higher optical depths than the outer regions, consistent with the general behavior of the dust–to–gas ratio. Based upon the scatter plot of optical depths in Figure 3 of Scowen et al., we adopt a radial profile of the optical depth of the form , where is the radius, for kpc, and for kpc. These values provide a lower limit to the required extinction corrections, as radio observations of HII regions in M101 indicate that optical depths derived from optical H/H line ratios only trace a fraction of the total optical depth in those regions (Viallefond et al., 1982). The ensuing extinction–corrected values of are shown in Figure 21 for the Savage & Mathis (1979) extinction curve () and Edmunds & Pagel (1984) type metallicity gradient. Even higher volume densities (approaching cm-3 in the central regions) are obtained with the Kinney et al. (1994) extinction curve. Figure 22 shows extinction–corrected values of for the Savage & Mathis (1979) extinction curve and the average of the Dopita & Evans and MRS type metallicity gradients.
These calculations use corrections based upon averaged extinction and dust–to–gas values; the volume densities could be further constrained by obtaining data on the specific optical depths and dust–to–gas ratios of the specific 35 candidate PDRs in our study.
4 Discussion and Conclusions
Figures 21 and 22 are our current best estimates for the radial dependence of the total gas volume density in M101. This gas should be essentially all . In the process of correcting the “raw” values of volume density (Table 2) for the radial variations of dust-to-gas fraction (resulting in Figures 19 and 20) and UV extinction (finally producing Figures 21 and 22), the radial variations have disappeared. The molecular gas shows a surprisingly narrow range of values from 30 - 1000 molecules cm-3 for the Edmunds & Pagel type metallicity gradient, with no clear trend from the inner HI –deficient regions near kpc, through the HI –rich “main body” of the galaxy near kpc, all the way out to the HI –poor outer parts at kpc. We note that the Edmunds & Pagel type metallicity gradient is a good representation for the mean of an ensemble of nearby galaxies (Panagia, 2000), which leads us to favor Figure 21 as the most likely final result.
One concern is that the narrow range of values in Figure 21 could result from observational selection. For example, regions of high volume density located near typical FUV sources may be missed since the HI would have a relatively low column density and a low filling factor. This is not an issue for this study since only 3% of our initial sample of FUV sources were rejected due to a lack of 21 cm line emission. To confirm this statement, we examined an additional 10 distinct FUV sources. Measurable HI is found within 800 pc for all ten sources. This is consistent with the spatial correlation between FUV sources and 21 cm line emission observed in Figures 2, 4, and 6. Virtually all FUV sources are associated with 21 cm line emission, with the exception of the innermost regions of M101, where the HI column density is supressed due to the strong increase in the dust-to-gas ratio.
What kind of observational selection could operate on the low-density side of Figure 21? According to Equation 1, with low volume density can produce large columns of HI which may become optically thick, leading us by Equation 3 to overestimate the density and thus depopulate the lower part of Figure 21. However, gas of density e.g. cm-3 with HI columns in the optically-thick regime of N(HI ) cm-2 would be typically pc in size. Examination of Figure 2 and the zoomed Figures 4 and 6 shows that the highest-brightness HI regions are unresolved, however. NGC 5447 in Figure 6 is a good example of this, as are NGC 5461 and NGC 5462 in Figure 4. This means the path lengths are pc, which implies values of N(HI ) cm-2 in Figure 17, where optical depth in the HI is not likely to be a problem. Therefore, the paucity of points at low volume densities in Figure 21 is very likely real.
We conclude that the 35 regions studied do indeed comprise a representative sample of PDRs, and that observational selection is not likely to be the cause of the narrow range of values for () in Figure 21.
Our results refer only to the ISM in the immediate vicinities of young stars and clusters of young stars. We do not know from the present observations if the results are representative of the ISM as a whole. Furthermore, the measurement of the HI emission does not immediately provide a total gas mass without additional assumptions about the geometry of the ISM since the HI emission is a surface phenomenon in the PDR picture. Further discussion of the implications of our results for the ISM content of galaxies in general is beyond the scope of this paper; we hope to return to these questions in a future publication.
Walterbos & Braun (1996) have proposed an interpretation for the radial distribution of the bright HI peaks in M101 and other nearby spirals in terms of variations in the hydrostatic pressure of the ISM. Their picture is insightful and deserves a more thorough discussion in the light of the present results than space here permits.
UV photons clearly dominate the physics of the ISM in the immediate neighborhoods of young stars. The production of HI from by photodissociation is a natural and inevitable consequence of this physics. We have described how photodissociation can explain the geometrical structure of the HI on scales of pc in nearby galaxies and have discussed how the physics of photodissociation can be used to provide a new probe of the density of the underlying molecular hydrogen. In addition, we have presented a straightforward explanation for the disappearance of HI in the inner parts of galaxies. Acceptance of this picture requires a shift in parts of the paradigm for star formation from the ISM, from viewing HI as a precursor, to seeing it as a product of the star formation process. While the present results do not by themselves demand discarding the old paradigm, they further strengthen the viability of the new one.
References
- Allen (1996) Allen, R.J. 1996, in “New Extragalactic Perspectives in the New South Africa”, eds. D.L. Block & J.M. Greenberg (Kluwer; Dordrecht), 50
- Allen et al. (1985) Allen, R.J., Atherton, P.D., & Tilanus R.P.J. 1985, in “Birth and Evolution of Massive Stars and Stellar Groups”, eds. W. Boland & H. van Woerden (Dordrecht; Reidel), 243
- Allen et al. (1986) Allen, R.J., Atherton, P. D., & Tilanus, R. P. J. 1986, Nature, 319, 296
- Allen et al. (1997) Allen, R.J., Knapen, J. H., Bohlin, R., & Stecher, T. P. 1997, ApJ, 487, 171 (A97)
- Braun (1995) Braun, R. 1995, A&AS, 114, 409
- Braun (1997) Braun, R. 1997, ApJ, 484, 637
- Combes (1999) Combes, F. 1999, in “H2 in Space”, ed. F. Combes & G. Pineau des Forêts (Cambridge University Press), in press
- Dopita & Evans (1986) Dopita, M.A., & Evans, I.N. 1986, ApJ, 307, 431
- Draine (1978) Draine, B.T. 1978, ApJS, 36, 595
- Edmunds & Pagel (1984) Edmunds, M.G., & Pagel, B.E.J. 1984, MNRAS, 211, 507
- Elmegreen (1995) Elmegreen, B.G. 1995, in “Molecular Clouds and Star Formation”, eds. Chi Yuan & Junhan You (Singapore; World Scientific), 149
- Elmegreen (1993) Elmegreen, B.G. 1993, in “Protostars and Planets III”, eds. E.H. Levy & J.I. Lunine (Arizona; Univ. Arizona Press), 97
- Goldsmith & Langer (1978) Goldsmith, P.F., & Langer, W.D. 1978, ApJ, 222,881
- Hill et al. (1995) Hill, J.K. et al. 1995, ApJ, 438, 181
- Hill et al. (1997) Hill, J.K. et al. 1997, ApJ, 477, 673
- Hodge et al. (1990) Hodge, P.W., Gurwell, M., Goldader, J. D., & Kennicutt, R.C. 1990, ApJS, 73, 661
- Hollenbach et al. (1971) Hollenbach, D.J., Werner, M.W., & Salpeter, E.E. 1971, ApJ, 163, 165
- Hollenbach & Tielens (1999) Hollenbach, D.J., & Tielens, A.G.G.M. 1999, Revs. Mod. Phys. 71, 173
- Hutchings (1982) Hutchings, J.B. 1982, ApJ, 255, 70
- Issa et al. (1990) Issa, M.R., MacLaren, I., & Wolfendale, A.W. 1990, A&A, 236, 237
- Kelson (1996) Kelson, D.D., et al. 1996, ApJ, 463, 26
- Kennicutt (1998) Kennicutt, R.C. 1998, ApJ, 498, 541
- Kennicutt & Garnett (1996) Kennicutt, R.C., & Garnett, D.R. 1996, ApJ, 456, 504
- Kinney et al. (1994) Kinney, A.L., Calzetti, D., Bica, E., & Storchi–Bergmann, T. 1994, ApJ, 429, 172
- Knapen & Beckman (1994) Knapen, J.H., & Beckman, J.E. 1994, in “Physics of the Gaseous and Stellar Disks of the Galaxy”, ed. I. King (San Francisco; ASP), 329
- Knapen & Beckman (1996) Knapen, J.H., & Beckman, J.E. 1996, MNRAS, 283, 251
- Knapen et al. (1992) Knapen, J.H., Beckman, J.E., Cepa, J., van der Hulst, J.M., & Rand, R.J. 1992,ApJ, 385, L37
- Laurent et al. (1999) Laurent, O., Mirabel, I. F., Charmandaris, V., Gallais, P., Vigroux, L., & Cesarsky, C. J. 1999, in “The Universe as seen by ISO”, ed.P. Cox & M.F. Kessler (Noordwijk; ESA), 913
- Luhman & Jaffe (1996) Luhman, M.L., & Jaffe, D.T. 1996, ApJ, 463, 191
- Madden et al. (1993) Madden, S.C., Geis, N., Genzel, R., Herrmann, F., Jackson, J., Poglitsch, A., Stacey, G.J., & Townes, C.H. 1993, ApJ, 407, 579
- McCall et al. (1985) McCall, M.L., Rybski, P.M., & Shields, G.A. 1985, ApJS, 57, 1 (MRS)
- Panagia (2000) Panagia, N. 2000, private communication
- Rand et al. (1992) Rand, R.J., Kulkarni, S.R., & Rice, W. 1992, ApJ, 390, 66
- Roberts (1969) Roberts, W.W. 1969, ApJ, 345, 372
- Roberts & Haynes (1994) Roberts, M.S., & Haynes, M.P. 1994, ARA&A, 32, 115
- Roussel, Sauvage, & Vigroux (1999) Roussel, H., Sauvage, M., & Vigroux, L. 1999, A&A, (submitted)
- Savage & Mathis (1979) Savage, B.D., & Mathis, J.S. 1979, ARA&A, 17, 73
- Schmidt & Boller (1993) Schmidt, K.-H., & Boller, T. 1993, Astron. Nachr., 314, 361
- Scowen et al. (1992) Scowen, P.A., Dufour, R.J., & Hester, J.J. 1992, AJ, 104, 92
- Shu (1997) Shu, F.H. 1997, in “21st Century Chinese Astronomy Conference”, eds. K.S. Cheng & K.L. Chan (Singapore; World Scientific), 21
- Solomon et al. (1983) Solomon, P.M., Barrett, J., Sanders, D.B., & de Zafra, R. 1983, ApJ, 266, L103
- Stecher & Williams (1967) Stecher, T.P., & Williams, D.A. 1967, ApJ, 149, L29
- Stecher et al. (1992) Stecher, T.P. et al. 1992, ApJ, 395, L1
- Stecher et al. (1997) Stecher, T.P. et al. 1997, PASP, 109, 584
- Sternberg (1988) Sternberg, A. 1988, ApJ, 332, 400
- Tielens et al. (1993) Tielens, A.G.G.M., Meixner, M.M., van der Werf, P.P., Bregman, J., Tauber, J.A., Stutzki, J., & Rank, D. 1993, Science 262, 86.
- Tilanus & Allen (1987) Tilanus, R.P.J., & Allen, R.J. 1987, in “Star Formation in Galaxies, ed. C.J. Lonsdale Persson (NASA CP-2466), 309
- Tilanus et al. (1988) Tilanus, R.P.J., Allen, R.J., van der Hulst, J.M., Crane, P.C., & Kennicutt, R.C. 1988, ApJ, 330, 667
- Tilanus & Allen (1989) Tilanus, R.P.J., & Allen, R.J. 1989, ApJ, 339, L57
- Tilanus & Allen (1990) Tilanus, R.P.J., & Allen, R.J. 1990, in “The Interstellar Medium in External Galaxies: Summaries of Contributed Papers”, eds. D.J. Hollenbach & H.A. Thronson, Jr. (NASA CP-3084), 298
- Tilanus & Allen (1991) Tilanus, R.P.J., & Allen, R.J. 1991, A&A, 244, 8
- Tilanus & Allen (1993) Tilanus, R.P.J., & Allen, R.J. 1993, A&A, 274, 707
- Van Dishoeck & Black (1988) van Dishoeck, E.F., & Black, J.H. 1988, ApJ, 334, 771
- Van Zee et al. (1998) van Zee, L., Salzer, J.J., Haynes, M.P., O’Donoghue, A.A., & Balonek, T.J. 1998, AJ, 116, 2805
- Viallefond et al. (1981) Viallefond, F., Allen, R.J., & Goss, W.M. 1981, A&A, 104, 127
- Viallefond et al. (1982) Viallefond, F., Goss, W.M., & Allen, R.J. 1982, A&A, 115, 373
- Vigroux et al. (1999) Vigroux, L., Charmandaris, P., Gallais, P., Laurent, O., Madden, S., Mirabel, F., Roussel, H., Sauvage, M., & Tran, D. 1999, in “The Universe as seen by ISO”, ed.P. Cox & M.F. Kessler (Noordwijk; ESA), 805
- Vogel et al. (1988) Vogel, S.N., Kulkarni, S.R., & Scoville, N.Z. 1988, Nature, 334, 402
- Waller et al. (1997) Waller, W.H. et al. 1997, ApJ, 481, 169
- Walterbos & Braun (1996) Walterbos, R.A.M., & Braun, R. 1996, in “The Minnesota Lectures on Extragalactic Neutral Hydrogen”, ed. E. Skillman (San Francisco; ASP), 1
- Williams & Maddalena (1996) Williams, J.P., & Maddalena, R.J. 1996, ApJ, 464, 247
- Witt et al. (1989) Witt, A.N., Stecher, T.P., Boroson, T.A., & Bohlin, R.C. 1989, ApJ, 336, L21
- Young & Knezek (1989) Young, J.S., & Knezek, P.M. 1989, ApJ, 347, L55


| Hodge Number | RA (1950) | Dec (1950) |
|---|---|---|
| 888 | ||
| 891 | 14 1 38.3 | 35 46.5 |
| 939 | 14 1 40.5 | 35 10.8 |
| 979 | 14 1 42.4 | 36 4.8 |
| 1117 | 14 1 56.9 | 33 44.2 |
| 1122 | 14 1 58.4 | 34 0.1 |
| 1126 | 14 1 58.9 | 34 7.0 |
| RA | Dec | Radius | aaVolume densities derived using the (unrealistic) case of . | bbVolume densities derived using the Edmunds & Pagel metallicity gradient and Savage & Mathis extinction law. | |||||
|---|---|---|---|---|---|---|---|---|---|
| (1950) | (1950) | (kpc) | () | (pc) | (atoms cm-2) | (pc) | (cm-3) | (cm-3) | |
| 2.5 | 359. | 0.48 | 225. | 76. | 2047. | ||||
| 14 1 13.93 | 54 36 24.9 | 4.7 | 682. | 0.05 | 110. | 2.6 | 49. | ||
| 14 1 42.47 | 54 34 52.9 | 5.0 | 144. | 6.03 | 109. | 18. | 116. | ||
| 14 1 12.11 | 54 33 58.9 | 5.3 | 144. | 1.53 | 107. | 28. | 443. | ||
| 14 1 31.43 | 54 37 52.9 | 5.9 | 430. | 0.71 | 106. | 2.8 | 33. | ||
| 14 1 26.37 | 54 32 16.9 | 6.4 | 502. | 1.17 | 168. | 18. | 322. | ||
| 14 1 08.87 | 54 36 50.9 | 6.5 | 161. | 5.74 | 147. | 30. | 482. | ||
| 14 1 47.07 | 54 34 32.8 | 6.6 | 201. | 4.85 | 147. | 14. | 216. | ||
| 14 1 13.24 | 54 37 48.9 | 6.9 | 201. | 2.35 | 167. | 24. | 454. | ||
| 14 1 10.04 | 54 32 50.9 | 7.3 | 359. | 2.98 | 314. | 1.5 | 29. | ||
| 14 1 39.00 | 54 31 32.9 | 8.9 | 215. | 3.89 | 240. | 0.68 | 39. | ||
| 14 0 58.07 | 54 34 30.7 | 9.0 | 201. | 1.71 | 110. | 17. | 429. | ||
| 14 1 55.57 | 54 33 24.7 | 9.9 | 287. | 8.01 | 118. | 0.0059 | 4. | ||
| 14 1 37.89 | 54 39 50.9 | 10.5 | 72. | 64.38 | 120. | 15. | 1604. | ||
| 14 2 02.25 | 54 34 18.6 | 11.3 | 144. | 3.22 | 74. | 0.79 | 106. | ||
| 14 1 56.54 | 54 38 10.7 | 11.3 | 144. | 3.50 | 126. | 0.19 | 53. | ||
| 14 0 50.46 | 54 36 10.6 | 11.4 | 395. | 2.02 | 114. | 0.19 | 42. | ||
| 14 1 55.40 | 54 38 44.7 | 11.7 | 305. | 0.33 | 144. | 0.30 | 23. | ||
| 14 2 11.26 | 54 36 48.4 | 14.3 | 108. | 7.28 | 77. | 0.26 | 120. | ||
| 14 1 14.89 | 54 28 46.9 | 14.4 | 359. | 6.24 | 106. | 0.53 | 140. | ||
| 14 0 33.69 | 54 34 24.2 | 16.6 | 305. | 2.33 | 80. | 0.068 | 53. | ||
| 14 0 34.20 | 54 32 12.2 | 17.6 | 215. | 7.27 | 90. | 0.14 | 191. | ||
| 14 0 34.08 | 54 37 38.2 | 17.2 | 108. | 5.35 | 131. | 0.11 | 127. | ||
| 14 0 25.65 | 54 34 02.0 | 19.2 | 610. | 0.13 | 139. | 0.12 | 16. | ||
| 14 0 24.30 | 54 32 53.9 | 20.1 | 72. | 12.10 | 145. | 3.2 | 1172. | ||
| 14 0 53.12 | 54 43 22.7 | 20.4 | 287. | 2.54 | 142. | 0.12 | 164. | ||
| 14 2 25.61 | 54 39 38.1 | 20.7 | 287. | 6.96 | 111. | 0.70 | 581. | ||
| 14 0 40.94 | 54 28 02.4 | 21.1 | 161. | 2.14 | 100. | 0.88 | 284. | ||
| 14 0 29.87 | 54 40 34.1 | 21.1 | 610. | 0.60 | 640. | 6.7 | 266. | ||
| 14 1 56.62 | 54 44 14.7 | 21.5 | 466. | 0.11 | 139. | 0.24 | 26. | ||
| 14 0 22.74 | 54 30 49.9 | 22.1 | 395. | 0.20 | 142. | 1.7 | 91. | ||
| 14 2 30.28 | 54 41 57.9 | 24.5 | 161. | 1.83 | 196. | 0.41 | 392. | ||
| 14 1 50.63 | 54 46 06.8 | 24.6 | 287. | 0.99 | 188. | 0.22 | 212. | ||
| 14 2 43.54 | 54 38 05.4 | 24.7 | 251. | 32.41 | 17. | 0.028 | 2466. | ||
| 14 1 05.56 | 54 46 40.8 | 25.5 | 251. | 0.67 | 268. | 0.0049 | 85. |