Using Slitless Spectroscopy to study the Kinematics of the Planetary Nebula Population in M94
Abstract
The planetary nebula populations of relatively nearby galaxies can be easily observed and provide both a distance estimate and a tool with which dynamical information can be obtained. Usually the requisite radial velocities are obtained by multi-object spectroscopy once the planetary nebulae have been located by direct imaging. Here we report on a technique for measuring planetary nebula kinematics using the double-beam ISIS spectrograph at the William Herschel Telescope in a novel slitless mode, which enables the detection and radial velocity measurements to be combined into a single step. The results on our first target, the Sab galaxy NGC 4736, allow the velocity dispersion of the stellar population in a disk galaxy to be traced out to four scale lengths for the first time and are consistent with a simple isothermal sheet model.
keywords:
galaxies: individual: M94, N4736 – galaxies: kinematics and dynamics – instrumentation: spectrographs – planetary nebulae: general – techniques: radial velocities1 Introduction
The outer kinematics of galaxies have played a crucial role in our understanding of their structure. The dark matter halos are most important there, so that conclusions about their shape, mass and extent may be drawn that are less dependent on assumed mass-to-light ratios of the observed stars. Most of the angular momentum resides at large radii, and relaxation times are longest there, possibly enabling echos of the formation process to be observed directly. However, the required observations are rather difficult. The integrated stellar light of a galaxy rapidly becomes too weak at large radii to do spectroscopy. In the case of elliptical galaxies, the old stellar populations have now in a few cases been probed as far as two effective radii (e.g., Carollo et al. 1995; Gerhard et al. 1997).
Some tracers, such as globular clusters and H i emission, can be observed at larger radii, but neither provides a reliable tracer of the kinematics of the relaxed, old stellar population. Moreover systems like S0s and ellipticals generally lack an extensive gaseous disk. Fortunately an alternative tracer of the kinematics out to large radii has been identified by Hui et al. (1993), who showed that the radial velocities of a galaxy’s planetary nebula (PN) population constitute a suitable diagnostic. Planetary nebulae (PNe) appear in the post-main sequence phase of stars in the range 0.8 - 8 M⊙. Fortunately, in all but the very youngest of systems the PN population is strongly correlated with the older, and therefore dynamically relaxed, population of low-mass stars. This statement is true not only because of the statistics of stellar formation and evolution, but also because the PN lifetime is itself a strongly decreasing function of progenitor mass (Vassiliadis & Wood 1994).
PNe emit almost all of their light in a few bright emission lines, particularly the [O iii] line at 5007Å. There is evidence that the PN [O iii] luminosity function is essentially constant with galaxy type and metallicity (Jacoby et al 1992), so that the observed bright-end cutoff magnitude (Ciardullo et al 1989) represents a ‘standard candle’ with which distances can be determined. At a distance of 10 Mpc, this cutoff corresponds to a flux of erg cm-2s-1, making PNe within one dex of this limit easily detectable in one night with a 4-m telescope. As a rule of thumb, approximately 100 such PNe are found to be present per L⊙ of B-band luminosity (Hui 1993), so they are seen in sufficient number to study the kinematics of the stellar population of the host galaxy.
The usual approach in making such kinematic studies has been to identify the PN population by narrow-band imaging and then to re-observe the detected PNe spectroscopically to obtain radial velocities. However, other strategies exist that avoid the need for several observing runs. For example, Tremblay et al. (1995) used Fabry-Perot measurements in a PN kinematics study of the SB0 galaxy NGC 3384. In this paper, we describe a novel alternative, based on slitless spectroscopy, and discuss its application to the Sab galaxy M94.
2 Detection and Kinematics of PNe through Slitless Spectroscopy
Our method for obtaining the kinematics of PNe is outlined in Figure 1. The galaxy under study is imaged through narrow-band filters around the two strongest emission lines in a typical PN spectrum, H and [O iii]. The H image is recorded directly, but the [O iii] light is dispersed. Comparison of the dispersed and undispersed images then allows the kinematics of the PNe to be measured, without prior knowledge of the location of the PNe. Two modes of analysis are possible:
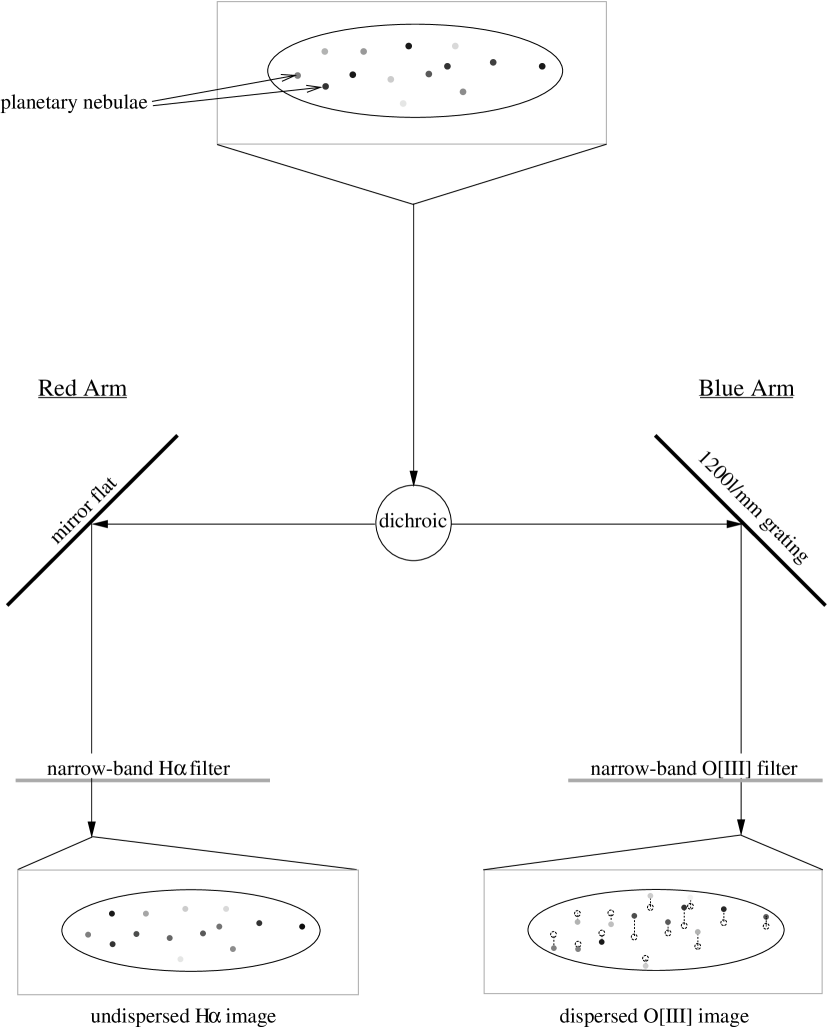
Dispersed/Undispersed Imaging (DUI): In the dispersed blue arm the
PNe will be visible through their [O iii] emission as point sources,
displaced from their ‘true’ positions by an amount related to their
radial velocity, against a background of dispersed galactic light. The
red arm will detect the PNe through their H emission, along with
any other objects with line or continuum emission in the pass band of
the filter. Assuming that the PNe can be unambiguously identified in
the H image, their position in the [O iii] image will give
the radial velocity.
We chose to disperse the blue rather than the red
light since PN have a higher flux at [O iii] than at H, and
gratings are less efficient than mirrors.
Counter-Dispersed Imaging (CDI): The method of
counter-dispersed imaging was described in an earlier paper (Douglas
& Taylor 1999). In this mode, pairs of dispersed [O iii] images are
made with the entire spectrograph rotated by 180 degrees between
exposures. The difference in the position of a given PN in the two
dispersed images again reflects its radial velocity. In this case the
undispersed H image can be used as a consistency check on the
derived positions of the PNe.
We have implemented our method on the ISIS medium-dispersion spectrograph at the Cassegrain (f/10.94) focus of the 4.2m William Herschel Telescope. The slit unit was removed during the observations, and the [O iii] and H light paths were separated with a dichroic before being passed through appropriate narrow-band filters. The filters (5026/47 and 6581/50) were custom-made for this project in order to exploit the full arcmin field of the instrument in slitless mode, and to give adequate velocity coverage. We used a 1200 g/mm (first order) grating in the blue arm. Both arms contained 10242-pixel Tek CCD detectors. Thus, we obtained dispersed images in the blue (calibration showed the dispersion to be about 24 km s-1 per pixel) and simultaneous direct images in the red. DUI observations are accomplished in a single exposure; CDI requires two exposures.
The overall efficiency of this setup, including telescope, instrument, filter and CCD, was found from observations of a standard star (Feige 34) to be 14% in the blue and 20% in the red for air mass of 0. We therefore expected to detect [O iii] photons per second from the brightest PN when viewed at 6 Mpc. Dark sky (V=21.4) would produce 2 counts per arcsec2 per second, and the background light of the galaxy 1–5 counts per arcsec2. A reasonable goal is to obtain a 4 detection of the PN population over the top decade (2.5 mag) of the luminosity function. This requires 4 hours of integration if the seeing conditions are of the order of one arcsec. The required integration time is approximately proportional to the square of the seeing.
3 Observations
The observations were carried out on 1997 April 11 and 12. For this pilot project NGC 4736 (M94) was chosen. It has a large angular size and is at a distance of 6 Mpc (Bosma et al 1977). The galaxy shows some peculiar morphological features, most notably an inner and an outer optical ring with radii of 1 and 5.5 arcmin respectively. The stellar light is too faint for direct optical spectroscopy outside 1 arcmin, and our goal was to measure PN kinematics to three times this radius. Key parameters of NGC 4736 are listed in Table 1, and the observing log is given in Table 2.
| Name | NGC 4736 (M94) | |
|---|---|---|
| Position (J2000) | 12h50m53.061s | |
| +41d07m13.65s | ||
| Hubble type | SA(r)ab | |
| VHelio | 308 1 km/s | |
| B | 8.99 | |
| Angular size | arcmin | |
| Inclination | 35 ∘ | |
| Scale length | 57 10 arcsec | |
| Position angle | 105∘ |
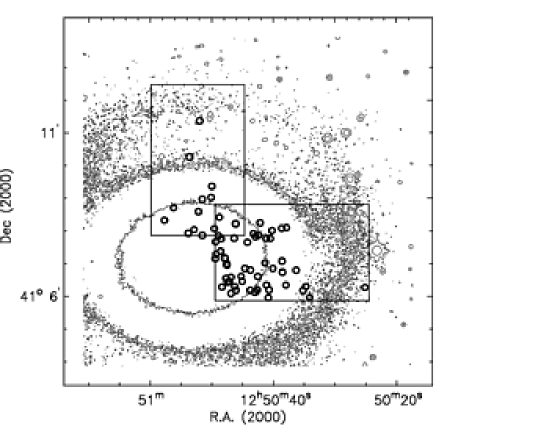
Two fields were observed, 3 arcmin west of centre on the major axis, and 3 arcmin north of centre on the minor axis. The major axis was observed at two orientations (allowing CDI mode) while the minor axis was observed in one orientation only. We took the major axis position angle to be 90∘, as would seem appropriate from the relevant isophotes (see Figure 3). Total integration times were 6.0hrs on the Western field (4.6hrs in one orientation, and 1.4hrs with the spectrograph rotated by 180 degrees), and 3hrs on the Northern field. The observing conditions were close to photometic with seeing, as judged from stellar images in the red arm, less than 1.1″ at all times. We also observed a flux standard star for photometry and a Galactic PN as a radial velocity reference. A second star was observed as a spectral reference.
The custom-made [O iii] and H filters had a central wavelength and peak transmission of 5026Å/0.823 and 6581Å/0.915, respectively. The nominal FWHM was 47Å and 50Å, while the effective photometic bandwidth was evaluated graphically and found to be 38.7Å and 45.7Å, respectively.
| Field | PA | T | UT | Airmass |
|---|---|---|---|---|
| April 11 | ||||
| HD66637 | 90 | 60 | 20:35 | 1.06 |
| Feige 34 | 90 | 2/10 | 21:15 | 1.07 |
| N4736 - major axis | 90 | 16,453 | 21:20 - 2:13 | 1.35 - 1.07 |
| PN 49+88.1 | 90 | 5 | 2:03 | 1.06 |
| N4736 - major axis | 270 | 4,868 | 2:36 - 4:52 | 1.12 - 1.54 |
| April 12 | ||||
| HD66637 | 90 | 0.1/10 | 20:29 | 1.06 |
| Feige 34 | 90 | 3/60 | 20:57 | 1.09 |
| N4736 - minor axis | 0 | 10,800 | 21:02 - 0:08 | 1.42 - 1.03 |
4 Data Reduction
4.1 Calibration
The dispersion in the blue arm was measured by inserting a slit and using an arc lamp, and found to be 0.3992Å/pixel. The spectrum of the star HD66637 was then observed through the same slit and wavelength-calibrated. Subsequent observations of the same star at numerous positions in the field (after removal of the slit) established that the dispersion could be taken as constant over the field. The combination of these observations with the undispersed red arm positions of HD66637 gave an unambiguous solution for the transformation between objects in the red (direct image) and blue (dispersed image). (Note that with this technique the radial velocity of the star does not enter into the calculation.)
To check the zero point of the velocity scale, we moved the telescope from the reference star to the Galactic planetary nebula PN 49.3+88.1, for which the heliocentric radial velocity is listed as km s-1 (Schneider et. al 1983). In ten pointings over the field of the spectrograph we measured km s-1, in agreement with the calculated observatory frame redshift of km s-1. Unfortunately we discovered later that at certain telescope orientations the flexure is large enough to cause significantly larger errors. However, such flexure only introduces an offset in absolute velocity, and does not compromise our ability to study a galaxy’s internal kinematics. In order to derive an absolute calibration for the velocity scale, we later obtained a long slit observation of two of the objects detected in this analysis (see § 5).
The spectrograph field of view with the slit unit removed consists of an approximately unvignetted area of about 4′ 1′, but we obtained useful data outside this region. Correcting the observed fluxes for the vignetting is only straightforward for the red (undispersed) arm. In the blue arm the correction is complicated by the fact that the image is dispersed. The sky flat measured in the blue arm was found to closely approximate the aperture function in the red arm, shifted by a small number of pixels, transformed to blue arm coordinates and then convolved with the filter profile at the appropriate dispersion.
We therefore carried out the complete analysis after correcting only for the pixel-to-pixel variation of the CCD responses, determined in the usual way. Once the PNe were identified it was possible to determine their wavelength and their positions in the aperture prior to being shifted by the spectrograph, so that the [O iii] magnitudes could then be corrected analytically both for the filter response, which was fitted with a polynomial, and for vignetting.
4.2 Object identification
Scripts based on IRAF procedures were used for all of the data reduction.
Due to spectrograph flexure, individual exposures needed to be aligned before being added. This was accomplished by a simple shift (at least one PN was visible in each individual exposure). The images were then combined by computing a weighted and scaled median. A spatial median filter was applied to the combined frame, and the result subtracted from the original image to yield a field of unresolved objects against a background with a mean of zero.
The PNe and any other point sources in the red and blue images were
extracted by two methods:
(A) Blinking and hand-tagging, followed
by a PSF-fitting step to evaluate the shape and size parameters.
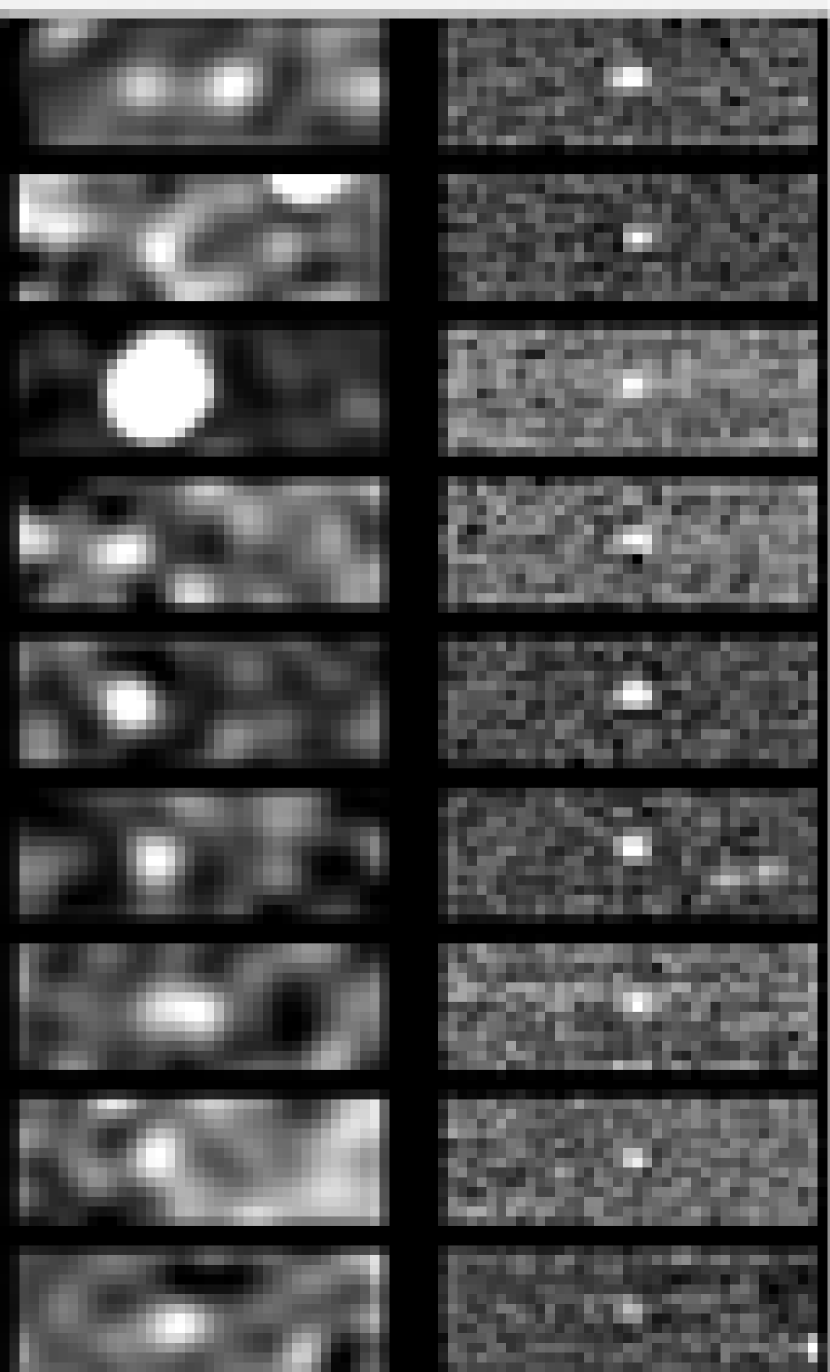
For DUI mode observing it was usually found to be easier to search
the range of possible (red) coordinates corresponding to an object
seen in the blue (see Fig. 2).
(B) an automated procedure based on object lists generated with
DAOPHOT. A 2D-gaussian fit to each detected image was used to select
PN candidates. The FWHM of a candidate was required to be within a small range
of that of the seeing disk (PNe are unresolved) and the axial ratio
close to the value 1.28 expected from our instrumental configuration
(the ellipticity arises from the anamorphic effect of the
grating). The object lists were then correlated to search for potential PN
image pairs.
4.3 False detections
As well as PNe, our observations will also detect other objects having a predominantly line-emission spectrum near the [O iii] line. In the case of a bright spiral galaxy like M94 it is obvious that H ii regions will mimick PNe. As they belong to a younger population than the PNe their inclusion in the analysis would lead to an underestimate of the velocity dispersion. Although it is tempting to use the [O iii]/H line ratio as a discriminant (it tends to be larger in PNe) this is not sharp enough to eliminate the H ii regions without eliminating a fair fraction of the PNe. Unless a better discriminant can be found, this source of contamination may ultimately restrict the viability of our technique to the elliptical and S0 galaxies for which it was devised. However in the particular case of M94 the problem is manageable because:
(i) M94 is sufficiently close that a large fraction of bright H ii regions would be spatially extended and thus eliminated by one of the object selection criteria; (ii) the H ii regions in M94 are mostly confined to features associated with spiral arms - one of these passes through the eastern extremity of our major axis field and all objects there were ignored. The rest of the field, and the minor axis field, are devoid of recognised H ii agglomerations; (iii) the total number of unresolved objects detected in [O iii] is close to the number expected for PNe on the basis of their luminosity specific density as seen in other galaxies.
None of these factors eliminates the problem entirely, but their combined effect is such that we feel that contamination is negligible. Even if 10% of the PNe had been misidentified the effect on the calculated velocity dispersion would be at most 5%, well below other sources of error.
High redshift galaxies, in which the Ly line is shifted into the [O iii] passband, form another potential source of contamination when long integrations are made of extended halos (Freeman et al. 1999). This is also not a significant issue in the present case.
4.4 Comparing Spectral Modes
We identified PNe in NGC 4736 along the minor axis with DUI mode observations and along the major axis using CDI (with DUI mode data being redundant). Although CDI requires two distinct integrations, we found that data obtained from CDI results in a higher number of detected PN per unit integration time. For visual identification using blinking, CDI is considerably easier since the two images have the same plate scale and similar properties with respect to sky noise and confusion. Therefore to illustrate the numerical superiority of using two dispersed [O iii] images we rely on the automated search results for the major axis observations only. 36 PNe were identified in this field from matching 2.5 sources in the counterdispersed [O iii] images. The limiting factor here was the shorter integration time with one of the two spectrograph orientations: had both integration times been equal we would presumably have found yet more PNe. By comparison, only 24 PNe were detected from the DUI mode analysis of the same field. Therefore, we conclude that a significant number of PNe are too faint in H for the DUI mode to detect them.
5 Long-slit data
It has been mentioned that instrument flexure, particularly between sets of observations in CDI mode, can lead to an uncertainty in the absolute velocity scale. To remove this uncertainty we attempted to obtain the velocity of at least one object in the major axis field via the Willian Herschel Telescope service data program. As the PNe are faint, with effective V-band magnitude of around 25, the slit had to be positioned ‘blind’ on the basis of the position computed from the dispersed data. Fortunately the astrometry does not depend on velocity, but only on correct identification of PN pairs, and on the centroiding of the dispersed images of stars in the field.
We requested a spectrum using ISIS in long-slit mode and with the slit at a position and PA chosen such as to fall across two objects. This provided a good test of the astrometry. The service observation was attempted on 1999 July 28. Both objects were acquired, and their separation along the slit agreed with that calculated. One of the objects, suspected of being an H ii region, was confirmed as such. The radial velocities obtained had an internal error of about 10 km s-1, as judged from the values obtained from different lines, and were used to calibrate the major axis data (Table 3).
6 Results
The PNe identified along the major axis are listed in Table 3 and those along the minor axis in Table 4. Their positions are also shown in Fig 3. As suggested by the successful long-slit experiment, the positional uncertainty is of the order of 1-2 arcsec. The internal error in the velocities is approximately 10 km s-1. The minor axis velocities have an offset that has not been determined, but the values as presented have an average velocity near systemic, as would be expected. The derivation of velocities from DUI mode data, as was used for the minor axis, is in fact much less sensitive to flexure. However, in order to reduce the number of candidate objects in the red image, only radial velocities between 200 and 500 km s-1 were searched for, so this table has to be used with caution.
| RA (J2000) | Dec (J2000) | Rvel | FWHM | |
|---|---|---|---|---|
| 12:50:49.46 | 41:07:09.5 | 459 | 23.44 | 3.52 |
| 12:50:49.42 | 41:07:40.3 | 472 | 23.18 | 3.59 |
| 12:50:49.35 | 41:07:17.5 | 463 | 23.48 | 3.31 |
| 12:50:48.93 | 41:07:51.2 | 483 | 22.54 | 3.29 |
| 12:50:48.62 | 41:07:22.9 | 444 | 23.18 | 3.31 |
| 12:50:48.40 | 41:06:17.3 | 309 | 24.80 | 3.24 |
| 12:50:48.53 | 41:07:45.8 | 450 | 24.63 | 3.54 |
| 12:50:47.97 | 41:07:10.8 | 508 | 25.46 | 3.9 |
| 12:50:47.87 | 41:07:09.8 | 378 | 25.78 | 2.79 |
| 12:50:47.73 | 41:06:33.2 | 296 | 24.56 | 3.9 |
| 12:50:47.61 | 41:07:00.2 | 345 | 24.45 | 3.61 |
| 12:50:47.59 | 41:06:56.9 | 391 | 25.33 | 3.38 |
| 12:50:47.50 | 41:06:26.2 | 525 | 25.52 | 3.5 |
| 12:50:47.17 | 41:06:27.4 | 429 | 25.34 | 3.54 |
| 12:50:46.92 | 41:06:05.5 | 413 | 25.14 | 3.45 |
| 12:50:46.93 | 41:06:35.3 | 378 | 25.41 | 3.47 |
| 12:50:46.32 | 41:06:18.3 | 357 | 25.60 | 3.05 |
| 12:50:46.40 | 41:07:46.8 | 466 | 24.95 | 4.38 |
| 12:50:46.13 | 41:06:11.2 | 380 | 24.24 | 3.94 |
| 12:50:46.17 | 41:08:13.6 | 491 | 24.34 | 3.57 |
| 12:50:45.27 | 41:06:36.8 | 478 | 24.91 | 4.37 |
| 12:50:45.11 | 41:06:27.8 | 308 | 25.30 | 3.73 |
| 12:50:44.65 | 41:06:51.3 | 369 | 24.82 | 3.66 |
| 12:50:44.26 | 41:07:39.2 | 432 | 25.78 | 2.67 |
| 12:50:43.79 | 41:06:11.4 | 353 | 24.95 | 3.33 |
| 12:50:43.76 | 41:06:48.3 | 348 | 25.18 | 2.79 |
| 12:50:43.29 | 41:07:54.9 | 457 | 22.59 | 3.52 |
| 12:50:43.03 | 41:06:07.7 | 485 | 24.91 | 3.17 |
| 12:50:42.95 | 41:07:49.5 | 473 | 26.39 | 2.7 |
| 12:50:42.66 | 41:06:11.8 | 405 | 22.65 | 3.92 |
| 12:50:42.58 | 41:06:36.6 | 428 | 25.00 | 4.34 |
| 12:50:42.48 | 41:07:52.8 | 425 | 24.88 | 3.5 |
| 12:50:42.19 | 41:08:15.0 | 476 | 24.58 | 3.07 |
| 12:50:41.40 | 41:07:01.5 | 433 | 24.98 | 3.5 |
| 12:50:41.17 | 41:06:21.0 | 413 | 25.21 | 3.47 |
| 12:50:41.17 | 41:07:46.4 | 339 | 24.26 | 4.7 |
| 12:50:40.87 | 41:05:57.5 | 414 | 3.47 | |
| 12:50:40.74 | 41:06:11.7 | 410 | 25.53 | 4.37 |
| 12:50:40.55 | 41:07:46.4 | 417 | 24.72 | 3.61 |
| 12:50:40.26 | 41:08:00.7 | 400 | 25.33 | 4.04 |
| 12:50:40.15 | 41:06:51.3 | 383 | 24.74 | 2.77 |
| 12:50:38.62 | 41:07:04.9 | 409 | 25.41 | 3.71 |
| 12:50:38.67 | 41:08:05.0 | 391 | 25.35 | 4.2 |
| 12:50:38.55 | 41:06:44.4 | 418 | 25.00 | 2.89 |
| 12:50:38.02 | 41:06:20.9 | 423 | 25.54 | 3.68 |
| 12:50:37.90 | 41:08:06.1 | 464 | 25.14 | 3.05 |
| 12:50:36.34 | 41:06:48.0 | 430 | 25.65 | 3.07 |
| 12:50:35.24 | 41:06:10.8 | 425 | 24.93 | 3.45 |
| 12:50:34.75 | 41:06:18.3 | 408 | 24.87 | 3.31 |
| 12:50:34.15 | 41:05:58.2 | 379 | 2.91 | |
| 12:50:25.18 | 41:06:16.4 | 415 | 25.50 | 4.3 |
| 12:50:48.71 | 41:06:32.7 | 378 | 25.18 | 5.45 |
| 12:50:42.79 | 41:07:48.9 | 454 | 25.22 | 3.54 |
| RA (J2000) | Dec (J2000) | Rvel | FWHM | ||
|---|---|---|---|---|---|
| 12:50:52.02 | 41:11:22.3 | 330 | 26.26 | 1.26 | 3.36 |
| 12:50:53.68 | 41:10:15.8 | 263 | 24.37 | 0.38 | 3.17 |
| 12:50:50.03 | 41:09:22.2 | 341 | 26.56 | 1.11 | 3.71 |
| 12:50:50.16 | 41:09:01.5 | 311 | 25.67 | 0.82 | 4.04 |
| 12:50:51.57 | 41:08:58.3 | 270 | 24.74 | 0.62 | 3.1 |
| 12:50:56.25 | 41:08:42.6 | 265 | 25.54 | 0.65 | 4.74 |
| 12:50:52.22 | 41:08:35.6 | 268 | 24.35 | 0.48 | 3.54 |
| 12:50:48.81 | 41:08:25.3 | 367 | 26.21 | 1.57 | 2.72 |
| 12:50:57.74 | 41:08:19.7 | 252 | 25.35 | 0.65 | 4.25 |
| 12:50:46.14 | 41:08:13.2 | 408 | 3.61 | ||
| 12:50:49.62 | 41:08:04.5 | 363 | 24.84 | 1.28 | 5.02 |
| 12:50:52.93 | 41:08:02.5 | 496 | 25.63 | 2.47 | 4.46 |
| 12:50:53.86 | 41:07:56.1 | 310 | 23.35 | 2.61 | 3.31 |
| 12:50:51.57 | 41:07:52.1 | 367 | 23.62 | 8.87 | 3.76 |
6.1 Luminosity function
We placed a premium on detecting as many PNe as possible, even in the partially vignetted region of the instrument. Considerable corrections have been applied, and the magnitudes should therefore only be taken as indicative. The luminosity function of the objects detected is presented in Fig 4. The bright-end cutoff for the assumed distance of 6 Mpc ( = 24.4) is indicated. At the faint end the luminosity function is, of course, significantly incomplete while at the bright end some objects are brighter than the cutoff. The latter are probably H ii regions and have therefore not been included in the analysis of the kinematics.
The number of PNe found in the major axis field (CDI mode) is in rough agreement with predictions. From the basic data on NGC 4736 compiled by Mulder (1995) (, Mpc) we have , and on the basis of the results of Hui et al (1993) the expected number of PN in the top decade of the PNLF in M94 would therefore be around 2000. Mulder also found the galaxy to be fairly well-fitted by an exponential disk with scale length 57″. The region we examined includes 0.029 of the light of such an exponential, which should therefore include 59 PNe in the brightest decade. This number compares well with the 53 actually found, though the agreement may be somewhat fortuitous given the incompleteness at the faint end.

6.2 Rotation curve
In Fig 5 the line-of-sight velocities of the 53 objects in the major axis field are plotted as function of radius, after subtraction of the systemic velocity (Table 1). Flat rotation is seen out to the last measured point at almost 5 scale lengths. For comparison we overplot the H i/CO rotation curve of Sofue (1997), projected into the plane of the sky. For objects near a distance of 1 arcmin along the major axis the mean velocity is 98 km s-1, in agreement with the projected gas rotation velocity of 103 km s-1 at that point. The uncorrected minor axis data yield a mean velocity of 329 km s-1, consistent with the systemic velocity.

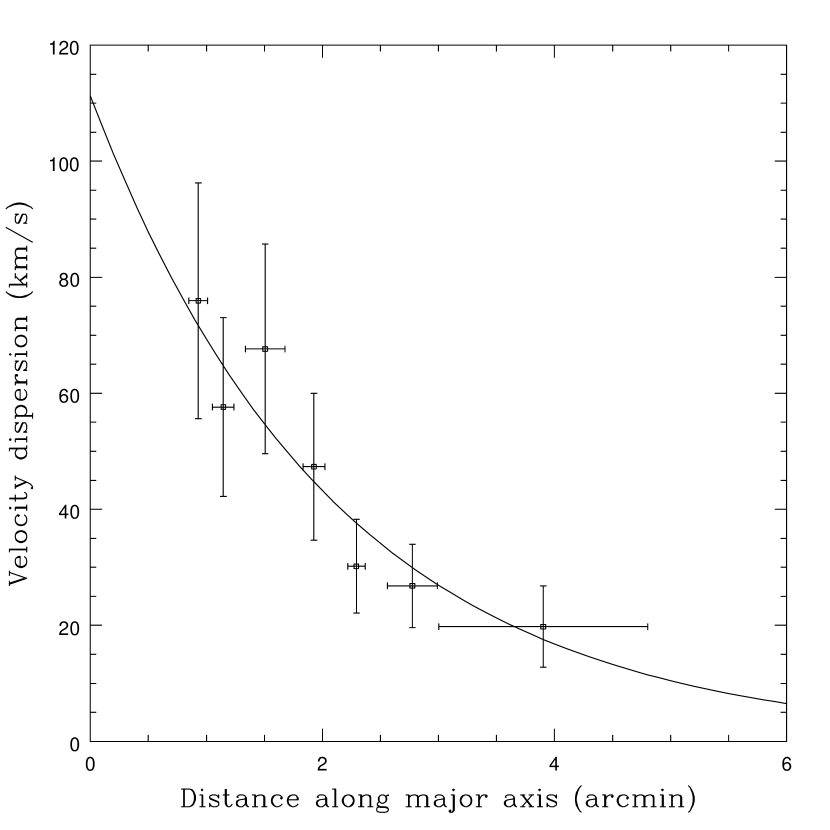
6.3 Velocity dispersion
Generally, the vertical structure in disks of spiral galaxies is reasonably well described by an isothermal sheet approximation (van der Kruit & Searle 1982; Bottema 1993). In this model, the vertical velocity dispersion is found to follow an exponential decline with radius with scale length twice that of the surface density. With the additional assumption that the dispersion ellipsoid has constant axis ratios throughout the disk, one finds that the line-of-sight velocity dispersion follows the same decline, independent of the galaxy’s inclination. We tested this using the major axis data. Figure 6 shows the velocity dispersion in bins of distance along the major axis. Seven objects were eliminated from the kinematic analysis as their brightnesses suggested that they are H ii regions. The curve is the least-squares exponential fit, yielding central velocity dispersion 111 km s-1 and scale length = 130 arcsec. These are close to the published value for the central stellar velocity dispersion ( km s-1) obtained from absorption-line spectra (Mulder and van Driel, 1993) and to twice the photometric scale length ( arcsec), suggesting that the isothermal sheet approximation is reasonable.
6.4 Combined Kinematic Model
The binning in Fig 6 effectively assumes that the PNe all lie close to the major axis. In fact, they are located up to one arcminute from the axis, at azimuths up to 45∘, so a more sophisticated approach is required. We therefore projected the PNe on to a thin disk of fixed inclination (35∘), giving coordinates. The nebulae’s line-of-sight velocities can then be compared with a model consisting of a three-dimensional isothermal sheet with a flat rotation curve. This model has five parameters, namely the three components of the central velocity dispersion , the scale length , and the rotation amplitude. A maximum likelihood method was then used to fit the model. We added twelve PNe from the minor axis field (Table 4) to help constrain the fit (two were excluded from the fit as probable H ii regions).
In practice the data were not adequate to constrain all five parameters. Using the canonical relationship from the epicyclic approximation (Binney & Merrifield 1998, eq. 11.18) and allowing to vary over the range 0.2 to 2.0, we found a robust maximum likelihood solution with scale length arcsec, central velocity dispersion km s-1, and circular rotation speed km s-1. These results are consistent with the H i rotation speed at 1 arcmin radius (180 km s-1) and again with twice the photometric scale length.
It was not possible to constrain the shape of the velocity ellipsoid with these data – such an analysis would require a more complete azimuthal coverage of the galaxy. However if we assume then we infer km s-1 at one photometric scale length, consistent with the trend between rotation speed and disk velocity dispersion found by Bottema (1993).
Thus far we have ignored measurement error in the velocities, which will tend to increase the measured velocity dispersion. This turns out to be a small effect: allowing for a 1 error of 10 km s-1, the fitted dispersion becomes approximately 3% smaller and the scale length is unchanged.
7 Conclusions
In this paper we have demonstrated how the kinematics of the PN population in a galaxy can be measured by slitless spectroscopy through narrow-band filters with a dual-beam spectrograph. We compared two possible modes: dispersed/undispersed imaging, in which a dispersed [O iii] image is compared to an undispersed H image; and counterdispersed imaging, in which two [O iii] images, dispersed in opposite directions, are analysed. It turns out that the latter method is more effective: evidently the H fluxes of faint PNe are not reliably high enough to allow both spectral lines to be used.
Our pilot experiment was performed on the large nearby Sab galaxy M94. It has revealed a PN population in the disk whose rotation curve remains flat, and whose velocity dispersion declines radially exponentially, consistent with the predictions of a simple isothermal sheet model. PNe were detected out to five exponential scale lengths, well beyond the reach of kinematic measurements based on integrated-light absorption-line spectroscopy. The number of PNe detected was consistent with expectations.
The present experiment was limited to two fields in this large galaxy. Complete coverage of the galaxy should yield around 2000 PNe, and would allow a detailed kinematic model to be fitted, including a determination of the axis ratio of the velocity ellipsoid following the technique of Gerssen et al. (1997). Obtaining such data for a small sample of nearby galaxies in just a few nights of 4-m telescope time is a practical proposition.
8 Acknowledgements
The WHT is operated on the island of La Palma by the Isaac Newton Group in the Spanish Observatorio del Roque de los Muchachos of the Instituto de Astrofísica de Canarias. We wish to acknowledge the help and support of the ING staff. We are also grateful for some excellent additional data provided by ING astronomers in service mode. The IRAF data reduction package is written and supported by the IRAF programming group at the National Optical Astronomy Observatories (NOAO) in Tucson, Arizona. We thank the referee Dr R. Ciardullo for comments which led to the addition of §4.3.
References
- [1] Binney, J., Merrifield, M.R., 1998, “Galactic Astronomy”, Princeton University Press.
- [2] Bosma A., van der Hulst J.M., Sullivan W.T., 1977, A&A, 57, 373
- [3] Bottema, R., 1993, A&A, 275, 16
- [4] Carollo, C.M., de Zeeuw, P.T., van der Marel, R.P., Danziger, I.J., 1995, ApJL, 441, 25
- [5] Ciardullo R., Jacoby G.H., Ford H.C., Neil J.D., 1989, ApJ, 339, 53
- [6] Douglas N., Taylor K, 1999, MNRAS 307, 190
- [7] Freeman, K.C., M. Arnaboldi, M. Capaccioli, R. Ciardullo, J. Feldmeier, H. Ford, O. Gerhard, R. Kudritzki, G. Jacoby, R. H. Mendez, R. Sharples, 1999, ASP Conference Series, F. Combes, G.A. Mamon and V. Charmandaris (eds.), astro-ph/9910057
- [8] Gerhard, O., Jeske, G., Saglia, R.P., Bender, R., 1998, MNRAS, 295, 197
- [9] Gerssen J., Kuijken K., Merrifield M.R., 1997, MNRAS 288, 618
- [10] Hui X., 1993, PASP, 105, 1011
- [11] Hui X., et al., 1993, ApJ, 414, 463
- [12] Jacoby G.H., Branch D., Ciardullo R., Davies R.L., Harris W.E., Pierce M.J., Pritchet C.J., Tonry J.L., Welch D.L., 1992, PASP, 104, 599
- [13] Mulder P.S., 1995, Ph.D. Thesis, Groningen
- [14] Mulder P.S., van Driel W., 1993, A&A, 272, 63
- [15] Schneider S.E., Terzian Y., Purgathofer A., Perinotto M., 1983, ApJSS 52, 399
- [16] Sofue, Y., 1997, PASJ 49, 17
- [17] Tremblay B., Merrit D., Williams T.B., 1995, ApJ, 443, L5
- [18] Van der Kruit, P.C., Searle, L., 1982, A&A, 110, 61
- [19] Vassiliadis & Wood, 1994, ApJS 92, 125