Structure in the local Galactic ISM on scales down to 1 pc, from multi-band radio polarization observations
Abstract
We discuss observations of the linearly polarized component of the diffuse galactic radio background. These observations, with an angular resolution of 4′, were made with the Westerbork Synthesis Radio Telescope (WSRT) in 5 frequency bands in the range 341 – 375 MHz. The linearly polarized intensity (with polarized brightness temperature going up to 10 K) shows a ‘cloudy’ structure, with characteristic scales of 15 – 30′, which contains relatively long, but very narrow ‘canals’ (essentially unresolved) in which is only a small fraction of that in the neighbouring beams.
These ‘canals’ are generally seen in more than one frequency band, although their appearance changes between bands. They are probably due to depolarization within the synthesized beam, because the change in polarization angle across the deepest ‘canals’ is in general close to (or etc.). These very abrupt changes in , which are seen only across the ‘canals’, seem to be accompanied by abrupt changes in the Rotation Measure (RM), which may have the right magnitude to create the difference of close to in , and thereby the ‘canals’.
The structure in the polarization maps is most likely due to Faraday rotation modulation of the probably smooth polarized radiation emitted in the halo of our Galaxy by the fairly local ( pc) ISM. Therefore, the abrupt changes of RM across the ‘canals’ provide evidence for very thin ( pc), and relatively long transition regions in the ISM, across which the RM changes by as much as 100%. Such drastic RM changes may well be due primarily to abrupt changes in the magnetic field.
Key Words.:
polarization - ISM: magnetic fields - ISM: structure - radio continuum: ISM
1 Introduction
Wieringa et al. (1993) were the first to note structure on arcminute scales in the linearly polarized component of the galactic radio background at 325 MHz, observed with the WSRT. The small-scale structure in the maps of polarized intensity , (with polarized brightness temperatures of up to 10 K) does NOT have a counterpart in total intensity, or Stokes , down to very low limits. Because the total Stokes of the galactic radio background has an estimated of the order of 30 – 50 K at 325 MHz, which must be very smooth and therefore filtered out completely in the WSRT measurements, the apparent polarization percentage of the small-scale features can become very much larger than 100%.
The absence of corresponding small-scale structure in Stokes led Wieringa et al. (ibid.) to propose that the small-scale structure in polarized intensity is due to Faraday rotation modulation. In this picture, synchrotron radiation generated in the Galactic halo reaches us through a magneto-ionic screen, viz. the warm relatively nearby ISM. Structure in the electron density and/or magnetic field in the ISM causes spatial variations in the Rotation Measure (RM) of the screen. Hence, the angle of linear polarization of the synchrotron emission from the halo is rotated by different amounts along different lines of sight. Even if the polarized emission in the halo were totally smooth, in intensity as well as angle, the screen would produce structure in Stokes and .
Small-scale structure in the polarized galactic radio background has recently been observed also at other frequencies. At 1420 MHz, Gray et al. (1998, 1999) used the DRAO synthesis telescope to study the phenomenon at 1′ resolution. Uyaniker et al. (1999) used the Effelsberg telescope at 1.4 GHz, to map the polarized emission at 9′ resolution over about 1100□. Duncan et al. (1998) discuss radio polarization data at 1.4, 2.4 and 4.8 GHz with the Parkes radio telescope and the VLA, at resp. 5′, 10′ and 15′ resolution. All these observations support the interpretation in terms of modulation of emission originating at larger distances, by a relatively nearby Faraday screen.
The distributions of polarized intensity and angle may therefore be used to study the structure of the Faraday screen. In particular, polarization observations give information about the electron density, ne, and the component of the magnetic field parallel to the line of sight, , in the ISM on scales down to less than 0.5 pc ( 4′ at an assumed distance of 500 pc). The diffuse nature of the polarized radio background allows (almost) complete spatial mapping of RMs over large areas, provided one has observations at several frequencies. This gives a large advantage over RM determinations through individual objects, like pulsars or extra-galactic radio sources.
2 Distribution of polarized intensity
In Fig. 1 we show a gray-scale representation of the polarized intensity in a 5 MHz wide frequency band centered at 349 MHz. The map shows a region of centered at at an angular resolution of about 4′. It is one of 8 frequency bands observed simultaneously. Three of those have strong interference, but we obtained good data at 341, 349, 355, 360 and 375 MHz. All 5 maps were made combining mosaics of 75 pointing centres. This yields constant sensitivity over a large area (see e.g. Rengelink et al. 1997). The observations were made with the WSRT in January and February 1996, largely at night, and ionospheric Faraday rotation was therefore well-behaved. No corrections were applied.
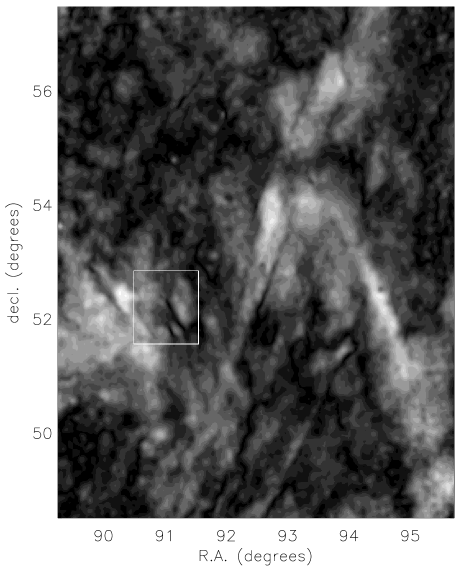
The region in Fig. 1 is rather special because goes up to 10 K, and because it contains large, almost linear structures in . Our attention was drawn to this field by the panoramic view of galactic polarization produced in the WENSS survey (de Bruyn & Katgert 2000). However, this field is not unique, and there are other regions with similarly high . Over a very large fraction of the map the -signal is quite significant, with a noise 0.5 K. With S/N-ratios of generally more than 3 and going up to 30, polarization angles are well-defined. Note that in this region, the upper limit to structure in Stokes (total intensity) on small scales ( 30′) is about 1 K, or less than 2% of the total .
There appear to be at least two distinct components in the polarized intensity distribution. The first one is a fairly smooth, ‘cloudy’ component, pervading the entire map, with intensity variations on typical scales of (several) tens of arcminutes. In addition, there are conspicuous, very narrow and often quite long and wiggly structures, which we will refer to as ‘canals’, in which the polarized intensity is considerably lower than in the immediate surroundings. In this Letter we focus on the nature and implications of the narrow ‘canals’; we will discuss the ‘cloudy’ component in more detail in another paper (Haverkorn et al. 2000).
3 The nature of the ‘canals’ in polarized intensity
The strong and abrupt decrease of polarized intensity in the ‘canals’ suggests that depolarization is responsible. There are several mechanisms that can produce depolarization, but the only plausible type in this case is beam depolarization. This occurs when the polarization angle varies significantly within a beam. Complete depolarization requires that for each line of sight there is a ‘companion’ line of sight within the same beam that has the same polarized intensity but for which the polarization angle differs by 90∘. Below we will show that our observations indicate that the polarization angle indeed changes by large amounts across low polarized intensity ‘canals’, and close to 90∘ across the ‘canals’ of lowest .
Depolarization can also be caused by ‘differential Faraday rotation’. This happens when along a line of sight emitting and (Faraday) rotating plasmas coexist (e.g. Burn 1966; Sokoloff et al. 1998). However, the absence of correlated structure in Stokes and the high degree of polarization suggest that this is not a dominating effect. Significant bandwidth depolarization, which occurs when the polarization angle is rotated by greatly different amounts in different parts of a frequency band could only play a rôle (given our 5 MHz bandwidth) if the RM were of order 80 rad m-2, which is not the case in this region near the galactic anti-centre (see below).
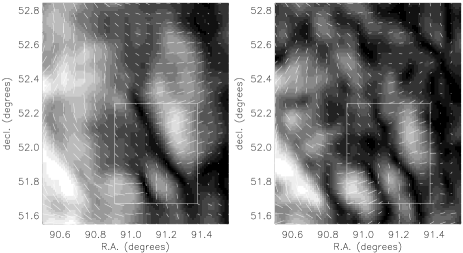
In Fig. 2 we show the polarization vectors around a few of the deepest ‘canals’, superimposed on gray-scale plots of , in two frequency bands. The area shown is indicated in Fig. 1. The polarization vectors on either side of the ‘canals’ are quite close to perpendicular, demonstrating that the ‘canals’ are produced by beam depolarization. This perpendicularity applies to all ‘canals’, irrespective of frequency band and is very convincing, especially because everywhere else the polarization vectors vary quite smoothly (if significantly!).
Beam depolarization creates ‘canals’ that are one beam wide, which is exactly what we observe. This implies that the 90∘ ‘jump’ must occur on angular scales smaller than the beamwidth. At resolution (about twice that in Fig. 2), the ‘canals’ indeed seem unresolved, but the decrease in S/N-ratio precludes conclusions on even smaller scales (the original data have resolution).
Additional evidence that the ‘canals’ are due to beam depolarization is statistical. We defined ‘canal-like’ points from the observed values of , as follows. For each point in the mosaic we compared the observed value of with the -values in pairs of two diametrically opposed neighbouring (adjacent) points. If the value of in the central point was less than a certain small fraction of the values in both comparison points, the point was defined ‘canal-like’. This definition mimics the visual detection ‘algorithm’.

Bottom panel: between two points on opposite sides of non-‘canal-like’ points (see text for definition). For the non-‘canal-like’ points , , rather than .
In the top panel of Fig. 3 we show the distribution of the difference between the ’s in the two adjacent points that define the ‘canal-like’ points, for a -threshold of 30%. The -distribution peaks at 90∘, fully consistent with the beam depolarization hypothesis. This conclusion is reinforced by a comparison with the distribution of (again for diametrically opposed adjacent neighbours) of all points for which is between 1.0 and 2.0 times larger than both -values in the two diametrically opposed neighbouring points, which is shown in the bottom panel of the same figure.
Similar ‘canals’ were noted by Uyaniker et al. (1999) and Duncan et al. (1998), who also invoked beam depolarization. Yet, Fig. 3 is the first quantitative proof for this explanation.
4 The cause of the ‘jumps’ in polarization angle
Two processes can cause jumps in polarization angle across the ‘canals’: a sudden change in RM across the ‘canals’, and a jump in intrinsic of the emission incident on the Faraday screen. A large change in intrinsic implies a change in magnetic field direction and is therefore quite difficult to understand in view of the absence of structure in total intensity at the more than 2% level (see Sect. 2). On the other hand, variations in the RM of the Faraday screen would seem to be quite natural, if not unavoidable.
Discontinuities in RM must play an important rôle in producing the ‘canals’, because the ‘canals’, although similar in adjacent frequency bands, generally do not occur in all bands, and certainly are not identical in the different bands (see Fig. 2). This indicates that the jumps in are mainly due to changes in RM. However, the question is if the jumps in are indeed accompanied by jumps in RM of the right magnitude so that is produced at the frequency where the ‘canal’ is best visible.
In principle, the determination of RM only involves a simple linear fit of the polarization angles in the five frequency bands (at 341, 349, 355, 360 and 375 MHz) vs. , but in practice several complications may arise. First, the observed values of may be biased due to imaging effects (like off-sets) in the Stokes - and -maps from which is derived (cf. Wieringa et al. 1993). Our data indicate that, in the maps of this region of sky, such off-sets are quite small, so that the bias in the values is small. Second, it is not obvious that the assumption of pure Faraday rotation () is supported by the data (see Haverkorn et al. 2000).
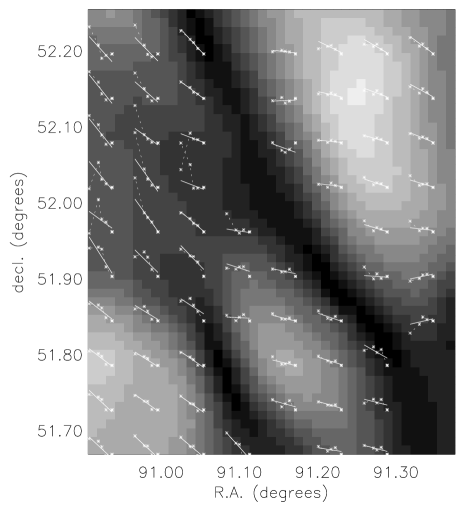
In Fig. 4 we show an array of plots of vs. for independent beams in the small region (indicated in Fig. 2) that contains two clear ‘canals’. As can be seen, a direct determination of RM across the ‘canals’ is not at all trivial. Without knowing the position of the ‘canals’, one probably would have some trouble to find the ‘canals’ from discontinuities in RM distribution alone, due to the uncertainties in the RM-estimates, which sometimes are considerable. On the other hand, if one knows where the canals are one can identify some related ‘jumps’ in RM.
From the present data, it seems quite likely that the ‘canals’ are primarily due to quite abrupt and relatively large changes of RM, with RM/RM ranging from 0.3 to more than 1 (at least in this region of sky). Note that in this region the RMs are in the range from –10 to +10 rad m-2 (also confirmed by several polarized extragalactic radio sources in these same observations). However, a more robust conclusion about the relation between and RM requires a detailed analysis of more, and more sensitive data, and a careful error analysis.
5 Implications for the structure of the local ISM
Because we have not yet reached a quantitative conclusion about the suspected correlation between and RM, it is not possible to give a full discussion of the implications that these polarization data have for the small-scale structure of the warm ISM. However, the data discussed here show the great promise that high-resolution, multi-band polarization data hold for the study of the ISM, especially on small scales where pulsars and extragalactic radio sources cannot give much information.
Fortunately, more and more sensitive radio polarization data (in different regions of sky) are forthcoming. In addition, information must be obtained about the electron density in the warm ISM on the relevant scales (e.g. through H measurements), as well as on the other components in the ISM (like e.g. the HI).
While we fully realize the preliminary nature of the conclusions presented, we feel justified to speculate somewhat on the possible implications of the ‘canals’. Structure in RM reflects structure in and/or in the ISM. However, as the RM is an integral over the entire line of sight, the large RM/RM values that are implied by our observations may give a very specific message. In particular, we consider it unlikely that the large RM/RM values are produced mainly by variations in electron density. Instead, they may be indicating a turbulent ISM with varying (reversing) magnetic field structures, as modeled in recent MHD simulations (see e.g. Mac Low & Ossenkopf 2000; Vázquez-Semadeni & Passot 1999).
Acknowledgements.
The Westerbork Synthesis Radio Telescope is operated by the Netherlands Foundation for Research in Astronomy (NFRA) with financial support from the Netherlands Organization for scientific research (NWO). This work is supported by NWO grant 614-21-006.References
- (1) Burn B.J., 1966, MNRAS 133, 67
- (2) de Bruyn A.G., Katgert P., 2000, in preparation
- (3) Duncan A.R., Haynes R.F., Reich W. et al., 1998, MNRAS 299, 942
- (4) Gray A.D., Landecker T.L., Dewdney P.E., Taylor A.R., 1998, Nat 393, 660
- (5) Gray A.D., Landecker T.L., Dewdney P.E. et al., 1999, ApJ 514, 221, astro-ph/9812164
- (6) Haverkorn M., Katgert P., de Bruyn A.G., 2000, in preparation
- (7) Mac Low M., Ossenkopf V., 2000, A&A 353, 339, astro-ph/9906334
- (8) Rengelink, R.B., Tang Y., de Bruyn A.G. et al., 1997, A&AS 124, 259
- (9) Sokoloff D.D., Bykov A.A., Shukurov A., et al., 1998, MNRAS 299, 189
- (10) Uyaniker B., Fürst E., Reich W., Reich P., Wielebinski, R., 1999, A&AS 138, 31, astro-ph/9905023
- (11) Vázquez-Semadeni E., Passot T., 1999, in Interstellar Turbulence, Franco J., Carraminana, A., Cambridge Univ. Press, p. 223
- (12) Wieringa M.H., de Bruyn A.G., Jansen D., Brouw W.N., Katgert P., 1993, A&A 268, 215