GRB990510: on the possibility of a beamed X-ray afterglow
Abstract
We discuss the prompt emission of the -ray burst (GRB) 990510 and its subsequent X-ray afterglow from 8.0 to 44.3 hrs after the prompt emission, using observations with the Gamma-ray Burst Monitor and Narrow Field Instruments on BeppoSAX. In the 40–700 keV band, GRB990510 had a fluence of 1.9 erg cm-2, whereas it reached a peak flux of 2.4 10-6 erg cm-2 s-1. The X-ray afterglow decay light curve can be satisfactorily described by a single power law with index of . Both the X-ray and optical behaviour of the afterglow can be explained by -ray burst debris expanding as a jet; we find that the cooling frequency is (fixed) between the optical and X-ray wavelength bands.
1 Introduction
Among the about 25 -ray bursts localized by the BeppoSAX Wide Field Cameras (WFCs), most of those followed-up with the Narrow Field Instruments (NFIs) onboard the same satellite have exhibited afterglows at X-ray energies (e.g., Costa et al. 1997), whereas less than half of them have exhibited afterglows in the optical, IR, and/or radio (e.g., van Paradijs et al. 1997; Frail et al. 1997). Most X-ray afterglows show a smooth power-law decay (with indices between 1.1 to 1.9), the exceptions being GRB970508 (Piro et al. 1998) and GRB970828 (Yoshida et al. 1999), which exhibit re-bursting events on time scales of a few hours and a day, respectively, superimposed on a power-law trend. The brightest X-ray afterglow so far, i.e. that of GRB990123, provided the first detection of hard X-ray (15–60 keV) afterglow emission (Heise et al. 2000).
Here we discuss BeppoSAX observations of the prompt -ray emission and the X-ray afterglow of GRB990510. On 1999 May 10 the BATSE experiment onboard the Compton Gamma Ray Observatory (CGRO) was triggered by GRB990510 at 8:49:06.29 UT (trigger 7560, see Kippen et al. 1999). The GRB was also detected by the BeppoSAX Gamma-Ray Burst Monitor (GRBM; Amati et al. 1999a) and WFC unit 2 (Dadina et al. 1999; Briggs et al. 2000), as well as by Ulysses (Hurley et al. 2000) and the Near Earth Asteroid Rendezvous (NEAR) spacecraft (Hurley 1999, private communication). In the WFC energy range (2–28 keV) the GRB had a duration of 80 s and reached a peak intensity of 4.3 Crab. The WFC error box was followed up in X-rays by the Narrow Field Instruments (NFIs) onboard BeppoSAX 8 hrs after the event and a strong decaying source was found (Piro et al. 1999b, Kuulkers et al. 1999). About 8.5 hr after the -ray/X-ray event the optical counterpart was found (Vreeswijk et al. 1999a) with a redshift of (Vreeswijk et al. 1999b). A linear polarization of 2% was measured (Covino et al. 1999; Wijers et al. 1999). Extended emission around the optical counterpart of GRB990510 has not been clearly detected, which indicates that a possible underlying host galaxy must be very faint (Israel et al. 1999; Fruchter et al. 1999b; Beuermann et al. 1999).
The light curve of the optical afterglow of GRB990510 does not follow a simple power-law decay, but showed smooth steepening after about one and a half day after the -ray burst (Harrison et al. 1999; Stanek et al. 1999; Israel et al. 1999). Traces of such a characteristic have also been found in the optical afterglow of GRB990123 (Kulkarni et al. 1999; Fruchter et al. 1999a) and the near-infrared afterglow of GRB990705 (Masetti et al. 2000). It has been regarded as the signature of a decreasing collimation in a relativistic flow (Sari et al. 1999; Rhoads 1999). Such behavior has never been observed in the X-ray afterglows of GRBs. The relatively large brightness of the GRB990510 X-ray afterglow allows an excellent opportunity to study the X-ray light curve in search of such a feature.
2 Observations
2.1 GRBM
The GRBM consists of the 4 anti-coincidence shields of the Phoswich Detection System (PDS; Frontera et al. 1997; Costa et al. 1998). The GRBM detector operates in the 40–700 keV energy band. The normal directions of two GRBM shields are co-aligned with the pointing direction of the WFCs. The on-axis effective area of the GRBM shields, averaged over the 40–700 keV band, is 420 cm2. The data from the GRBM include rates with 1 s time resolution and energy ranges of 40–700 keV and 100 keV, and average 240-channel spectra in the 40–700 keV band every 128 s (independently phased from GRB trigger times). For our spectral analysis we use data in the 70–650 keV band, since in this energy range the GRBM 240-channels response matrix is known with sufficient accuracy. For studying the GRB spectral evolution we use the 1 s ratemeters, and we check their consistency with the GRB time averaged spectra obtained from the 240 channel data (see Amati et al. 1999b).
GRB990510 was detected by the GRBM, but the instrument was not triggered to a GRB data acquisition mode, because a previous false event prevented this. Therefore, no high time resolution data have been acquired for this burst and the time resolution is limited to 1 s.
2.2 NFI
The NFI include two imaging and two non-imaging instruments. The imaging instruments are the Low-Energy Concentrator Spectrometer (LECS), sensitive from 0.1 to 10 keV (Parmar et al. 1997), and the Medium-Energy Concentrator Spectrometer (MECS), sensitive from 2 to 10 keV (Boella et al. 1997). They both have circular fields of view with diameters of 37 and 56, respectively. The non-imaging instruments are the Phoswich Detector System (PDS), sensitive from 13 to 300 keV (Frontera et al. 1997), and the Gas Scintillation Proportional Counter, sensitive from 4 to 120 keV (Manzo et al. 1997). In our analysis we used data from the LECS, MECS and PDS.
The 3 radius WFC error box of GRB990510 was observed by the NFI from 8.0 to 44.3 hours after the BATSE trigger time, i.e. from MJD 51308.70–51310.22 (UT 1999 May 10.70–12.22). The total LECS, MECS and PDS on-source exposure times were 31.7, 67.9 and 41.5 ksec, respectively.
3 Data analysis
3.1 Prompt -ray emission
The GRBM light curve of the burst is shown in Fig. 1 (top). Two main pulses 40 s apart are observed. Between these pulses the GRB flux level is consistent with zero. The first pulse contains two sub-pulses with peak fluxes in the ratio 3:1. The second pulse consists of 5 sub-pulses with the first two having the highest peak flux and the following three being much weaker (by a factor of about 6). The entire GRB duration is 75 s. The GRB fluence in the 40–700 keV band is (1.90.2) erg cm-2, while the peak flux reached in the same energy band is (2.4 0.2) erg cm-2 s-1 (all errors quoted in this paper are 1 uncertainties, unless noted otherwise.)
We performed a spectral analysis of the prompt emission of GRB990510 in the 70–650 keV band, by following approximately the same procedure used for, e.g., GRB970228 and GRB980329 (see Frontera et al. 1998; In ’t Zand et al. 1998). The average spectrum of the prompt emission of GRB990510 can be satisfactorily described ( = 6.84 for 9 d.o.f.) by a broken power-law, with a break energy keV and power-law indices before and after the break of and , respectively. We note that a fit to the canonical -ray burst spectral model as introduced by Band et al. (1993) is also acceptable ( = 7.65 for 9 dof); however, we could not constrain the value of the power-law index below the peak energy , (). The other Band parameters, i.e. the break energy or cut-off energy, , and power-law index above , , in this fit are keV and , respectively.
We also studied the spectral evolution of the prompt emission by assuming that a power-law connects the two energy bands 40–100 keV and 100–700 keV, and that the burst flux above 700 keV is negligible. The photon index , computed as a color index between the two energy ranges, is reported in the bottom panel of Fig. 1: the spectrum seems to slightly soften during the first main pulse. When the second main pulse starts, the spectrum is harder before it softens. The indices have typical values for GRBs.
3.2 X-ray afterglow
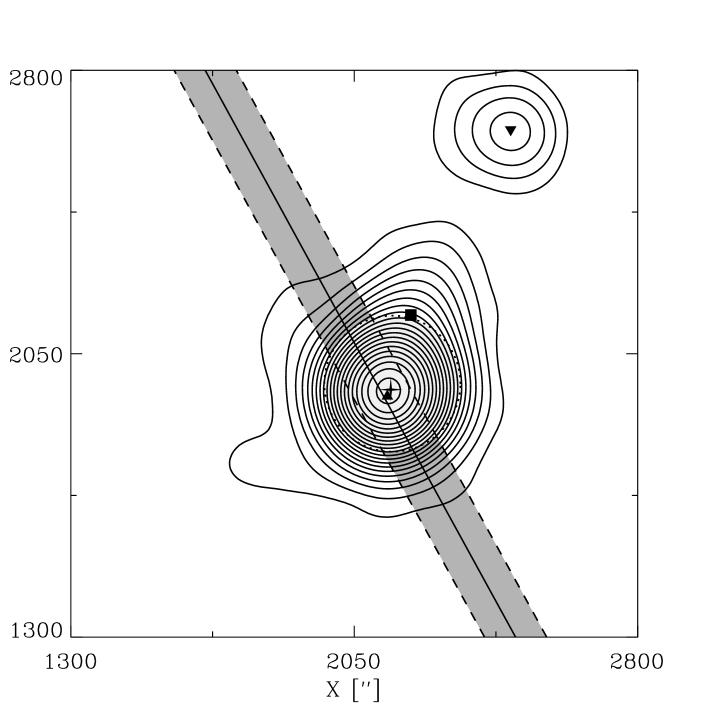
The combined image from MECS units 2 and 3 shows clearly the presence of a previously unknown bright source within the WFC error circle, formerly proposed as the X-ray counterpart of the GRB (Piro et al. 1999b, Kuulkers et al. 1999). It is elongated toward the NNW direction (see Fig. 2). This extension is likely due to the presence of an unresolved point source, partially contaminating the bright source. Another X-ray source is present 13 arcmin NNW of the bright source, and outside the WFC error circle of GRB990510. The LECS image, albeit less exposed than the MECS image, also shows a bright source, with a similar extension.
The proximity of the probable X-ray afterglow candidate to the weaker, contaminating source makes an accurate spatial analysis necessary, accounting for the extended tails of the point-spread functions of the LECS and MECS instruments, in order to separate the two point sources. We used different independent approaches to resolve this problem and performed fits of the resulting spectra. We here discuss one of these approaches, the maximum likelihood method, since the main results of this paper are obtained using this approach. The other two approaches serve as a consistency check of the former approach and are described in Appendix A. For all spectral fits, the background was evaluated from blank sky observations, after checking its stability with several source-free regions around the X-ray afterglow. The LECS spectrum was considered only in the 0.2–4 keV interval, due to calibration uncertainties above 4 keV. The MECS spectrum was considered in the 2–10 keV range.
In the maximum likelihood method one searches for single point sources on top of a background model (assumed to be flat, i.e. cosmic diffuse X-ray and particle-induced background). With this method, which allows a simultaneous analysis of several sources, one retrieves all photons from the point sources as detected by the instrument (for a more detailed description of the method we refer to Kuiper et al. 1998 and In ’t Zand et al. 2000).
This method shows that the LECS and MECS image can be satisfactorily described by three point sources on top of a flat background model. Their best-fit positions from the MECS measurements are given in Table 1, together with the source designations as given by Kuulkers et al. (1999). In Fig. 2, we show the maximum likelihood map using the MECS data (2–10 keV) sampled over the full duration of the observation. In this figure we also show the best derived WFC position of the prompt emission (Dadina et al. 1999), the Ulysses/GRBM triangulation annulus of the prompt emission (Hurley et al. 2000) and the position of the optical afterglow (Vreeswijk et al. 1999a). Since 1) 1SAX J1338.18030 is positionally consistent with the position of GRB990510 as derived by the WFC and the triangulation annulus, 2) the optical afterglow of GRB990510 lies within the confidence contours of this X-ray source, and 3) the X-ray emission of 1SAX J1338.18030 decayed during our observations (see below) we conclude that 1SAX J1338.18030 is the X-ray afterglow of GRB990510.
We note that no other source near 1SAX J1337.68027 has been reported previously at other wavelengths, while 1SAX J1336.08018 lies close (within 2) to the radio source PMN J13358016 (Wright et al. 1994).
X-ray spectra of 1SAX J1338.18030 were generated in 9 energy bins, logarithmically distributed between 0.2 and 4.0 keV for the LECS data, and in 20 energy bands, logarithmically distributed between 1.6 and 10 keV for the MECS data. The best-fit value of the normalization between the LECS and MECS was found to be 0.7. This is within the range usually found (0.6–0.9, see e.g., Favata et al. 1997; Piro et al. 1999a). We therefore fixed this normalization to 0.7. For 1SAX J1337.68027 we performed spectral fits only using the MECS data and fixed the hydrogen column density, NH, to that found for 1SAX J1338.18030. The best-fit parameters of the mean spectra using the maximum likelihood method, and that of the other methods, are given in Table 2. We note that the best-fit values of NH are close to that derived for the mean Galactic value from the HI maps by Dickey & Lockman (1990) in the region of GRB990510, i.e. 0.94 1021 atoms cm-2. We derive an unabsorbed average flux of 1.47 10-12 erg s-1 cm-1 (2–10 keV) for 1SAX J1338.18030 during our observation.
To search for possible changes of the afterglow spectral shape during the observation, we logarithmically divided the whole MECS observation into three time bins so that in each time interval there were approximately equal amounts of counts. The spectra are at all times statistically well described by a single power-law, whose index does not change significantly during the afterglow decay (see Table 3).
It has been suggested that (red-shifted) iron K lines may be present in the spectra of X-ray afterglows (Piro et al. 1999a; Yoshida et al. 1999). Since the redshift to GRB990510 has been reported to be 1.62 (Vreeswijk et al. 1999b), one might expect such a line below 2.5 keV. We do not see, however, clear evidence for lines in this region, neither in the total spectrum nor in the three time intervals, with 90% confidence upper limits on the line intensity of typically 7 10-6 photons s-1 cm-1 for the total averaged afterglow spectrum.
The X-ray afterglow of GRB990510 was not detected with the PDS instrument. By assuming a power-law spectrum with a photon index of 2.1, the 2 upper limits on the flux from the GRB990510 region are 2.6 10-12 erg s-1 cm-1 and 5.0 10-12 erg s-1 cm-1, for the energy ranges 15–30 keV and 15–60 keV, respectively. This is consistent with that estimated from extrapolation of the LECS/MECS spectra.
We obtained light curves in the MECS 2–10 keV range of the individual sources in 15 temporal bins, logarithmically spaced in time since the BATSE trigger (Fig. 3). 1SAX J1338.18030 clearly fades during our observations. By fitting this decline with a power-law (t) , we obtain (/dof=10.2/13). The corresponding fit is shown in Fig. 4 (solid line). The count rate of 1SAX J1337.68027 is consistent with being constant (=13.4 for 14 d.o.f.) at 0.003 cts s-1.
4 Discussion
GRB990510 ranks among the top 25% of the brightest GRB observed by the GRBM, while it ranks among the top 4% (9%) of the BATSE burst flux (fluence) distribution (Kippen et al. 1999). The mean prompt -ray spectrum is well described by a broken power-law, with a break energy of 200 keV. The fluence, peak flux and spectrum as measured with the GRBM are comparable to those measured with BATSE. With the repeated pulses and ”hard-to-soft” spectral evolution, the -ray light curve and spectral behavior of GRB990510 are reminiscent of GRB970228 (Frontera et al. 1998).
The X-ray counterpart of GRB990510, 1SAX J1338.18030, is also very bright if compared with other GRB X-ray afterglows (see e.g. Piro 2000), and decays according to a typical power-law with index 1.42, which is consistent with that expected in relativistically expanding fireball models (e.g., Wijers, Rees & Mészáros 1997). However, the optical light curve smoothly steepens 1–2 days after the prompt -ray emission (Stanek et al. 1999; Harrison et al. 1999; Israel et al. 1999; see also Fig. 4). It was found that this steepening occurs at the same time in the different optical bands. To characterize its shape, the (V,R,I)-band data were simultaneously fitted by Harrison et al. (1999) with the following four-parameter function111As noted by Harrison et al. (1999), the function which describes the optical (B,V,R,I) light curve by Stanek et al. (1999) and Israel et al. (1999) is different, leading to somewhat different values of the break time, i.e. 1.57 days.:
| (1) |
with days, , and . In Fig. 4 we plot the optical R-band data taken in the same time span as the X-ray data, together with the above described function. It is clear that the optical data are not consistent with a power-law decay in that time span. We fitted the X-ray afterglow light curve with the same function as above, while fixing the decay indices to those derived in the optical. We find that the corresponding fits are bad, with values of 24–27 for 14 d.o.f., depending on which parameter values we use among those reported by the different authors (Stanek et al. 1999, Harrison et al. 1999, Israel et al. 1999).
A steepening in the light curves can be expected in the fireball model when the cooling frequency moves towards lower frequencies in the observed frequency range. In that case the decay index changes by 0.25 (Sari et al. 1998). However, the steepening of the optical decay is independent of wavelength (or achromatic) and the optical decay index changes by 1.36 (Harrison et al. 1999). We provide additional evidence against a changing cooling frequency. In that case one would expect the optical decay index to be similar to that in the X-ray band, in contrast to what is observed.
It has recently been realized that not all afterglow light curves are consistent with emission from expanding shells that are spherically symmetric, but that beaming may be important (i.e., jets, see e.g. Sari et al. 1999; Rhoads 1999). Such jets explain the presence of the steepening observed in the optical afterglow light curves of GRB990510 (e.g. Harrison et al. 1999). Sari et al. (1999) presented general expressions for the expected spectral and decay index, appropriate for both spherical shell and jet evolutions shortly after the -ray event. Our observed X-ray spectral index of 1.030.08 implies a value of the index of the electron energy distribution in the expanding material of in the case of fast cooling (i.e., when the cooling frequency is below the X-ray range). In the alternate case (i.e., the cooling frequency is above the X-ray range) we derive . Harrison et al. (1999) found that the optical light curves can only imply , where the cooling frequency is above the optical wavelength range. Therefore, we conclude that the cooling frequency is between the optical and X-ray wavelengths. Note that the cooling frequency stays constant for a spreading jet (Sari et al. 1999).
At early times after the burst the decay light curve of a collimated source is identical to that of a spherical one, since then only a small portion of the emitting surface is visible due to relativistic beaming (the opening angle then is , where is the Lorentz factor). In that case the decay index, , is expected to be in the case of fast cooling (i.e. steeper than in the optical: ; Sari et al. 1999). As the fireball evolves, decreases, and the beaming angle will eventually exceed the jet opening angle. At that time one will see a break in the light curve, with , while the optical and X-ray decay index are similar after the break. Therefore, we fitted the X-ray afterglow light curve again, now fixing and to 1.1 and 2.1, respectively, and to that found in the optical. This leads to good fits with values of about 12 for 14 dof. The corresponding fit is also shown in Fig. 4 (dotted line) with extrapolations to the boundaries of the plot. This shows that the observed X-ray afterglow of GRB990510 is consistent with the jet interpretation. As evident from Fig. 4, X-ray observations of the very early afterglow or a long time after the break time could have clearly discriminated whether the X-ray afterglow light curve is described by a single power law or consistent with the jet interpretation.
We conclude that, even if we could not distinguish the presence of a clear break in the X-ray light curve, the only explanation within the fireball model consistent with the X-ray and optical data is a jet evolution, where the cooling frequency lies between the optical and X-ray wavelengths. Future observations of afterglows at late times with the X-ray observatories recently launched (Chandra and XMM-Newton) may provide a direct evidence of such a temporal X-ray feature.
References
- (1)
- (2) Amati, L., Frontera, F., Costa, E., Feroci, M. 1999a, GCN Circ. 317
- (3)
- (4) Amati, L., Frontera F., Costa E., et al. 1999b, A&ASS, 138, 403
- (5)
- (6) Band, D., Matteson, J., Ford, L., et al. 1993, ApJ, 413, 281
- (7)
- (8) Beuermann, K., Hessman, F.V., Reinsch, K., et al. 1999, A&A, 253, L26
- (9)
- (10) Boella, G., Chiappetti, L., Conti, G., et al. 1997, A&AS, 122, 327
- (11)
- (12) Briggs, M.S., Preece, J., van Paradijs, J., in ’t Zand, J.J.M., Heise, J., Kuulkers, E., Kouveliotou, K., 2000, in preparation
- (13)
- (14) Costa, E., Frontera, F., Heise, J., et al. 1997, Nat, 387, 783
- (15)
- (16) Costa, E., Palazzi, E., Feroci, M., et al. 1998, Adv. Space Res., 22, 1129
- (17)
- (18) Covino, S., Lazzati, D., Ghisellini, G., et al. 1999, A&A, 348, L1
- (19)
- (20) Dadina, M., Di Ciolo, L., Coletta, A., et al. 1999, IAU Circ. 7160
- (21)
- (22) Dickey, J.M., Lockman, F.J. 1990, ARA&A, 28, 215
- (23)
- (24) Favata, F., Vink, J., Dal Fiume, D., et al. 1997, A&A, 324, L49
- (25)
- (26) Fiore, F., Giommi, P., Vignali, C., et al., 2000, MNRAS, in press
- (27)
- (28) Frail, D.A., Kulkarni, S.R., Nicastro, S.R., Feroci, M., Taylor, G.B. 1997, Nat 389, 261
- (29)
- (30) Frontera, F., Costa, E., Dal Fiume, D., et al. 1997, A&AS, 122, 357
- (31)
- (32) Frontera, F., Costa, E., Piro, L., et al. 1998, ApJ 493, L67
- (33)
- (34) Fruchter, A.S., Thorsett, S.E., Metzger, M.R., et al. 1999a, ApJ, 519, L13
- (35)
- (36) Fruchter, A.S., Ferguson, H., Pepper, J., Gibbons, R., Sahu, K., Pian, E. 1999b, GCN Circ. 386
- (37)
- (38) Galama, T.J., Vreeswijk, P.M., Rol, E., et al. 1999, GCN Circ. 313
- (39)
- (40) Harrison, F.A., Bloom, J.S., Frail, D.A. 1999, ApJ, 523, L121
- (41)
- (42) Heise, J., Sari, R., Amati, L., et al. 2000, submitted
- (43)
- (44) Hurley, K., Feroci, M., Cinti, M.-N., et al. 2000, ApJ, submitted
- (45)
- (46) In ’t Zand, J.J.M., Amati, L., Antonelli, L.A., et al. 1998, ApJ, 505, L119
- (47)
- (48) In ’t Zand, J.J.M., et al. 2000, in preparation
- (49)
- (50) Israel, G.L., Marconi, G., Covino, S., et al. 1999, A&A, 348, L5
- (51)
- (52) Kaastra, J.S., Mewe, R., Nieuwenhuijzen, H. 1996, in The 11th colloquium on UV and X-ray spectroscopy of Astrophysical and Laboratory Plasmas, ed. T. Watanabe, p. 411
- (53)
- (54) Kaastra, J.S., et al. 2000, in preparation
- (55)
- (56) Kippen, R.M., the BATSE GRB team, 1999, GCN Circ. 322
- (57)
- (58) Kuiper, L., Hermsen, W., Bennett, K., Carramiñana, Lyne, A., McConnell, M., Schönfelder, V. 1998, A&A, 337, 421
- (59)
- (60) Kulkarni, S.R., Djorgovski, S.G., Odewahn, S.C., et al. 1999, Nat, 398, 389
- (61)
- (62) Kuulkers, E., Heise, J., Antonelli, L.A., et al. 1999, GCN Circ. 326
- (63)
- (64) Lazzati, D., Covino, S., Ghisellini, G. 1999, GCN Circ. 325
- (65)
- (66) Manzo, G., Giarrusso, S., Santangelo, A., et al. 1997, A&AS, 122, 341
- (67)
- (68) Masetti, N., Palazzi, E., Pian, E., et al. 2000, A&A, in press (astro-ph/9912423)
- (69)
- (70) Parmar, A.N., Martin, D.D.E., Bavdaz, M., et al. 1997, A&AS, 122, 309
- (71)
- (72) Piro, L. 2000, in ”X-Ray Astronomy ’99: Stellar Endpoints, AGN and the Diffuse X-ray Background”, ApLC, in press (astro-ph/0001436)
- (73)
- (74) Piro, L., Amati, L., Antonelli, L.A., et al. 1998, A&A, 331, L41
- (75)
- (76) Piro, L., Costa, E., Feroci, M., et al. 1999a, ApJ, 514, L73
- (77)
- (78) Piro, L., the BeppoSAX team, 1999b, GCN Circ. 311
- (79)
- (80) Rhoads, J. 1999, ApJ, 525, 737
- (81)
- (82) Sari, R., Piran, T., Halpern, J.P. 1999, ApJ, 519, L17
- (83)
- (84) Sari, R., Piran, T., Narayan, R. 1998, ApJ 497, L17
- (85)
- (86) Stanek, K.Z., Garnavich, P.M., Kaluzny, J., Pych, W., Thompson, I. 1999, ApJ, 522, L39
- (87)
- (88) van Paradijs, J., Groot, P.J., Galama, T., et al. 1997, Nat 386, 686
- (89)
- (90) Vink, J., Kaastra, J., Bleeker, J.A.M., Preite-Martinez, A. 2000, A&A, in press (astro-ph/9911299)
- (91)
- (92) Vreeswijk, P.M., Galama, T.J., Rol, E., et al. 1999a, GCN Circ. 310
- (93)
- (94) Vreeswijk, P.M., Galama, T.J., Rol, E., et al. 1999b, GCN Circ. 324
- (95)
- (96) Wijers, R.A.M.J., Rees, M.J., Mészáros, P. 1997, MNRAS, 288, L51
- (97)
- (98) Wijers, R.A.M.J., Vreeswijk, P.M., Galama, T.J., et al. 1999, ApJ, 523, L33
- (99)
- (100) Wright, A.E., Griffith M.R., Burke B.F., Ekers R.D. 1994, ApJS 91, 111
- (101)
- (102) Yoshida, A., Namiki, M., Otani, C., et al. 1999, A&ASS, 138, 433
- (103)
Appendix A Other image analysis methods
A.1 ‘SPEX’ method
One of the other methods to investigate source-rich regions is currently implemented in the X-ray spectral fitting code SPEX (Kaastra et al. 1996). This approach consists of simultaneously fitting the spectra from different detector sections, taking into account the spill-over from photons coming from one detector section into another detector section of the sky. For a detailed description of this method we refer to Vink et al. (2000) and Kaastra et al. (2000). The detector sections we used are two circles of 3 radius (which limits the effect of contamination due to source proximity), centered on the positions of 1SAX J1338.18030 and 1SAX J1337.68027 obtained from the maximum likelihood method. Note that in the case of the LECS a non-negligible amount of photons will lie outside the extraction regions, especially at low energies (20% for 1 keV in the case of a 3 extraction radius), due to its relatively large point spread function; this leads to some degradation in the sensitivity at these energies. The extraction of the spectra and the generation of response matrices takes into account the characteristics of both the LECS and MECS. The spectral resolution is oversampled by the LECS and MECS energy channels, therefore we rebinned the spectra so that roughly each resolved energy bin contains three spectral channels.
The hydrogen absorption column density, NH, was forced to be similar for both 1SAX J1338.18030 and 1SAX J1337.68027, since leaving them both free led to unstable fits for 1SAX J1337.68027. The best-fit value of the normalization between the LECS and MECS was found to be 0.8, and we therefore fixed it to 0.8. Both the spectrum of 1SAX J1338.18030 and 1SAX J1337.68027 are simultaneously well described by power-law models (subject to interstellar absorption). The best-fit parameters for both sources are given in Table 2.
A.2 ”Canonical” method
We also evaluated the spectral fitting results offered by the maximum likelihood method, by following, for the spectral extraction, the classical method, which is more or less appropriate only for isolated point sources. We extracted the spectra within circles of radius 8 and 4, for the LECS and MECS, respectively, centered on the best-fit position of 1SAX J1338.18030 obtained with the maximum-likelihood method. The resulting spectra were also rebinned to bin sizes corresponding to roughly one third of the detector spectral FWHM resolution, with the additional constraint that each bin contained at least 20 counts.
Since the fitted centroids of 1SAX J1338.18030 and of 1SAX J1337.68027 are only 3.8 arcmin apart, the resulting spectra clearly contain the summed contribution of the two sources. Therefore, it is expected that the results of the spectral fits are reasonable if the X-ray flux of 1SAX J1337.68027 is negligible with respect to that of 1SAX J1338.18030 and/or if 1SAX J1337.68027 does not vary over the observed time interval. Since the maximum likelihood method showed that the spectrum and emission level of 1SAX J1337.68027 do not significantly vary with time, we fixed the contribution from 1SAX J1337.68027 to that found by the SPEX method and fitted the afterglow spectrum by leaving the hydrogen column density as a free parameter. The best-fit parameters are also reported in Table 2.
| Source | rerra | ||
|---|---|---|---|
| 1SAX J1338.18030 | 13h 38m 1122 | 80 30 021 | 24 |
| =GRB990510’s afterglow | |||
| 1SAX J1337.68027 | 13h 37m 4646 | 80 26 313 | 72 |
| 1SAX J1336.08018 | 13h 36m 0271 | 80 18 228 | 70 |
| a Statistical uncertainty radius. The 90% confidence systematic | |||
| uncertainty is 56 for small off axis angles. For larger off-axis | |||
| angles the uncertainty increases to 65–90 near the edge of the | |||
| FOV (Fiore et al. 2000). | |||
| Source | NH | Norma | photon | FXb | /dof |
| (1021 atoms cm-2) | index | (2–10 keV) | |||
| Maximum likelihood method | |||||
| 1SAX J1338.18030 | 2.10.6 | 0.600.06 | 2.030.08 | 1.470.18 | 42/26 |
| 1SAX J1337.68027c | 2.1d | 0.100.03 | 2.10.3 | 0.220.10 | 41/18 |
| SPEX method | |||||
| 1SAX J1338.18030 | 1.70.7 | 0.630.10 | 2.120.12 | 1.360.24 | 169/189 |
| 1SAX J1337.68027 | “ | 0.090.04 | 1.90.4 | 0.270.17 | 169/189 |
| ‘Canonical’ method | |||||
| 1SAX J1338.18030 | 1.50.6 | 0.620.21 | 2.240.13 | 1.130.38 | 86/82 |
| 1SAX J1337.68027e | “ | 0.09 | 1.9 | 0.27 | – |
| a Power-law normalization in 10-3 photons cm-2 s-1 keV-1 at 1 keV. | |||||
| b Unabsorbed X-ray flux (10-12 erg s-1 cm-2). | |||||
| c MECS only, see text. | |||||
| d Parameter fixed, see text. | |||||
| e Parameters fixed to result from SPEX method, see Appendix. | |||||
| Timea | Effective exposure | Normb | photon | FXc | /dof |
| (hrs) | ksec | index | (2–10 keV) | ||
| 8–12.6 | 7.3 | 1.90.3 | 2.100.12 | 4.200.75 | 20/13 |
| 12.6–21.8 | 12.4 | 1.00.2 | 2.130.13 | 2.040.39 | 6/13 |
| 21.8–44.3 | 48.2 | 0.370.05 | 2.080.12 | 0.850.15 | 21/13 |
| a Time after start of -ray burst trigger. | |||||
| b Power-law normalization in 10-3 photons cm-2 s-1 keV-1 at 1 keV. | |||||
| c Unabsorbed X-ray flux (10-12 erg s-1 cm-1). | |||||