The line of sight velocity distributions of simulated merger remnants
Abstract
We use Gauss-Hermite functions to study the line of sight velocity distributions in simulated merger remnants. Our sample contains sixteen remnants; eight produced by mergers between disk galaxies of equal mass and eight produced by mergers between disk galaxies with mass ratios of 3:1. The equal-mass mergers display a wide range of kinematic features, including counterrotation at large radii, orthogonally rotating cores, and misaligned rotational axes. Most of the unequal-mass remnants exhibit fairly regular disk-like kinematics, although two have kinematics more typical of the equal-mass remnants. Our results may be compared to observations of early type objects, including ellipticals with misaligned kinematic axes, counterrotating systems, and S0 galaxies.
1 Introduction
Kinematic studies of early-type galaxies have revealed a remarkable variety of interesting behavior; some galaxies have rotation axes “misaligned” with respect to their minor axes (Franx, Illingworth, & de Zeeuw 1991), while in others the inner regions counterrotate with respect to the rest of the galaxy (Statler, Smecker-Hane, & Cecil 1996; Bender & Surma 1992; van der Marel & Franx 1993). Such intriguing kinematics could plausibly result if these galaxies are the end-products of disk-galaxy mergers (Toomre & Toomre 1972), and N-body simulations have gone some ways toward showing that mergers can indeed produce remnants with distinctive kinematics (Hernquist & Barnes 1991; Barnes 1992, 1998; Balcells & González 1998). However, other theories have been put forward for such kinematic features, particularly in the case of counterrotation (Kormendy 1984; Bertola, Buson, & Zeilinger 1988). Distinguishing between major mergers and other explanations for distinctive kinematics in galaxies has been especially difficult.
The projected luminosity profiles and isophotal shapes of simulated disk galaxy mergers are reasonably good matches to those of elliptical galaxies (eg. Barnes 1988; Hernquist 1992, 1993; Governato, Reduzzi, & Rampazzo 1993; Heyl, Hernquist, & Spergel 1994), but few workers have investigated the projected kinematics of simulated merger remnants. Hernquist (1992, 1993) described principal-axis profiles of projected mean velocity and velocity dispersion for several disk-disk merger remnants, and Heyl, Hernquist, & Spergel (1996) studied line of sight velocity distributions for a somewhat larger sample of objects. These studies showed that kinematic misalignments of merger remnants are observable, and indicated that skewness of line profiles could provide information on the initial orientations of the merging disks. However, while systematically exploring different projections, these studies were limited to equal-mass mergers, and did not examine the structure of line profiles in detail or map velocity fields in two dimensions.
Therefore, we studied line of sight velocity distributions for a larger sample of simulated merger remnants. We examined eight mergers between disk galaxies with mass ratios of 1:1 and another eight mergers between disk galaxies with mass ratios of 3:1. We limited our analysis to a single projection along the intermediate axis of each remmant, but we complement a extensive presentation of major-axis kinematics with detailed examinations of individual line profiles and with two-dimensional maps of key kinematic parameters. This work extends the studies described above to unequal-mass mergers, clarifies the connection between initial conditions and line profile, and provides predictions to be compared with kinematic studies of early-type galaxies using the next generation of integral-field spectrometers.
The outline of this paper is as follows. The rest of Section 1 describes the merger simulations and the methods we use to extract line of sight velocity distributions and represent the distributions with Gauss-Hermite parameters. Sections 2 and 3 present the results for the equal-mass and unequal-mass mergers, respectively. Section 4 compares our results to observational studies and summarizes our conclusions.
1.1 Merger simulations
The remnants analyzed here came from a modest survey of parabolic encounters between model disk galaxies (Barnes 1998). Each model had three components: a central bulge with a shallow cusp (Hernquist 1990), an exponential/isothermal disk with constant scale height (Freeman 1970; Spitzer 1942), and a dark halo with a constant-density core (Dehnen 1993; Tremaine et al. 1994). Density profiles for these components are
| (1) | |||||
| (2) | |||||
| (3) |
where is spherical radius, is cylindrical radius in the disk plane, and is distance from the disk plane.
Adopting simulation units with , the model used in the equal-mass mergers has a bulge mass of , a disk mass of , and a halo mass of . The bulge scale length is , the disk scale radius and scale height are and , and the halo scale radius is . With these parameter choices, the model has a half-mass radius , and the circular velocity and orbital period at this radius are and . The model may be roughly scaled to the Milky Way by equating our units of length, mass, and time to , , and , respectively.
In the unequal-mass mergers, the larger model had the same parameters as listed above, while the small model was scaled down by a factor of in mass and in radius in rough accord with the standard luminosity-rotation velocity relation for disk galaxies.
Each experiment used a total of particles, assigned to the luminous components, and assigned to the dark halos. The models were run with a tree code using a spatial resolution of and a time-step . With these integration parameters, total energy was conserved to within % peak-to-peak.
All eight equal-mass merger simulations used the same initial orbit, leading in each case to close () parabolic encounter. Disk angles for these experiments are listed in Table 1; and are the inclination and argument of pericenter (Toomre & Toomre 1972), while the subscripts and label the two disks. After merging, remnants were evolved for several more dynamical times before being analyzed.
| ID | ||||
|---|---|---|---|---|
| A | 0 | 71 | 30 | |
| B | -109 | 90 | 71 | 90 |
| C | -109 | -30 | 71 | -30 |
| D | -109 | 30 | 180 | |
| E | 0 | 71 | 90 | |
| F | -109 | -30 | 71 | 30 |
| G | -109 | 30 | 71 | -30 |
| H | -109 | 90 | 180 |
The eight unequal-mass merger simulations generalize the equal-mass simulations A, B, C, and D by allowing the mass of either galaxy to vary by a factor of three. Like their equal-mass counterparts, these experiments adopted a parabolic initial orbit with pericentric separation . Table 2 lists the inclinations and pericentric arguments for each simulation; here and are the angles for the larger disk, while and are the angles for its smaller companion.
| ID | ||||
|---|---|---|---|---|
| A1 | 0 | 71 | 30 | |
| A2 | 71 | 30 | 0 | |
| B1 | -109 | 90 | 71 | 90 |
| B2 | 71 | 90 | -109 | 90 |
| C1 | -109 | -30 | 71 | -30 |
| C2 | 71 | -30 | -109 | -30 |
| D1 | 180 | -109 | 30 | |
| D2 | -109 | 30 | 180 |
Some salient properties of these merger remnants are summarized here; for a more detailed discussion, see Barnes (1998). All sixteen remnants are ellipsoidal objects with luminosity profiles generally following a de Vaucouleurs law. The projected half-light radii of the equal-mass remnants range from to , while for the unequal-mass remnants ranges from to . Fig. 1 shows axial ratios determined from the inertia tensor for the most tightly-bound half of the luminous particles in each object. On the whole, the remnants of equal-mass mergers are triaxial or prolate, while those produced by unequal-mass mergers tend to be more oblate.


1.2 Gauss-Hermite analysis
For all sixteen simulated remnants we extracted five frames, each containing luminous particles – that is, particles from the bulges and disks of the progenitor galaxies. Each set of five frames is equally-spaced over a total of time units; this interval is long enough that individual particles are sampled at effectively random orbital phases, but not long enough for the remnant to undergo significant evolution. We shifted each frame to place the potential minimum at the origin and rotated it to diagonalize the moment of inertia tensor for all particles with a potential less than times the minimum potential. In what follows, we use , , and for the major, intermediate, and minor axes of the remnants.
To measure line of sight velocity distributions as a function of position along a given axis, we created a two dimensional grid, with one dimension representing position and the other dimension representing velocity, thus simulating a slit in a spectrometer. Typically, we placed the slit along the major () axis and projected along the intermediate () axis, although other options were used in preliminary investigations. The width of the slit was set at , which is roughly % of the projected half-light radius. For each frame from each remnant, the particles falling within the slit were binned in position and velocity. The grid spacing along the slit was set to a minimum of and increased as necessary to keep the total number of particles falling within the range above a minimum. The width of the velocity bins was set to a fixed value of , spanning the velocity range with bins.
To map the line of sight velocity distributions across the plane of the sky, we used a generalization of the above procedure. However, two adjustable bin dimensions were created instead of one along the given slit.
After binning the data, the velocity distribution at each location was fit with a parameterized Gauss-Hermite series (van der Marel & Franx 1993). The value of each parameter was determined by combining the five frames and performing a least-squares fit; uncertainties were estimated by comparing fits of individual frames. Gauss-Hermite functions are modified Gaussians with additional skewness and kurtosis parameters; they provide an effective way to parameterize the moderately non-Gaussian distributions which arise in systems which have undergone incomplete violent relaxation. The formula for the fitting function is
| (4) |
where and
| (5) | |||||
| (6) | |||||
| (7) |
This function has five parameters: , , , , and . The normalization factor has little physical significance in our study. The mean velocity and velocity dispersion have dimensions of velocity, while the and parameters represent the skewness and kurtosis of the velocity distribution and are dimensionless. When , the Gauss-Hermite series produces a normal Gaussian profile. When has the same sign as the distribution’s leading wing is broad and the trailing wing is narrow, while when and have opposite signs the trailing wing is broad and the leading wing is narrow. When , the distribution has a narrow peak with broad wings, and when , the distribution has a broad peak with narrow wings.
1.3 Orbit classification
In order to discover which orbital families are responsible for various features in the velocity distributions, we assigned each particle to an orbit family using the algorithm described in Fulton & Barnes (submitted). This algorithm follows each particle for a number of radial periods and classifies its orbit by examining the sequence of principal plane crossings. To save time and slightly reduce the effects of discreteness, we calculated the trajectories using a quadrupole-order expansion of the gravitational field (White 1983). For the present purpose all “boxlet” orbits were counted as boxes; thus the major orbital families recognized here are Z-tubes, which rotate about the minor axis, X-tubes, which rotate about the major axis, and boxes, which do not rotate.
2 Equal-Mass Mergers
A merger of comparable-mass galaxies usually eliminates many of the initial characteristics of both galaxies in the formation of the new galaxy. The resulting remnants are supported partly by rotation and may sometimes be flattened, but the overall structure of the galaxies as well as the dynamics are radically changed. (This is in contrast to the 3:1 mergers, where the disk of the larger galaxy often survives the merger.) Furthermore, the dynamics of individual 1:1 mergers produced with different initial parameters vary greatly.
2.1 Typical 1:1 merger parameter curves
Fig. 2 plots the Gauss-Hermite parameters as functions of position along the major axis for remnant E. This nearly oblate and rapidly rotating object was produced by a direct encounter between disks with inclinations of and ; it has a fairly simple structure which contrasts the more complex cases described below. Fig. 3 shows examples of line of sight velocity distributions at two different places in the galaxy. These distributions are shown for all the particles, and for particles sorted by orbital family (Z-tubes, X-tubes, and box orbits).


Within one about effective radius, the mean velocity shows a roughly linear trend with position, while at larger radii the velocity profile rises more gradually and may start to level off. This shape is seen in all but one the remnants studied here, though the profile amplitude and the radius at which it levels off varies from one remnant to another. The exception, in which the outskirts of the remnant counterrotate with respect to the rest, will be described shortly. None of the 1:1 remnants attain rotation velocities comparable to their circular velocities, implying that rotation plays a relatively minor role in supporting these objects.
The velocity dispersion profile in Fig. 2 climbs from a local minimum at the center to a gentle peak on either side, and then falls off slowly at greater distances from the origin. Similar profiles are seen in all of the 1:1 remnants; this uniformity may be understood from the Jeans equations, since all of these moderately anisotropic remnants have similar density profiles. The central regions have a large percentage of particles from the Hernquist-model bulges of the progenitor galaxies. These particles still follow density profiles at small and their dispersion therefore scales as , producing the central minima noted above. At larger radii the rather gradual fall-off in may reflect the increasing contribution of dark matter, which dominates the mass budget beyond about one effective radius.
In this as in most 1:1 remnants, the parameter is has the same sign as the mean velocity ; as Fig. 3b shows, the velocity profile has broad leading and narrow trailing wings. This asymmetric profile arises through a combination of box orbits and Z-tube orbits. The former, which have a symmetric and rather narrow velocity distribution, effectively localize the peak of the profile, while the latter, which have a wide distribution with nonzero mean, populate the broad leading wing. Further from the center the trend of with position is reversed, and the outermost points are consistent with ; this may occur because the outer regions of this rather oblate remnant are almost exclusively populated by Z-tube orbits.
The profile in Fig. 2 shows a significant peak at the center, falls off rapidly at slightly larger radii, then appears to increase again before becoming statistically consistent with at the outer points plotted. All the remnants in our sample have at small radii and more nearly Gaussian distributions at large radii. However, there are large variations from remnant to remnant, so it’s not clear if the results presented for remnant E should be considered typical. As Fig. 3a shows, the distinctly triangular shape of the velocity distribution near the center is almost entirely due to particles on box orbits. Further from the center the fraction of box orbits declines and the velocity distribution of the box orbits becomes less triangular; both of these trends tend to reduce the measured values of .
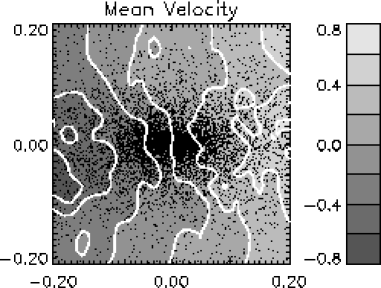
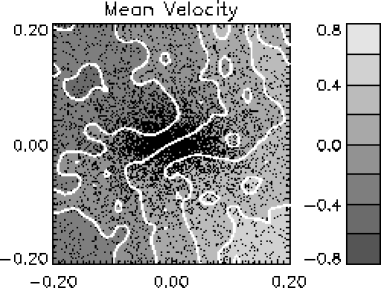
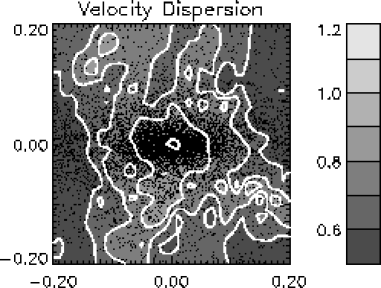
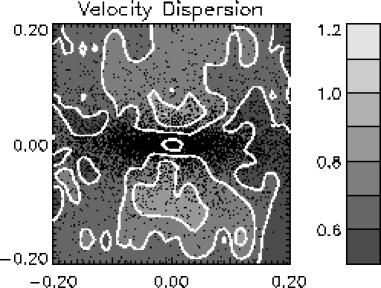
Having examined the behavior of the parameters on the major axis, we briefly describe two-dimensional maps of the mean velocity and velocity dispersion in Fig. 4. Mean rotation velocities are highest in the equatorial plane, while elsewhere a roughly cylindrical rotation pattern is seen. The zero velocity contour is slightly tilted with respect to the axis, indicating a modest amount of rotational misalignment at larger radii. If the galaxy only contained Z-tube orbits, the contours would run parallel to the axis; the net streaming of particles in X-tube orbits cause the slant and misaligns the rotational axes.
On the whole, the velocity dispersion falls off rather more rapidly away from the major axis than it does along the major axis; the dispersion contours are roughly aligned with, although rounder than, the surface density contours. Note, however, the two closed contours representing dispersion maxima directly above and below the central minimum, and the vertical elongation of the next lower contour. Several more examples of this feature will be presented shortly.
2.2 Variety in 1:1 mergers
In equal-mass mergers, the degree of violent relaxation depends on the initial orientations of the progenitor disks. Thus in contrast to the relatively simple product of a direct encounter just described, mergers of inclined or retrograde disks produce remnants with a wide range of kinematic properties. Here we describe a few examples.
2.2.1 Counterrotation at large radii

Fig. 5 shows Gauss-Hermite parameters as functions of major-axis position for remnant H. This object is similar in shape to remnant E but rotates more slowly than any other remnant in our sample; it was produced by a retrograde encounter between disks with inclinations of and . In the course of the encounter, the first disk absorbed a good deal of orbital angular momentum, producing a spheroidal structure which rotates in the same sense as the progenitors once orbited each other. The second disk, which suffered an exactly retrograde passage, remained relatively thin and retained its original sense of rotation. This rather peculiar combination of circumstances accounts for the counterrotation seen at large radii. Near the center, the virtual slit includes a substantial fraction of particles from the first progenitor, while at larger radii the kinematics near the major axis are dominated by particles from the second disk. This produces a change in the direction of mean velocity as the distance along the major axis from the center increases.
Besides its counterrotation, this remnant has other peculiar kinematic features. For example, and have opposite signs over most of the range plotted in Fig. 5, implying that the velocity profile has narrow leading and broad trailing wings; this is atypical for an equal-mass merger remnant. Moreover, within the effective radius the parameter is quite high, indicating that the profile’s wings are relatively broad in comparison to the overall dispersion. These broad wings may result from the superposition of two distinct velocity systems with widely-separated mean velocities.
2.2.2 Major-axis rotation at small radii

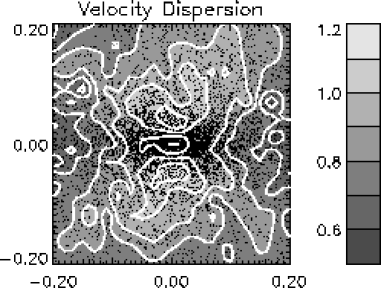
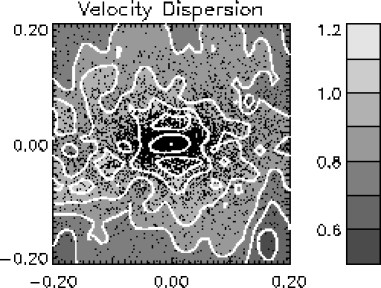
Fig. 6 presents maps of and for remnant G, a slowly-rotating and relatively prolate object produced by a merger of disks with inclinations and . This remnant has a large population of X-tube orbits which dominate the net rotation at small radii; the central regions thus rotate about the remnant’s major axis. At larger radii the angular momentum vector is largely determined by Z-tube orbits, favoring a more normal pattern of minor-axis rotation. Note that the zero velocity contour is inclined with respect to the minor axis, indicating that X-tube orbits still contribute to the net rotation; moreover, at large radii the X-tube orbits rotate in the opposite direction than they do near the center.
The dispersion contours in Fig. 6 are elongated perpendicular to the projected density contours, and the highest values are seen in two regions on the minor axis above and below the center of the remnant. An explanation for this behavior will be given shortly.
2.2.3 Severe rotational misalignment
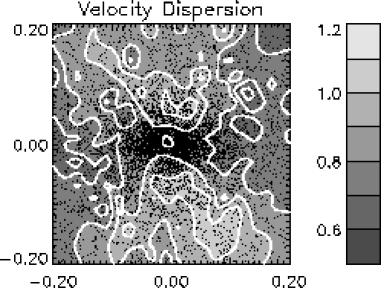
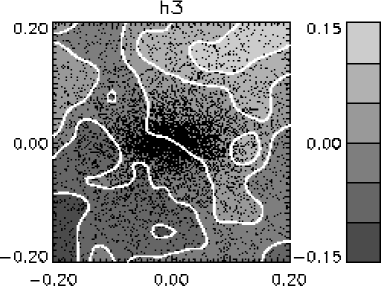
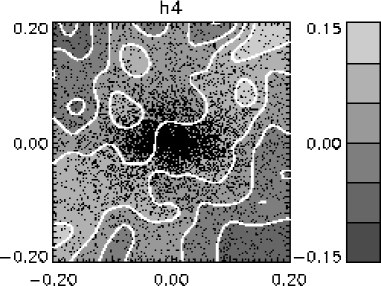
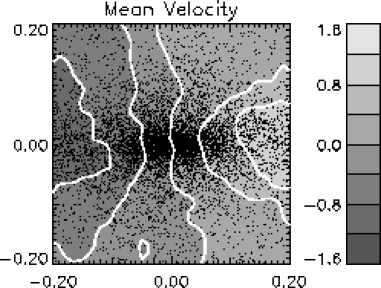
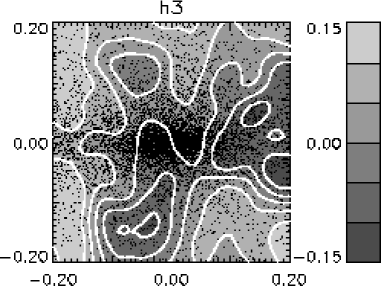
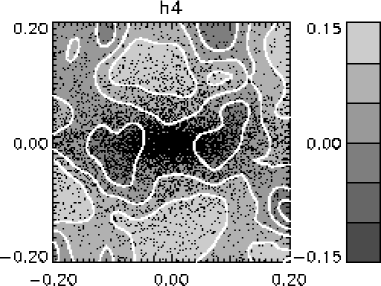
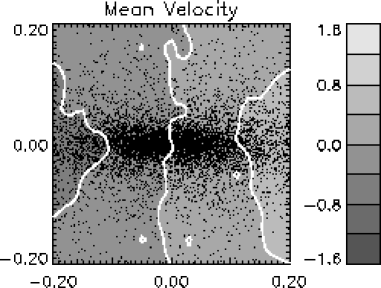
As a last example of kinematic diversity among equal-mass mergers, Fig. 7 presents maps of all four Gauss-Hermite parameters for remnant C. Like remnant G just described, this object was produced by a merger of two inclined disks and contains a large number of X-tube orbits. Within the effective radius the rotation axis is severely misaligned with the minor axis, while at larger radii the velocity contours are more nearly parallel to the minor axis. This occurs because X-tube orbits make a significant contribution to the net angular momentum at small radii, while Z-tube orbits play a larger role at large radii.


Along the minor axis, the velocity dispersion peaks on either side of the remnant’s center. Recall that such minor-axis peaks were also seen in previous dispersion maps (Figs. 4 and 6). In remnants C and G the locations of these peaks and the general shape of the high-dispersion regions resembles the spatial distribution of X-tube orbits. Such orbits encircle the waists of prolate galaxies, and travel roughly along the axis – that is, towards or away from the virtual observer – in the regions of peak dispersion. Further evidence that X-tube orbits are responsible for these peaks appears in Fig. 8, which compares velocity profiles near the center and near a peak of the dispersion. The central profile, symmetric and relatively narrow, is dominated by box orbits. In contrast, the profile near the peak is dominated by X-tubes; with some X-tubes rotating in one direction and the rest in the other direction, the velocity distribution becomes broader. This effect is strong in remnants C and G because they have large populations of X-tube orbits.
If the X-tube population was “cold”, so that most particles stayed close to the closed orbits which parent them, the X-tube distribution at the peaks would be composed of two counterrotating streams and corresponding peaks would also occur in the map. No such peaks are seen in Fig. 7; instead, the map shows a broad ridge of high values extending diagonally from lower left to upper right. The map, on the other hand, shows a gradient running along the same diagonal, with low values at the lower left and high values at the upper right. These patterns are considerably clearer than those seen in the other 1:1 remnants; most of the and maps we have examined seem too noisy to yield definite results. But we do not yet understand even the relatively simple patterns in the present example. For example, whereas and vary together in the central region of remnant E (see Fig. 2), here the contours of and are roughly orthogonal within one effective radius. Further modeling is needed to disentangle the roles of different orbit families and determine the range of behavior consistent with dynamical equilibrium.
3 Unequal-Mass Mergers
Mergers between galaxies of significantly different masses are less violent than equal-mass mergers. For sufficiently large mass ratios, the more massive galaxy may survive essentially unscathed. Of the eight 3:1 mergers we examined, six have similar kinematic parameter curves and oblate shapes. This kinematic uniformity arises because the larger disk basically survives the merging process.
3.1 Oblate 3:1 mergers


Fig. 9 plots the Gauss-Hermite parameters as functions of position along the major axis for remnant B1. This remnant was produced by a merger between a large disk with inclination and a small disk with inclination ; though somewhat more triaxial than most of the unequal-mass remnants (see Fig. 1), it serves to illustrate the kinematic structure of typical 3:1 merger remnants. Velocity profiles at selected positions are shown in Fig. 10.
The mean velocities along the major axis reveal a rotation curve similar to those seen in early type spiral and S0 galaxies; the rotation velocity smoothly increases with distance from the center, then levels off at larger radii. The amplitude of this curve is nearly twice that of remnant E (Fig. 2). As the latter is the fastest rotator among our sample of equal-mass mergers, it is at once evident that the 3:1 remnants are kinematically distinct from their 1:1 counterparts.
Along the major axis, the velocity dispersion declines only gradually out to about , then falls off rapidly at larger radii. As Fig. 10a shows, the high dispersion at small radii is due to a population of box orbits associated with a central bar or triaxial bulge. At larger radii the dominant orbit family shifts from boxes to Z-tubes, most of which rotate in the same direction as the initial disk of the larger progenitor. The relatively low dispersions seen in the outer regions indicate that this disk has survived the merger without a great deal of dynamical heating.
The 3:1 merger remnants often have rather complex major-axis curves, and remnant B1 is no exception. Within the parameter has the same sign as ; the velocity profile has broad leading and narrow trailing wings, much as in typical 1:1 remnants. But at slightly larger values abruptly changes sign and the shape of the profile is inverted. Representative profiles at and are shown in Figs. 10a and 10b, respectively. As noted above, the former is dominated by box orbits; its broad leading wing is populated with Z-tube orbits. In contrast, the latter is dominated by Z-tubes, and its broad trailing wing is largely populated by boxes.
Compared to the other cases presented here, remnant B1 has rather small values over most of the major axis; while the central peak in Fig. 9 is significant, the measured values rapidly fall to near zero further from the center. There is some hint that actually becomes negative at intermediate , but this is not compelling as most points have error bars consistent with . The three rightmost points have positive values which appear significant; these may be due to incomplete phase mixing as no corresponding upturn is seen on the other side.
Fig. 11 presents maps of all four Gauss-Hermite parameters for remnant B1. As a group, the 3:1 mergers have fairly regular velocity fields; remnant B1 is typical in this regard, showing somewhat faster rotation near the disk plane and a nearly cylindrical rotation pattern elsewhere. Some asymmetry which may be due to a long-lived warp is evident, but the zero-velocity contour falls close to the minor axis, so there is little kinematic misalignment. The dispersion contours are somewhat elongated parallel to the minor axis, but falls off monotonically with increasing , showing no sign of the off-axis peaks noted in the 1:1 remnants. Both the good kinematic alignment and the lack of off-axis dispersion peaks are expected in view of the relative scarcity of X-tube orbits in this and most other 3:1 merger remnants.
The and parameter maps show definite large-scale patterns which, however, are not easy to interpret. Particularly puzzling is the map; is basically inversion-symmetric along the major axis (Fig. 9), but no simple symmetry is seen across the face of the system. The map shows peaks on the minor axis above and below the center of the galaxy. As Fig. 10c shows, the broad-winged profile at these locations is largely due to Z-tube orbits, with some contribution from X-tubes and boxes. Curiously, each wing is dominated by particles from a different progenitor.
3.2 Prolate 3:1 mergers
While most of the unequal-mass merger remnants in our sample are much like the one just described, two have kinematic properties somewhat reminisicent of the equal-mass remnants. These are remnants A1 and A2, which – probably not by coincidence – are also the two most prolate of the 3:1 remnants (Fig. 1). Both objects were produced by direct encounters between disks with inclinations of and ; here we describe remnant A1, which results when the larger disk has inclination .

Fig. 12 shows how the velocity distribution parameters vary along the major axis of remnant A1. While this remnant rotates faster than any of the 1:1 remnants, its rotation curve rises rather gradually compared to those of typical 3:1 remnants. Moreover, the dispersion profile is nearly flat instead of falling off at large radii. These kinematic properties indicate that the larger disk, while only slightly thickened by the in-plane merger, has been significantly heated in the radial and azimuthal directions. In fact, the encounter triggers the formation of a very strong bar in the larger disk, and this bar in turn accounts for the nearly-prolate figure of the final merger remnant.
The major-axis and curves for this object also resemble those seen in many 1:1 merger remnants. Over most of the measured range, has the same sign as , indicating that the velocity profile has a broad leading and narrow trailing wings; only beyond does the profile revert to the shape characterisitc of a rotating disk. The parameter is also distinctly greater than zero along most of the major axis, like many 1:1 remnants but unlike the oblate 3:1 sample.
The mean velocity and dispersion maps in Fig. 13 reveal kinematic properties intermediate between equal-mass and unequal-mass merger remnants. The velocity field shows no sign of kinematic misalignment; this is typical of 3:1 remnants. On the other hand, the dispersion has maxima on the minor axis above and below the center, like those seen in remnants G and C. Consistent with the explanation for these peaks advanced in § 2.2.3, we note that remnant A1 has a relatively large population of X-tube orbits for a 3:1 merger.
4 Conclusions
During a merger, stellar orbits are scattered by the fluctuating gravitational potential. However, the potential settles down long before orbits can be completely randomized; consequently, merger remnants preserve significant “memories” of their progenitors (eg. Barnes 1998 and references therein). In this study we have shown that such memories can be partly recovered from the line of sight velocity profiles of merger remnants.
4.1 Comparison with observations
Observations of early-type galaxies reveal a wide variety of kinematic phenomena similar to those seen in our sample of remnants. Very briefly, we will touch on some of these similarities.
4.1.1 Misaligned rotation
As pointed out in sections 2.1 and 2.2.3 as well as in previous studies, kinematic misalignments are expected in merger remnants, and especially in equal-mass mergers. Franx, Illingworth, and de Zeeuw (1991) present a study of kinematic misalignment in elliptical galaxies; most of the galaxies they observed have small misalignments. While remnant C (Fig. 7) is dramatically misaligned, as a whole the equal-mass remnants described here are better aligned than samples reported in earlier work (Barnes 1992). The incidence of severe misalignment probably depend on several factors; for example, central density profile can have a significant impact on the phase-space available to major-axis tube orbits. Until the factors which favor misalignment are better understood, it’s not clear if the observed scarcity of severe kinematic misalignment can constrain the role of equal-mass mergers in the formation of elliptical galaxies.
4.1.2 Kinematically decoupled cores
Hernquist and Barnes (1991) presented a dissipational simulation showing that the core of a merger remnant could decouple and counterrotate. We have examined the quantitative effect that counterrotation can have on the observed kinematics of merger remnants. Several galaxies, such as NGC 1700 (Statler, Smecker-Hane, & Cecil 1996), NGC 4365, NGC 4406, NGC 5322 (Bender & Surma 1992), IC 1459, NGC 1374, NGC 4278 (van der Marel & Franx 1993), NGC 4816, and IC 4051 (Mehlert et al. 1998) all show line of sight kinematics similar to the line of sight velocity distributions of our models (though some of these galaxies are strong candidates for other scenarios that create counterrotation). In particular, we find amplitudes of and similat to those reported in the observational studies. This shows that major merger can produce remnants with the degree of skewness and kurtosis observed in counterrotating systems. We expect that as more galaxies are observed further examples with line of sight velocity distributions similar to ours will be found.
Also worth noting are the observations of NGC 253 by Anantharamaiah & Goss (1996) which found an orthogonally rotating core which was suspected to be caused by a merger event. One of our 1:1 merger models also produced an orthogonally rotating core (see Fig. 6).
4.1.3 Counterrotating populations
Early-type galaxies with extended counterrotating populations are rare but not unknown. Some of these systems may have formed by episodic galaxy building (Thakar & Ryden 1996), but others are harder to explain in this way. For example, NGC 4550 (Rubin et al. 1992) has counterrotating disks of comparable radial extent and luminosity; Pfenniger (1999) has proposed this galaxy formed by an in-plane merger of two disk galaxies. Our analysis of remnant H shows that a somewhat wider range of merger scenarios can produce counterrotating populations.
4.1.4 Rapid rotators
Barnes and Hernquist (1992) and Schweizer and Seitzer (1992), among others, have suggested that S0 galaxies could be made by mergers. Fisher (1997) has collected a sample of S0 galaxies with line of sight velocity distributions fit using Gauss-Hermite parameters. Comparing his observations to our simulations, we find a good match between Fisher’s parameters and the parameters for our disky 3:1 mergers. The overall shapes of the Gauss-Hermite parameters plotted on the major axis are remarkably similar, except that our rotation curve near the origin is less steep than the observed S0 galaxies, and some details near the center of our simulations (such as the first twist in the parameters) are not apparent in Fisher’s data.


Based on measurements of the ratio of mean velocity to velocity dispersion for a set of faint elliptical galaxies, Rix, Carollo, and Freeman (1999) have argued that these galaxies rotate too rapidly to be products of dissipationless mergers. When we compare these measurements to ratios we measured in our simulations (Fig. 14), we find that unequal-mass mergers can not only produce the same peak ratios but also produce the same relations between and radius. Moreover, both our results and the results of Rix, Carollo, and Freeman show similar ranges of maximum ratios, with values in the range of to . We conclude that unequal mass mergers can produce remnants with the dynamics, including the ratios, characteristic of these faint ellipticals. This result complements a recent study by Naab, Burkert, & Hernquist (1999), which finds that unequal-mass mergers can also produce the disky isophotes characteristic of faint ellipticals and S0 galaxies.
4.2 Summary
We have used Gauss-Hermite expansions to measure the line of sight velocity profiles of simulated merger remnants. Even relatively modest values of provide enough data to obtain significant detections of non-Gaussian profiles. Some key results are listed below.
1. Equal-mass merger remnants exhibit a variety of kinematic features rather than any single unique “merger signature”. However, certain features seem common to most of the remnants in our sample; these include slowly rotating inner regions, relatively flat dispersion profiles, off-axis dispersion peaks, and velocity distributions with broad leading and narrow trailing wings.
2. Unequal-mass merger remnants show much less variation in kinematic properties; instead, the larger disk often survives with only moderate damage. Such disk-dominated remnants are characterized by relatively rapid rotation, falling dispersion profiles, and velocity distributions with narrow leading and broad trailing wings. For mass ratios of 3:1, between half and three-fourths of the remnants in our study had strong disk-like kinematics.
3. Simulated remnants have many kinematic characteristics similar to those observed in early-type galaxies. For example, we described counterrotating populations, misaligned rotation, and kinematically decoupled cores resembling those reported in some elliptical galaxies, and rapid rotation consistent with faint ellipticals and S0 galaxies. However, our simulations don’t always match observed galaxies. For example, the mean velocity and parameters usually have opposite signs in luminous elliptical galaxies (eg. Bender, Saglia, & Gerhard 1994), while these parameters often have the same sign in our simulated remnants. More work needs to be done to examine the connections between simulated remnants and real galaxies; in particular, the effects of random viewing angles must be taken into account before definitive comparisons of models and observations are possible.
We thank Hans-Walter Rix and Andreas Burkert for stimulating discussions, and the referee for a prompt and helpful report. JEB acknowledges partial support from NASA grant NAG 5-8393.
References
- [Anantharamaiah 1996] Anantharamaiah, K. R. & Goss, W. M. 1996, ApJ, 466, L13
- [Balcells 1998] Balcells, M. & González, A. C. 1998, ApJ, 505, L109
- [Barnes 1988] Barnes, J. E. 1988, ApJ, 331, 699
- [Barnes 1992] Barnes, J. E. 1992, ApJ, 393, 484
- [Barnes 1998] Barnes, J. E. 1998, Galaxies: Interactions and Induced Star Formation, eds. D. Friedli, L. Martinet, & D. Pfenniger (Springer-Verlag, Berlin), p. 275
- [Barnes 1992] Barnes, J. E. & Hernquist, L. 1992, ARA&A, 30, 705
- [Bender 1994] Bender, R., Saglia, R. P., & Gerhard, O. E. 1994, MNRAS, 269, 785
- [Bender 1992] Bender, R. & Surma, P. 1992, A&A, 258, 250
- [Bertola 1988] Bertola, F., Buson, L. M., & Zeilinger, W. W. 1988, Nat, 335, 705
- [Dehnen 1993] Dehnen, W. 1993, MNRAS, 265, 250
- [Fisher 1997] Fisher, D. 1997, AJ, 113, 950
- [Freeman 1970] Freeman, K. 1970, ApJ, 160, 811
- [Franx 1991] Franx, M., Illingsworth, G., & de Zeeuw, T. 1991, ApJ, 383, 112
- [Governato 1993] Governato, F., Reduzzi, L., & Rampazzo, R. 1993, MNRAS, 261, 379
- [Hernquist 1990] Hernquist, L. 1990 ApJ, 356, 359
- [Hernquist 1992] Hernquist, L. 1992, ApJ, 400, 460
- [Hernquist 1993] Hernquist, L. 1993 ApJ, 409, 548
- [Hernquist 1991] Hernquist, L. & Barnes, J. E. 1991 Nature, 354, 210
- [Heyl 1994] Heyl, J. S., Hernquist, L., & Spergel, D. N. 1994, ApJ, 427, 165
- [Heyl 1996] Heyl, J. S., Hernquist, L., & Spergel, D. N. 1996, ApJ, 463, 69
- [Kormendy 1984] Kormendy, J. 1984, ApJ, 287, 577
- [Mehlert 1998] Mehlert, D., Saglia, R. P., Bender, R., & Wegner, G. 1998, A&A, 332, 33
- [Naab 1999] Naab, T., Burkert, A., & Hernquist, L. 1999, ApJ, 523, 133L
- [Pfenniger 1999] Pfenniger, D. 1999, Galaxy Interactions at Low and High Redshift, eds. J. E. Barnes & D. B. Sanders (Kluwer, Dordrecht), p. 157
- [Rix 1999] Rix, H.-W., Carollo, C. M., & Freeman, K. 1999, ApJ, 513, 25L
- [Schweizer 1992] Schweizer, F. & Seitzer, P. 1992, AJ, 104, 1039
- [Spitzer 1942] Spitzer, L. 1942, ApJ, 95, 329
- [Statler 1996] Statler, T. S., Smecker-Hane, T., & Cecil, G. N. 1996, AJ, 111, 1512
- [Thakar 1996] Thakar, A. R. & Ryden, B. S. 1996, ApJ, 461, 55
- [Toomre 1972] Toomre, A. & Toomre, J. 1972, ApJ, 178, 623
- [Tremaine 1994] Tremaine, S., Richstone, D. O., Byun, Y.-I., Dressler, A., Faber, S. M., Grillmair, C., Kormendy, J., & Lauer, T. R. 1994, AJ, 107, 634
- [van der Marel1993] van der Marel, R. P. & Franx, M. 1993, ApJ, 407, 525
- [White1983] White, S. D. M. 1983, ApJ, 274, 53