A 695-Hz quasi-periodic oscillation in the low-mass X-ray binary EXO 0748–676
Abstract
We report the discovery of a 695-Hz quasi-periodic oscillation (QPO) in data taken with the Rossi X-ray Timing Explorer of the low-mass X-ray binary (LMXB) EXO 0748–676. This makes EXO 0748–676 the second dipping LMXB, after 4U 1915–05, that shows kHz QPOs. Comparison with other sources suggests that the QPO corresponds to the lower frequency peak of the kHz QPO pair often observed in other LMXBs. The QPO was found in the only observation done during an outburst of the source in early 1996. This observation is also the only one in which the 1 Hz QPO recently found in EXO 0748–676 is not present.
1 Introduction
High frequency (kHz) quasi-periodic oscillations (QPOs) have been found in many neutron-star low-mass X-ray binaries (see van der Klis 2000 for a recent review). They are observed in the 300–1300 Hz range, and are often found in pairs with a nearly constant frequency separation of 250–350 Hz. In addition to kHz QPOs, some sources have shown slightly drifting oscillations in the 330–590 Hz range, during type-I X-ray bursts (Strohmayer, Swank, & Zhang 1998).
In this paper we present our search for both kHz QPOs and burst oscillations in the low-mass X-ray binary EXO 0748–676. This source shows periodic (P=3.82 hr) eclipses, irregular intensity dips, and type-I X-ray bursts (Parmar et al. 1986). From the eclipse duration a source inclination of 75∘ to 82∘ was derived (Parmar et al. 1986). Based on its bursting behavior (e.g. burst rate and peak flux vs. persistent flux; see Gottwald et al. 1986) EXO 0748–676 may be a member of the atoll class (Hasinger & van der Klis 1989) of the neutron-star low-mass X-ray binaries. Recently, a variable 0.58–2.44 Hz QPO was found by Homan et al. (1999). This QPO was found in all observations, except in the only observation during an outburst of the source (early 1996) observed with the Rossi X-ray Timing Explorer (RXTE), and is probably caused by an orbiting structure in the accretion disk, which modulates the radiation of the central source (Jonker et al. 1999; Homan et al. 1999).
2 Observations and Analysis
The data used in this paper were obtained with the Proportional Counter Array (PCA; Jahoda et al. 1996) onboard RXTE (Bradt, Rothschild, & Swank 1993), between March 12 1996 and October 11 1998. Most PCA observations were done in sets of five or six 2 ks segments that were centered around successive eclipses. Data of these five or six segments were taken together and treated as single observations, which resulted in a total of 20 observations. The times of the observations are indicated in Figure 1, which also shows the RXTE All Sky Monitor (ASM) light curve of EXO 0748–676. As can be seen, only the first observation was done during the early 1996 outburst of the source.

The PCA data were obtained in several different modes. The Standard 1 and 2 modes, which were always active, had 1/8 s time resolution in one energy channel (1–60 keV, representing the full energy range covered by the PCA), and 16 s time resolution in 129 energy bands (1–60 keV), respectively. In addition to the two Standard modes, another mode was always active which had a time resolution better than 1/8192 s in at least 32 energy channels (1–60 keV).
The Standard 2 data were used to produce light curves and hard color curves. The hard color was defined as the ratio of the count rates in the 6.3–11.7 keV and 5.2–6.3 keV bands; the light curves were produced in the 1.6–14.4 keV band, i.e. the energy band in which, during the first observation, the count rate spectrum of the source exceeded that of the background. Using the high time resolution data, 0.0625–2048 Hz power spectra were created in several energy bands to search for kHz QPOs. The power spectra were selected on time, count rate, or hardness, before they were averaged. The average power spectrum was rms renormalized (van der Klis 1995), and fitted (in the 100-1500 Hz range) with a constant for the Poisson level, and a Lorentzian for any QPO (only one QPO was found). Errors on the fit parameters were determined using (1, single parameter). As significance of each power spectral feature we quote the inverse relative error on the integrated power of each feature, as measured from the power spectrum. Note that the inverse relative error on the fractional amplitude (the parameter we give) is larger than the true significance by a factor 2. The energy dependence of the QPO was determined by fixing the frequency and width of the QPO to their values obtained in the band where the QPO was most significant (6.6–18.7 keV). Upper limits on kHz QPOs were determined in the 100–1500 Hz range by fixing the width of the QPO to 10, 20, 50 or 100 Hz, and using (95% confidence). Upper limits were only determined in the total (1–60 keV) band, and in the band where the detected QPO was most significant. To determine upper limits for oscillations in the type-I X-ray bursts, 2–1024 Hz power spectra were created. The width of the QPO was fixed to 2 Hz.
3 Results

| Selection | Values | Frequency (Hz) | FWHM (Hz) | rms amplitude (%) |
|---|---|---|---|---|
| Time (s) | ||||
| 0–2000 | 693.6 | 53 | 11.5 | |
| 2000–4200 | 696.1 | 15 | 172 | |
| 6000–7000 | 6983 | 18 | 193 | |
| 7000–7900 | 708 | 13 | 185 | |
| Count rate (cts/s) | ||||
| 285 | 692 | 15 | 152 | |
| 285 | 695.0 | 93 | 14.2 | |
| Hard Color | ||||
| 1.2 | 694 | 15 | 14.4 | |
| 1.2 | 694.2 | 9 | 14.8 |
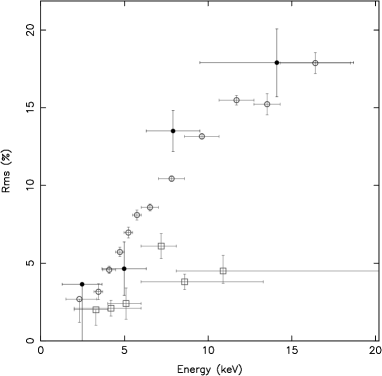
Our search for kHz QPOs in EXO 0748–676 resulted in only one significant detection: a 695 Hz QPO was found in the 1996 March 12 observation, the only observation done during the early 1996 outburst. In the 6.6–18.7 keV band, where it was found to be most significant, it had a frequency of 695.01.2 Hz, a full-width-at-half-maximum (FWHM) of 14 Hz, and an rms amplitude of 15.2% (6.0, single trial). The 6.6–18.7 keV power spectrum of the 1996 March 12 observation is shown in Figure 2. In the 1–60 keV band the QPO had a frequency of 693.0 Hz, a FWHM of 3.9 Hz, and an rms amplitude of 5.4% (3.7, single trial). The 1.6–14.4 keV light curve and the hard color curve of the 1996 March 12 observation are shown in Figure 3. In order to examine the variability of the QPO in the 6.6–18.7 keV band, selections were made on time, 1.6–14.4 keV count rate, and hard color. The selections for count rate and hard color were performed only for the data before the dip (). The results for the different selections are shown in Table 1. The QPO frequency increased slightly with time and perhaps count rate, but it did not depend on hard color. Note that the detection of the QPO in the dip, at 708 Hz, is only at a 1.8 significance level (in the 6.6–18.7 keV band). We made some subselections on the last time interval (which includes the dip) to test whether the QPO amplitude varied with decreasing count rate; only upper limits could be determined for those subselections, with values higher than obtained for the whole selection. The energy dependence of the QPO, in the part before the dip, was determined using four energy bands and is shown in Figure 4. The QPO energy spectrum is rather steep, with an upper limit of 3.6% in the lowest energy band and an rms amplitude of 18% in the highest energy band. For reasons of comparison we also plotted the energy dependence of the lower and upper kHz QPOs of 4U 1608–52 (Berger et al. 1996; Méndez et al. 1998; Méndez et al. 2000)

Upper limits (6.6–18.7 keV) on any second kHz QPO (as often observed in other low-mass X-ray binaries) were determined in the 100–1500 Hz range. They were 9.5%, 10.5%, 14.3%, and 16.7% rms, for fixed widths of 10 Hz, 20 Hz, 50 Hz, and 100 Hz, respectively. Since the frequency of the QPO varied little, the “shift and add” method (Méndez et al. 1998) could not usefully be applied. No 1 Hz QPO was found either, as was already reported by Homan et al. (1999). Upper limits (1–60 keV) are 7% rms in the 0.001–1 Hz range, 2% rms in the 1–10 Hz range, and 4% rms in the 10–50 Hz range.
For the other observations only upper limits to the presence of a kHz QPO could be determined. This was done in the 1–60 keV and 6.6–18.7 keV bands. The upper limits are given in Table 2, for four different fixed widths. Most of the upper limits are comparable to or larger than the values found for the QPO in the 1996 March 12 observation, and therefore not very constraining. Note that the count rate in these observations was a factor 2 to 3 smaller than that during the 1996 March 12 observation, resulting in a greatly reduced sensitivity. A similar kHz QPO as the one seen there would, when present, be significant only at a level. In all these observations a 1 Hz QPO was found, with a frequency between 0.4 and 3 Hz.
Ten type-I X-ray burst were observed, and they were examined for the presence of burst oscillations. This was done in the 100–1000 Hz frequency range, for a fixed width of 2 Hz. None were found, with upper limits during the rise of the burst between 4% and 11% rms in the 1–60 keV band, and between 6% and 14% rms in the 6.6–18.7 keV band. This is well below the amplitudes of burst oscillations observed in some other sources (e.g. Strohmayer et al. (1998); see also van der Klis 2000 and references therein). It should be noted that the rise times of the bursts were rather long, between 2 and 12 s. This could be an indication for the presence of a scattering medium surrounding the neutron star, which might wash out the rapid burst oscillations. The 1 Hz QPO was observed in all the bursts (see also Homan et al. 1999).
4 Discussion
| Energy band (keV) | rms amp. (%) | rms amp. (%) | rms amp. (%) | rms amp. (%) |
|---|---|---|---|---|
| FWHM=10 Hz | FWHM=20 | FWHM=50 | FWHM=100 | |
| 1–60 | 6.4–13.9 | 9.4–14.9 | 10.7–17.6 | 11.6–21.7 |
| 6.6–18.7 | 6.3–13.6 | 6.6–16.3 | 8.2–19.5 | 9.2–23.0 |
The properties of the 695 Hz QPO are similar to those of the kHz QPOs in atoll sources; the QPO is relatively narrow (5–18 Hz) and has an rms amplitude of 6.5% (1–60 keV, outside the dip). Since only a single peak is observed, we can not tell whether it corresponds to the lower or the upper peak of a kHz QPO pair. However, comparison with kHz QPOs in atoll sources (see van der Klis 2000) suggests that the observed QPO is the lower QPO of a kHz pair, for the following reasons: (1) of the 11 kHz QPO pairs found in atoll sources, 8 have ranges of lower peak frequencies that include 695 Hz, which is the case for only 3 of the upper peaks. (2) The upper peaks in atoll sources have widths in the 50–200 Hz range, although occasionally peaks with widths of only 10 to 20 Hz have been observed. On the other hand, the 4–18 Hz width we find is much more common for lower peaks. (3) When comparing the energy dependence of the QPO with that of the two kHz peaks in 4U 1608–52, which have rather different energy dependencies (Berger et al. 1996; Méndez et al. 1998; Méndez et al. 2000), we find that it was very similar (i.e. steep) to that of the lower peak (see Figure 4). Hence three of the QPO properties hint towards the QPO being the lower peak.
The properties of the QPO varied on a time scale of a few s, as can be seen from Table 1. Comparing the first time selection with the second, one can see that a relatively small frequency change is accompanied by a factor 3 (2) increase in width, and an almost 50% (2) increase in fractional rms amplitude.
The other source in which only a single kHz QPO has been observed is XTE J1723–376 (Marshall & Markwardt 1999). However, most sources in which kHz QPO pairs have been found, have at times also shown single kHz QPOs. The fact that EXO 0748–676 and XTE J1723–376 have only shown single kHz QPOs is therefore most likely a matter of a small amount of data and coincidence.
With EXO 0748–676 is probably the source with the highest inclination angle of the 20 sources that have shown kHz QPOs. Twin kHz QPOs were already found in 4U 1915-05 (Barret et al. 1997, 2000; Boirin et al. 2000), a source that also shows dips (but no eclipses, which for a similar mass ratio would imply a lower inclination than EXO 0748–676). The fact that kHz QPOs are found over a large range of inclinations means that the radiation modulated by the kHz QPO mechanism should to a large extent be isotropic. The kHz QPO was detected during the dip, but at a significance of only 1.8. This means that with 90% confidence we can say that either the source producing the kHz QPO was not fully covered by the dipping material, or that a considerable amount of the modulated radiation went through the dipping material unperturbed, indicating that it has a scattering optical depth of at most a few. Also, the fact that the rms amplitude changes only a little in the dip suggests that the kHz QPO and the bulk of the flux are produced at the same site.
The outburst of EXO 0748–676 in early 1996 (see Fig. 1) may have been a transition from the island state to the banana state, and back, as is common for atoll sources. In addition to the increase in count rate, there are several power spectral properties that seem to confirm this idea: (1) The strength of 0.1–1.0 Hz noise during the outburst was lower than in the non-outburst observations (see Homan et al. 1999). Most atoll sources show a decrease of the noise strength when they move from the island to the banana state (Hasinger & van der Klis 1989). (2) The 1 Hz QPO was not observed during the only outburst observation. In 4U 1746–37, one of the other two sources were a similar 1 Hz QPO was found, the QPO was observed only in the island state, and not in the banana state (Jonker et al. 2000). (3) Although there are a few exceptions, in most atoll sources kHz QPOs are found only in the lower banana state (van der Klis 2000).
We find the kHz QPO in the only observation where the 1 Hz QPO was absent. The 1 Hz QPO is thought to be due to obscuration of the central source by an orbiting structure in the accretion disk at a distance of 1000 km from the central source (Jonker et al. 1999; Homan et al. 1999). It is interesting to see that in two of the sources were the 1 Hz QPOs are found, they are not observed in the banana state, indicating a change in the accretion disk geometry (at least in the area where the 1 Hz QPO is formed). This, together with the fact that in most atoll sources kHz QPO are only found in the banana state, suggests that changes in the accretion disk geometry (at 1000 km from the central source) may affect the production of kHz QPOs close to the central source.
References
- (1)
- (2) Barret, D., Olive, J. F., Boirin, L., Grindlay, J. E., Bloser, P. F., Chou, Y., Swank, J. H., Smale, A. P. 1997, IAU Circ., 6793
- (3)
- (4) Barret, D., Olive, J. F., Boirin, L., Done, C., Skinner, G. K., Grindlay, J. E. 2000, ApJ, in press, astro-ph/9911042
- (5)
- (6) Berger, M., et al. 1996, ApJ, 469, L13
- (7)
- (8) Boirin, L., Barret, D., Olive, J. F., Grindlay, J. E., Bloser, P. F. 2000, A&A, submitted
- (9)
- (10) Bradt, H. V., Rothschild, R. E., & Swank, J. H. 1993, A&AS, 97, 355
- (11)
- (12) Gottwald, M., Haberl, F., Parmar, A. N., & White, N. E. 1986, ApJ, 308, 213
- (13)
- (14) Hasinger, G. & van der Klis, M. 1989, A&A, 225. 79
- (15)
- (16) Homan, J., Jonker, P. G., Wijnands, R., van der Klis, M., & van Paradijs, J. 1999, ApJ, 516, L91
- (17)
- (18) Jahoda, K., Swank, J. H., Giles, A. B., Strohmayer, T., Zhang, W., & Morgan, E. 1996, Proc. SPIE, 2808, 59
- (19)
- (20) Jonker, P. G., Van der Klis, M., & Wijnands, R. 1999, ApJ, 511, L41
- (21)
- (22) Jonker, P. G., van der Klis, M., Homan, J., Wijnands, R., van Paradijs, J., Méndez, M., Kuulkers, E., & Ford, E. C. 2000, ApJ, in press, astro-ph/9910159
- (23)
- (24) Marshall, F. E. & Markwardt, C. B. 1999, IAU Circ., 7103
- (25)
- (26) Méndez, M., van der Klis, M., van Paradijs, J., Lewin, W. H. G., Vaughan, B. A., Kuulkers, E., Zhang, W., Lamb, F. K., & Psaltis., D. 1998, ApJ, 494, L65
- (27)
- (28) Méndez, M., et al. 2000, in prep.
- (29)
- (30) Parmar, A. N., White, N. E., Giommi, P., & Gottwald, M. 1986, ApJ, 308, 199
- (31)
- (32) Strohmayer, T. E., Swank, J. H., Zhang, W. 1998, in Proceedings of the Symposium ”The Active X-Ray Sky: Results from BeppoSAX and Rossi-XTE”, Rome, Italy, 21-24 October, 1997, Nuclear Physics B Proceedings Supplements. Eds. L. Scarsi, H. Bradt, P. Giommi, and F. Fiore
- (33)
- (34) Strohmayer, T. E., Zhang, W., Swank, J. H., White, N. E., & Lapidus, I. 1998, ApJ, 498, L135
- (35)
- (36) van der Klis, M. 1995, in “The Lives of the Neutron Stars”, proceedings of the NATO Advanced Study Institute on the Lives of the Neutron Stars, held in Kemer, Turkey, August 29-September 12, 1993. Eds. M.A. Alpar, U. Kiziloglu, and J. van Paradijs
- (37)
- (38) van der Klis, M. 2000, ARA&A, submitted, astro-ph/0001167
- (39)