New Evidence for the Complex Structure of the Red Giant Branch in Centauri11affiliation: Based on observations collected at ESO, La Silla, Chile
Abstract
We report on the complex structure of the red giant branch (RGB) of Cen, based on a new wide field and wide color baseline and photometry. Our color magnitude diagram (CMD) shows the presence of multiple populations along this branch, in particular we discovered an anomalous branch (RGB-a), which appears to be well separated from the bulk of the RGB stars. On the basis of our CMD and from the previous literature we conclude that (1) these stars, clearly identified as a separate population in our CMD, represent the extreme metal rich extension () of the stellar content of Cen, and show anomalous abundances of s-process elements (as and ) as well; (2) they are physical members of the Cen system; (3) they comprise of the stars of the whole system; (4) this component and the metal-intermediate one () have been found to share the same spatial distribution, both of them differing significantly from the most metal poor one (). This last evidence supports the hypothesis that metal rich components could belong to an independent (proto?) stellar system captured in the past by Cen.
Subject headings:
Globular clusters: individual ( Cen); stars: evolution —1. Introduction
The globular cluster Centauri (NGC 5139) is the most luminous and massive object among the Galactic Globular Clusters (GGC), and surely the most peculiar one in terms of structure, kinematics and stellar content. It is the most flattened GGC, displaying also a decrease of ellipticity in the most internal region (Geyer, Nelles & Hopp 1983 - GNH83), and it has a significant rotation (Merrit, Meylan & Mayor 1997).
The most interesting anomaly is its chemical inhomogeneity (first revealed by Dickens and Woolley 1967 and spectroscopically confirmed by Freeman & Rodgers 1975); since then a number of extensive spectroscopic surveys (Norris, Freeman & Mighell 1996 - NFM96, Suntzeff & Kraft 1996 - SK96) have shown that Cen is the only GGC for which a multi-component heavy element distribution has been identified. Although SK96 found a single peaked distribution with an extended tail towards high metallicities, NFM96 showed that the distribution is at least bimodal with a main metal poor component at , a second smaller peak at , and a long tail extending up to . Furthermore, the most metal rich stars () have been found to be more centrally concentrated than the bulk of the cluster population (Norris et al. 1997 - N97, and SK96). It has also been suggested that the kinematical properties (N97) and the spatial distribution of the two metallicity groups differ significantly (N97, Jurcsik 1998 - J98). This puzzling scenario has usually been explained either in terms of self-enrichment processes (Freeman 1993) and/or merging events (N97, J98).
As part of a long term project specifically devoted to the study of the global stellar population in a sample of GGCs, we obtained wide field , photometry in Cen. The complete data set will be presented in a forthcoming paper, while in this letter we concentrate on the complex structure of the RGB.
2. The RGB of Cen
The data have been obtained on January 1999 and July 1999 at the 2.2m ESO-MPI telescope at La Silla (Chile), using the Wide Field Imager (WFI) which has a total field of view of . The images were taken through the filter and , a Medium Band Filter (cf. WFI@2.2 Manual) which avoids the most pronounced atmospheric emission lines. After applying the standard bias and flat field correction, we used DAOPHOT II and the psf-fitting algorithm ALLSTAR (Stetson 1994) for the stellar photometry. The photometric calibration was performed using 50 photoelectric standard stars in the selected areas SA98 and SA95 (Landolt 1992).

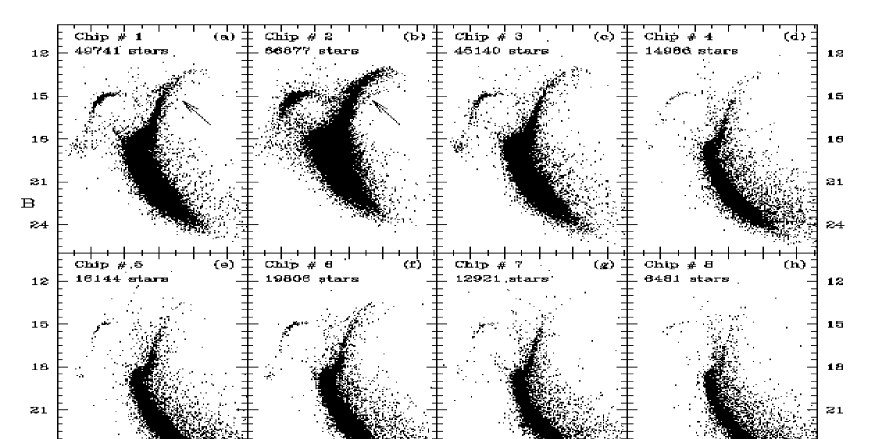
Figure 1 shows the CMDs for each of the 8 WFI chips separately. The cluster center is roughly centered on chip . More than 220,000 stars have been plotted in Figure 1: to our knowledge, this is the largest stellar sample ever observed in Cen. The most striking feature of the CMDs presented in Figure 1 is the existence of a complex structure in the brighter part of the Red Giant Branch (RGB): at least two main components are visible.
Particularly notable is the presence of a narrow sequence, significantly redder and more bent than the bulk of the “main” RGB stars, which we call the anomalous RGB (hereafter RGB-a). Note that the RGB-a is visible only in the CMD from chip #2 (where the cluster center is located) and to a much lesser extent in the nearby chip #1 and possibly #3 (see the arrows in Figure 1(a),(b)). We shall come back to the spatial distribution of the RGB stars in the next Section. While we are writing this Letter, a CMD showing the same RGB structure has been published by Lee et al. (1999): the reality of this feature is thus confirmed by two independent surveys based on different photometric systems.
The morphology of the RGB-a and its position in the CMD strongly suggests that it must be populated by stars much more metal rich than the Cen bulk population. We can directly check this hypothesis using the catalog by NFM96 (kindly provided by J. Norris). We have cross-identified the stars in our catalog and in the NFM96 one, and marked the common stars in Figure 2 (panel (a)) using different symbols for different metallicities (see figure caption).
Six stars belonging to the RGB-a are in common with the NFM96 sample (namely stars , , , , , , adopting the Woolley 1966 nomenclature): these stars have . They are the most metal rich stars in the NFM96 catalog, though they do not correspond to any of the peaks shown in the NFM96 distribution (e.g. their Figure 12). Figure 2 suggests that the RGB-a represents an additional, very metal rich component, located at the extreme tail of the abundance distribution in Cen. Moreover, the large color baseline of the present survey allows us to clearly separate the most metal rich component from the remaining Cen RGB stars and, thus, to estimate its contribution to the global population of the cluster. By comparing the star counts along the RGBs, in the same magnitude range (), we find that the RGB-a represents of the whole stellar content. It is important to note that the six RGB-a stars for which we know the radial velocities from the Mayor et al. (1997) catalog (kindly provided by G. Meylan) have = . This value is fully compatible with the mean value for the 471 stars in the Mayor et al. (1997) catalog, showing that the RGB-a stars are indeed members of the Cen system (see also Lloyd Evans, 1983 - LE83).
To further investigate the distribution of the RGB stars in the CMD, we computed the distance of each of them from the mean ridge line of the main metal poor component (MP-MRL) in several magnitude bins. The MP-MRL has been obtained following the procedure described in Ferraro et al. (1999a). A preliminary selection of the stars belonging to the bluest ridge of the RGB (excluding HB, AGB, and the reddest RGB components) has initially been performed by eye. Then we fitted the selected stars with polynomials, and the procedure was iterated (each time, rejecting all stars at from the best fit line), until the result was considered acceptable. In doing this, we used the CMD, since in this plane the upper part of the RGB is less bent than in , and a low order polynomial excellently reproduces the RGB shape.
Then we defined the observable as the geometrical distance of each star from the adopted MP-MRL. The distribution of for the RGB stars in the magnitude range is plotted in Figure 2 (panel (b)). Positive and negative values of are assumed for stars redder and bluer than the MP-MRL, respectively. The distribution is clearly asymmetric; besides the main peak, secondary peaks are well visible. The estimated typical abundances for the different components [as in panel (a)] are marked in panel (b). Four different components can be identified in Figure 2. They can be grouped in three main samples as follows: (i) RGB-MP for the most metal poor component, at ; (ii) RGB-MInt for the metal intermediate component: this sample includes the secondary peak () in Figure 2(b), which corresponds to , and the metal rich tail (), corresponding to ; (iii) RGB-a for the extreme metal rich component, at in Figure 2(b), i.e. , clearly separated from the other stellar populations. The first two components correspond to the peaks visible in Figure 12 in NFM96, while the RGB-a is a third, new component of the stellar population of Cen (see also Lee et al. 1999).
To better describe the characteristics of the “multiple” Cen RGB in terms of the “classical” abundance parameter , we used a set of 60 giants in our sample which have both (from NFM96) and abundances (from SK96, kindly provided by N. Suntzeff). From these, we derived an empirical relation linking the calcium abundance to iron, in terms of on the Zinn & West (1984) scale. The procedure yields the following results for the four peaks labeled in Figure 2 (panel(b)): and , respectively.
It is interesting to note that the spectra of all of the six metal rich stars quoted above exhibit strong lines, and the brightest three (namely , and ) show also strong bands (LE83), a very unusual occurrence for globular cluster giants. The fact that high metallicity giants have strong lines fully agrees with the increase of the ratio with metallicity found by Norris & Da Costa (1995), and suggests that intermediate mass () stars may have contributed significantly to the enrichment of the material from which RGB-a stars formed 111Both and are elements produced by neutron s-capture processes. s-process elements are brought up to the surface during the third dredge up occurring at late stages of the asymptotic giant branch (AGB) evolutionary phase of intermediate mass stars (see the discussion in Smith, Cunha & Lambert 1995). However LE83 noted that s-element rich giants in Cen show different characteristics with respect to normal AGB stars and first suggested that the anomalous s-elements enrichment could be primordial.. This, in turn, implies a significant delay () between the formation of the stellar population that enriched the medium and the one associated with RGB-a (Norris & Da Costa 1995, Lee et al. 1999).
3. Spatial distribution anomalies
The correlation between metal content and kinematics found by N97, and the spatial asymmetry between metal rich and metal poor bright red giants found by J98, are a possible evidence of a past merging event, in which a small metal rich object has been captured by a larger system, mainly metal poor. Note that none of the quoted studies have identified the RGB-a as a distinct population, since only a few stars belonging to this branch have been measured by NFM96 and listed by J98. The discovery of a population so clearly separated from the main branches makes the hypothesis that Cen hosts an external population captured in the past more and more appealing, even if it is worth noticing, according to note 3 by N97, that neither the large metal spread nor the s-process abundances can be easily explained in terms of a simple merging event between ordinary globular clusters.
These considerations prompted us to investigate the spatial distribution of the three RGB components, taking advantage of our photometric sample, which is much larger () and more complete than the N97 and J98 ones.
As a first step, we evaluated the centroid of the stars of the entire sample; by adopting the procedure described in Montegriffo et al. (1995) and Ferraro et al. (1999b), we found it to be at pixel . The centroids of all three of the RGB components appear to coincide within the observational errors.
Then, we investigated the radial distributions; special care has been devoted to avoid contamination by the field population which can affect the radial trend, expecially in the lower density external region. To this purpose, we limited our analysis to the most internal region (), and to the brighter portion () of the RGB, which is expected to be little contaminated. The comparison of the cumulative radial distributions for the selected RGB samples shows that the RGB-MInt and RGB-a stars have a very similar distribution, and both seem to be more concentrated than the RGB-MP. A KS test gives an probability that the radial distribution of the coadded (RGB-MInt RGB-a) sample and the RGB-MP sample are drawn from the same parent distribution. Although this evidence is marginal, it is in good agreement with that found by N97. Still, this simple radial distribution analysis implicitly assumes that the three populations are distributed with the same (spherical) geometry. In view of the strong ellipticity of Cen, we decided to follow an alternative approach.
In order to avoid the sparsely populated outer regions, we divided the central region of the cluster ( from the center) into a grid of square boxes, each pixels wide. Inside each box, we counted the number of stars belonging to the different samples (, and , respectively), thus obtaining a density map for each component. The resulting isodensity contour maps, down to a fixed density limit (4 stars per box), are shown in Fig. 3. The distributions of the RGB-a sample (heavy solid lines in panel (a)) and of the RGB-MInt (heavy solid lines in panel (b)) are compared with the RGB-MP distribution (light dashed lines in both panels). The elongation of the RGB-MP isopleth along the X-axis is clearly visible, reflecting the well known elliptical shape of the whole system: our X-axis is approximately oriented along the E-W direction, i.e., the major axis of the cluster. It is worth noticing that the ellipticity for the RGB-MP component turns out to be , even in the most internal region of the cluster (). On the other hand, both the RGB-a and RGB-MInt isopleth show a very different direction of maximum elongation, nearly perpendicular to the RGB-MP one (i.e., along the N-S direction). Furthermore, a very peculiar substructure is visible in the RGB-a contours (see panel(a)), resembling the tidal tails which should be expected to form around a disrupting stellar system (e.g., Meylan, Leon & Combes 1999).

We took advantage of the fact that the major axis of the RGB-MP ellipsoid is nearly oriented along our X-axis, while the RGB-MInt and RGB-a ones are nearly oriented along the Y-axis. We can thus study the distribution along the two main symmetry axes by simply comparing the distributions along our X and Y coordinates with respect to the the common centroid. The main results of this analysis are: (1) the RGB-MP sample is significantly more concentrated in the Y direction than in X (confidence level , according to a KS test), as expected for an ellipsoid elongated in the X-axis direction; (2) the RGB-MInt and RGB-a do not share the elongation in the X direction of the RGB-MP stars, and look more elongated in Y than the RGB-MP ones (c.l. ); (3) Fig. 3 (panel (b)) suggests that the RGB-MInt stars distribution is strongly asymmetric along the Y-axis, being more elongated towards the North direction.
These results could help to shed some light on previous puzzling evidence. In particular: point (1) and (2) could explain the decrease of ellipticity in the inner of the cluster reported by GNH83, and point (3) could help to understand the bizarre spatial asymmetry found by J98.
Furthermore, the similarity in the spatial distributions may indicate a physical association between the RGB-a and RGB-MInt, while the differences shown in Figure 3 suggest a different origin of these two components with respect to the main metal poor one (RGB-MP). If this result finds additional support, and the primordial origin of the s-elements found in the RGB-a stars is definitely established, then the RGB-a and RGB-MInt populations can be interpreted as two successive phases of the self-enrichment history of an independent stellar system (a giant molecular cloud or a gas rich protocluster), now sunk into the center of Cen.
In conclusion, we can say that the observational evidence discussed in this Letter seem to suggest that both self-enrichment processes and a merging event should be invoked to explain the complex structure of the RGB in Cen.
References
- (1)
- (2) Dickens, R.J., Woolley, R.v.d.R., 1967, R. Obs. Bull., No. 128
- (3)
- (4) Ferraro, F.R., Messineo, M., Fusi Pecci, F., De Palo, M.A., Straniero, O., Chieffi, A., Limongi, M., 1999a, AJ, 118, 1738
- (5)
- (6) Ferraro, F.R., Paltrinieri, B., Rood, R.T., Dorman, B., 1999b, ApJ, 522, 983
- (7)
- (8) Freeman, K.C., Rodgers A.W. 1975, ApJ, 201, L71
- (9)
- (10) Freeman, K.C., 1993, ASP Conf. Ser., 48, 608
- (11)
- (12) Geyer, E.H., Nelles, B., Hopp, U., 1983, A&A, 125, 359 (GNH83)
- (13)
- (14) Jurcsik, J., 1998, ApJ, 506, L113 (J98)
- (15)
- (16) Landolt, A.U., 1992, AJ, 104, 340
- (17)
- (18) Lee Y-W., Joo, J-M., Sohn, Y-J., Rey, S-C., Lee, H-c., & Walker, A.R., 1999, Nature, 402, 55
- (19)
- (20) Lloyd Evans, T., 1983, MNRAS 204, 975
- (21)
- (22) Mayor, M., et al., 1997, AJ, 114, 1087
- (23)
- (24) Makino, J., Akiyama, K., Sugimoto, D., 1991, Ap&SS, 185, 63
- (25)
- (26) Meylan, G., Leon, S., Combes, F., 1999, in Star-Way to the Universe, L. Pasquini and R.P. Kudritzki Eds., Berlin: Springer, in press (astro-ph/9912041)
- (27)
- (28) Merrit, D., Meylan, G., Mayor, M., 1997, AJ, 114, 1074
- (29)
- (30) Montegriffo, P., Ferraro F.R., Fusi Pecci, F., Origlia, L., 1995, MNRAS, 276, 739
- (31)
- (32) Norris, J.E. & Da Costa, G. S. 1995, ApJ, 447, 680
- (33)
- (34) Norris, J.E., Freeman, K.C. & Mighell, K.L., 1996, ApJ, 462, 241 (NFM96)
- (35)
- (36) Norris, J.E., Freeman, K.C. Mayor, M., & Seitzer, P., 1997, ApJ, 487, L187 (N97)
- (37)
- (38) Smith, V.V., Cunha, K., Lambert, D.L., 1995, AJ, 110, 2827
- (39)
- (40) Stetson. P.B., 1994, PASP, 106, 250
- (41)
- (42) Suntzeff, N.B., & Kraft R.P., 1996, AJ, 111, 1913 (SK96)
- (43) Woolley, R., 1966, Royal Obs. Ann. London, No 2.
- (44)
- (45) Zinn, R.J, & West, M.J., 1984, ApJS, 55, 45