THE HII REGION KR 140: SPONTANEOUS FORMATION OF A HIGH MASS STAR
Abstract
We have used a multiwavelength data set from the Canadian Galactic Plane Survey (CGPS) to study the Galactic HII region KR 140, both on the scale of the nebula itself and in the context of the star forming activity in the nearby W3/W4/W5 complex of molecular clouds and HII regions. From both radio and infrared data we have found a covering factor of about 0.5 for KR 140 and we interpret the nebula as a bowl-shaped region viewed close to face on. Extinction measurements place the region on the near side of its parent molecular cloud. The nebula is kept ionized by one O8.5 V(e) star, VES 735, which is less than a few million years old. CO data show that VES 735 has disrupted much of the original molecular cloud for which the estimated mass and density are about 5000 and 100 cm-3, respectively. KR 140 is isolated from the nearest star forming activity, in W3. Our data suggest that KR 140 is an example of spontaneous (i.e., non-triggered) formation of, unusually, a high mass star.
1 INTRODUCTION
Massive OB stars are almost always found in clusters. In fact, accumulating observational evidence suggests that most stars, regardless of mass, actually form as members of some kind of group, cluster, or association. While there has been a lot of work to understand the processes involved in the formation of a single star (e.g., Shu, Adams, & Lizano 1987), theories of cluster formation are still in their infancy (see the recent reviews by Elmegreen et al. 2000, and Clarke, Bonnell & Hillenbrand 2000). Nevertheless, many important issues have already been identified. Foremost among these is the question of whether the formation of clusters, particularly ones with OB stars, are triggered by an external agent (Elmegreen 1992) such as expanding HII regions (Elmegreen & Lada 1977), or colliding molecular clouds (Loren 1976, 1977; Scoville, Sanders & Clemens 1986; Usami, Hanawa, & Fujimoto 1995). Despite triggered or sequential star formation being theoretically and intuitively appealing, a major problem is to determine unambiguously a cause and effect relationship, because of the long time scales (and time lags) of the processes involved. There is observational evidence for regions that have had triggered star formation, both on large scales (e.g., IC 1396, Patel et al. 1998) and on small scales (e.g., IC 1805, Heyer et al. 1996). However, there are other young star forming regions, like Taurus, where no evidence of a trigger can been found. These are often in modest-sized molecular clouds and contain only lower mass stars.
The Perseus Arm star forming regions W3/W4/W5 (Westerhout 1958) have been studied extensively over the last twenty years (e.g., Lada et al. 1978; Braunsfurth 1983; Digel et al. 1996; Normandeau, Taylor & Dewdney 1997; Heyer & Terebey 1998). They are often considered to be the archetypical examples of how the formation of massive star clusters can be triggered by the influence of other nearby clusters. For example, W3 is thought to be have been triggered by the expansion of W4 (Dickel 1980; Thronson, Lada, & Hewagama 1985; van der Werf & Goss 1990) and there is evidence that the expansion of W5 is also triggering star formation (Vallée, Hughes, & Viner 1979; Wilking et al. 1984).
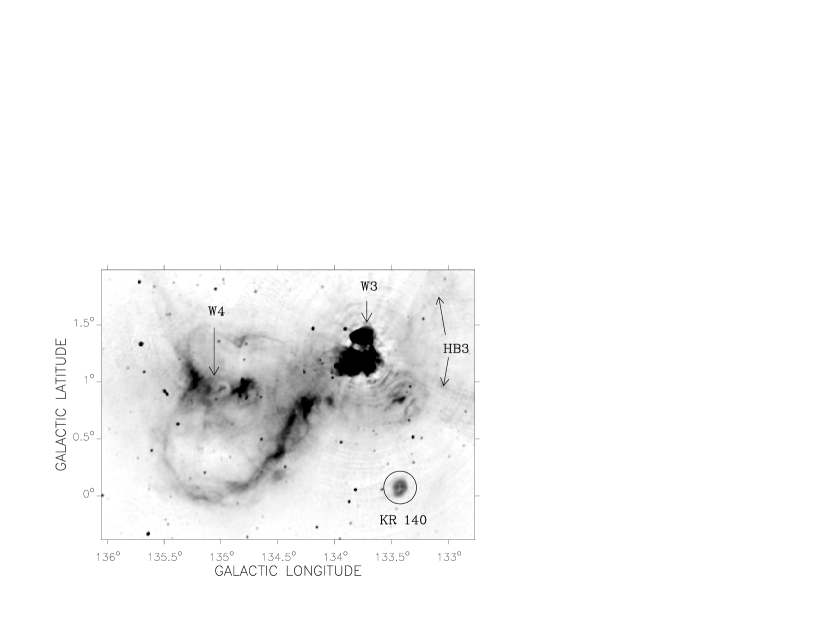
In new high resolution multiwavelength (radio and mid-infrared) data of the W3/W4/W5 complex from the Canadian Galactic Plane Survey (CGPS; English et al. 1998) we have identified a star forming region containing a single O star. Figure 1 shows a 1420 MHz continuum image from the CGPS pilot project (Normandeau et al. 1997). The circled area is the HII region in question, KR 140 (, ; Kallas & Reich 1980). This region appears to be completely separate from the vigorous star formation going on nearby in W3, although it is in the same Perseus arm molecular complex (see context in CO images in Heyer et al. 1998). What is unusual is that this massive star seems to have been formed spontaneously.
In this paper we present and analyze the multiwavelength data on KR 140 in order to quantify the properties of this region of spontaneous massive star formation. As described in § 2 these data have sufficient resolution (1′) to resolve this HII region for the first time and reveal a fairly symmetrical structure. Based on first impressions, we thought that KR 140 might prove to be a “textbook” spherical HII region. Instead, we find that KR 140 is likely a bowl-shaped HII region (an example of a blister geometry: Israel 1978, Yorke et al. 1989; § 3 and § 4.2.2, § 6.4). We have found that the HII region is kept ionized by an O8.5V(e) star, VES 735, and is at a distance of 2.30.3 kpc from the Sun (Kerton et al. 1999).
We analyze the ionized component of KR 140 in § 4 and make various estimates of the age in § 5. The dust, molecular, and atomic components of KR 140 are examined in § 6, § 7, and § 8, respectively. In § 9 we discuss star formation in KR 140 in the context of the Perseus arm and the possible accompanying cluster.
2 THE MULTIWAVELENGTH DATA
KR 140 was initially cataloged in a 1420 MHz radio continuum survey of the northern Galactic plane with the Effelsberg 100 m telescope by Kallas & Reich (1980). At the available resolution of 9′ KR 140 was barely resolved, with a reported diameter of about 11′. Although KR 140 was measured in other subsequent single-dish surveys (§ 4.2) it had never been examined with a radio interferometer to provide the angular resolution necessary for the present study.
The data analyzed here include 1420 MHz ( 21 cm) and 408 MHz ( 74 cm) continuum images from the Dominion Radio Astrophysical Observatory (DRAO) Synthesis Telescope (Roger et al. 1973; Veidt et al. 1985). An HI 21-cm line data cube is also available, with spectral resolution 2.64 km s-1 and channel spacing 1.65 km s-1. These DRAO data were obtained during the pilot project of the CGPS (Normandeau et al. 1997), and made into a full 8 mosaic of the W3/W4/W5 star forming regions.
We also made use of a CO (, 115 GHz, 2.60 mm, spectral resolution 0.98 km s-1) data cube from the Five Colleges Radio Astronomy Observatory (FCRAO) obtained in the complementary survey described by Heyer et al. (1998). To examine the dust components we processed Infrared Astronomical Satellite (IRAS) data to make HIRES mosaics at 12, 25, 60, and 100 m. Independent processing of the entire Galactic plane data at 60 and 100 m has been released as the IRAS Galaxy Atlas (IGA, Cao et al. 1997) and we have completed a complementary project at 12 and 25 m (Mid-Infrared Galaxy Atlas, MIGA, Kerton & Martin 2000).
An important feature for subsequent analysis with these data sets is the common relatively high angular resolution achieved. The DRAO synthesis telescope images have a resolution of at 1420 MHz (the 408 MHz DRAO data have proportionately 3.5 times lower resolution), and the CO images are at a resolution of 50′′ (beam sampled). The HIRES images have non-circular beams of size about 2′ at 100 m, 1′ at 60 m, and somewhat less at 12 and 25 m. For detailed intercomparison, pairs or groups of images have been convolved to the same beam shape.
3 A MODEL FOR THE 3-DIMENSIONAL MORPHOLOGY
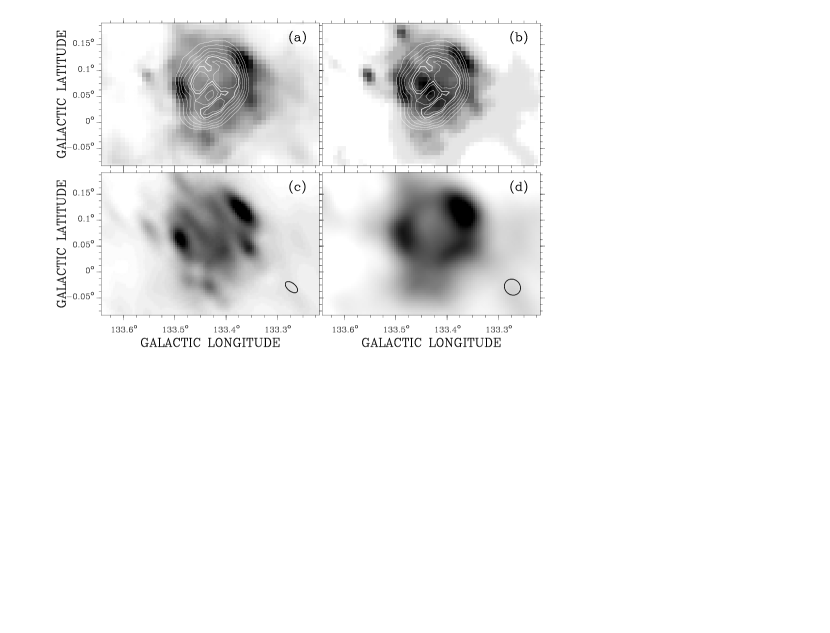
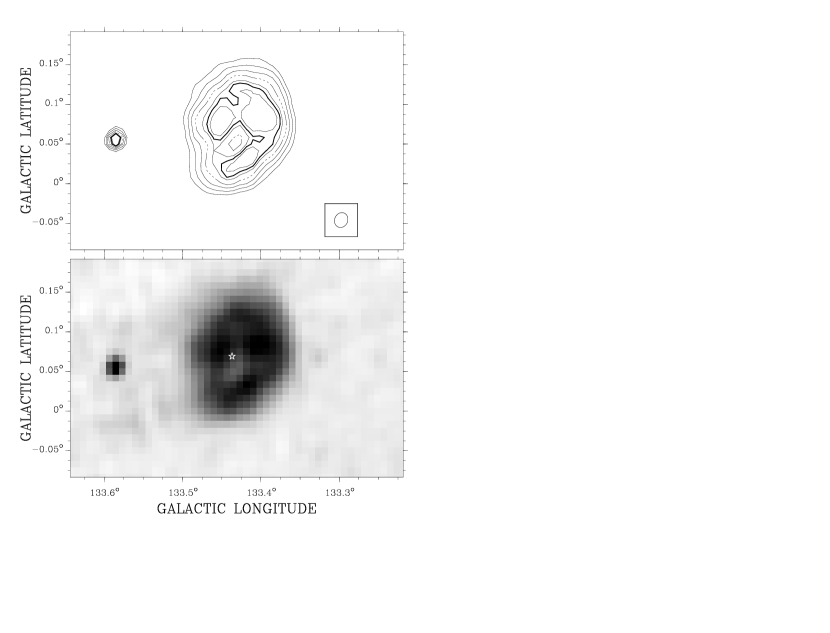
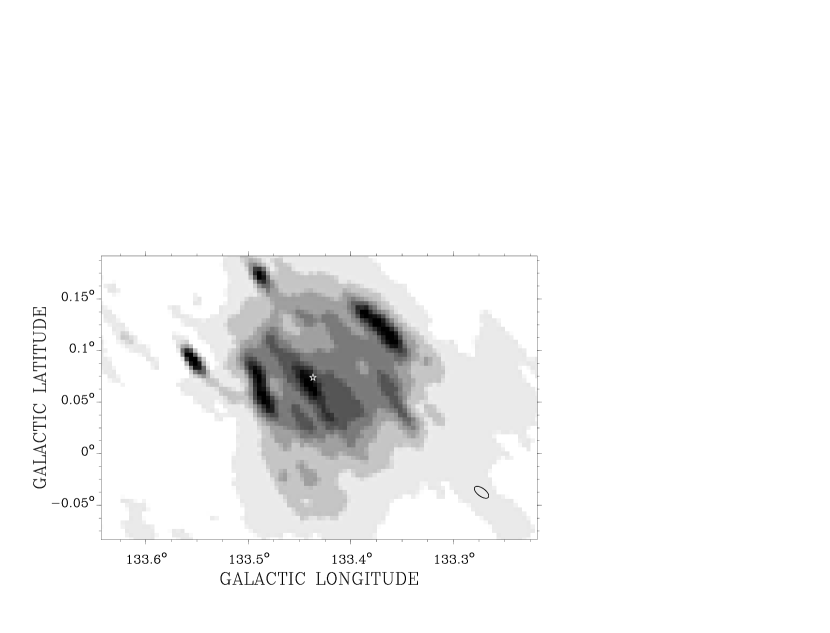
Analysis of an HII region benefits from a knowledge of its three-dimensional structure, but often the observed two-dimensional morphology is too complex to interpret. Fortunately, this is not the case for KR 140. Figure 2 shows the four HIRES images of KR 140 at 12, 25, 60, and 100 . As discussed in § 6, the 100 image best describes the dust distribution in KR 140. The 100 HIRES image (Figure 2d) shows that most of the dust in the nebula has been swept into a shell-like structure and that we are observing a region which is close to being circularly (axially) symmetric. In the 1420 MHz image (Figure 3) KR 140 is also seen to be fairly circular with a central depression. As highlighted by the contour map, there are three high intensity areas – two “eyes” and a “mouth”. However, where the “nose” would be is a lower intensity area. The simplest interpretation appears to be a three-dimensional structure with a central hole (§ 5.2.2). We have identified VES 735 as the exciting star of this HII region (Kerton et al. 1999); it lies projected close to this lower intensity area of HII emission, though not coincident with it.
Since we have also classified the exciting star, we can draw further conclusions about the geometrical structure of KR 140 from a global analysis (§ 5 in Kerton et al. 1999). Even after taking into account the emission from dust that was not observed by IRAS, we find that the total luminosity of warm dust in the nebula is far less then the bolometric luminosity of the ionizing star VES 735 and that the covering factor of the dust is only about 0.4 – 0.5 (see § 6.4). Furthermore, the total radio flux at 1420 MHz is lower than expected for an ionization bounded nebula surrounding VES 735, with a similar implied covering factor (§ 4.2.2). This together with geometrical information to be discussed (e.g., § 4.1) implies that KR 140 is a bowl-shaped HII region (cf. Roger & Irwin 1982), rather than a classical Strömgren sphere, a not unexpected morphology when the O star is close to the edge of its parent molecular cloud (Yorke et al. 1983). This model is perhaps the simplest geometry that is consistent with the derived covering factors, but our data cannot rule out other, more complicated geometries, such as a broken shell or shredded and dissipated Strömgren sphere. Observations of a champagne flow (Tenorio-Tagle 1979), perhaps via Fabry-Perot imaging, could help establish that KR 140 is truly a blister region.
The circular symmetry observed in the dust shell (and in the ionized gas) implies that we are observing KR 140 almost face on (i.e., the opening of the bowl is oriented almost along the line-of-sight). For example, see the simulated radio maps of the R2 model by Yorke et al. (1983). The CO data and extinction measurements to VES 735 both suggest that the molecular cloud is behind the star, with the inferred opening toward us (§ 7.1).
4 KR 140 FROM THE PERSPECTIVE OF THE RADIO CONTINUUM
4.1 Size and Structure
The basic radio morphology appears to be that of a limb-brightened hemispherical shell (most of the free-free emission would be from the dense and thin ionization-bounded zone). The last contour shown (at = 5.0 K) in Figure 3 has a diameter of 8.5′ which for a distance kpc corresponds to a physical diameter of about 5.7 pc. It is expected that neutral material could extend well beyond the HII region, and indeed there is both dust (§ 6.2) and CO gas (§ 7.1) around KR 140. The free-free surface brightness falls off most quickly (the radio contours are more tightly spaced) in the west-northwest part of the nebula. A sharper ionization front would occur in more dense (pre-existing) material.
Other internal detail might be interpreted as variations in distance between the star and the background ionization front, with lower surface brightness features originating from sectors further from the star; such an interpretation of radio surface brightness has been used to construct a topological map of the ionized surface of the Orion molecular cloud behind the Trapezium (Wen & O’Dell 1995). If we use the 1420 MHz surface brightness at the pixels near the projected position of VES 735 and the known properties of this O8.5V exciting star, the distance that the star must be from the back of the nebula turns out to be only 2.14 pc. Together with the above estimate of the diameter across the line of sight, this is consistent with the idea that KR 140 is similar to a hollowed-out hemispherical bowl.
4.2 Physical Properties
In this section we use the 1420 MHz data to derive a number of physical properties of the nebula. For ease of reference, Table 1 summarizes these properties, some of the properties of the exciting star, and other quantities that we later derive from the infrared and CO data.
4.2.1 Emission Measure, Radio Flux, Electron Density, and Ionized Mass
The KR 140 emission is optically thin at 1420 MHz with a peak brightness temperature about 10 K. For an optically-thin nebula, the specific intensity (surface brightness) and brightness temperature for thermal radiation are (Osterbrock 1989):
| (1) |
where is the free-free emissivity, is the ion density, is the electron density, measures distance along the line of sight, and the integral is called the emission measure. For of a pure hydrogen nebula (a good approximation; see § 4.2.2 for models which include ISM abundances), cm-6 pc. The peak emission measure in the map is about 6000 cm-6 pc and after background subtraction cm-6 pc. After subtracting the local Galactic background we find the total flux () to be Jy at 1420 MHz. This is in good agreement with the value Jy reported by Kallas & Reich (1980). Becker, White, & Edwards (1991) detected this HII region in a 6 cm survey with the NRAO 91 m. Their source, designated [BWE91]0216+6053, had Jy. Using the same telescope and frequency Taylor & Gregory (1983) and Gregory & Taylor (1986) record this source as GT 0216+608 in their survey; in their analysis they treated all sources as point sources and so find systematically low fluxes for extended nebulae like this (648 mJy for KR 140).
In the optically thin limit the theoretical expectation for the spectral index for thermal radiation (defined as ) is (Oster 1961; Gordon 1988). The spectral index was measured between 1420 and 408 MHz. First, the distribution across the nebula was determined using L. Higgs’ “specmap” routine (Zhang & Higgs 1997), which evaluates the spectral index for the spatially variable component of the emission (this approach has the advantage of circumventing uncertainties in background subtraction in each image); for this procedure, we convolved the 1420 MHz image to the lower resolution of the 408 MHz image. The typical value of is . We confirmed this by measuring the total background-subtracted flux at 408 MHz as well. Considering there is a 10% uncertainty in the flux calibration in the 408 MHz pilot project data at the position of KR 140 (Taylor 1999), the derived spectral index is in satisfactory agreement with theory.
Depending on details of the geometry, the appropriate pathlength for estimating the density would be of order the observed radius; with this choice we find an rms cm-3. The mass of radio-observable ionized gas (allowing for He) is 163 (27 cm-3/) . For comparison, the exciting star of KR 140 has a mass of 25 (Kerton et al. 1999).
4.2.2 Number of Ionizing Photons
In ionization equilibrium the number of ionizations (where H is the predominant species) that occur each second in the nebula is equal to the number of (H+) recombinations each second, both locally and globally. An ionization-bounded nebula occurs when there is sufficient material to intercept all of the ionizing photons ( Å), , emitted by the star per second (Osterbrock 1989). Formally, the spatially-integrated radio emission of an ionization-bounded nebula is an effective calorimeter for :
| (2) |
where is the case B hydrogen recombination coefficient of H+ ( cm3 s-1 at 7500 K; Storey & Hummer 1995), is the volume element, and we have used and Equation (1) to find the right hand side. Here is the product of a number of correction factors including , the all-important covering factor by an ionization front: if the star is only partially surrounded by gas then a fraction of the ionizing photons will escape and a lower will result.
Equation 2 is based on recombination and emissivity for a pure H nebula at a fixed temperature and so is made up of a number of factors which modify the expected radio continuum flux for a given . We used the spectral synthesis code Cloudy (Ferland et al. 1998) to analyze the observations of KR 140 in the radio, particularly the correction factors which comprise . We constructed a number of toy models for differential comparisons, using a 35,500 K blackbody with and cm-3; see Table 2. The differential results are appropriate for any low-density HII region heated by a late O-type star.
The temperature of the nebula enters in the equation through the and factors, although the effect on the ratio is very small. Comparing models 1 and 5 we estimate .
The effect of the addition of other elements to the nebula is to increase the total radio flux. This effect is primarily due to the presence of He+ increasing the effective free-free emissivity (He has a tiny effect on the amount of ionization of H; e.g., Osterbrock 1989). Comparing models 1 and 4, or models 2 and 5 we estimate that .
Dust competes with the gas for the absorption of ionizing photons and thus, when present in the nebula, will reduce the observed radio for a given . Comparing models 1 and 2 (with grains) to model 3 (without grains) we derive for the typical ISM grains used in model 1 and for dark-cloud dust, similar to the dust found in Orion, used in model 2. The dark-cloud dust is not as efficient as typical ISM dust in absorbing short-wavelength photons and so has less of an effect on the emergent radio flux.
The combination of these factors, except for the covering factor, leads to a factor of depending upon the grain composition (i.e., ).
In our study of the exciting star VES 735 (Kerton et al. 1999) we used the measured radio flux at 1420 MHz ( Jy) to calculate , and then estimated based on the known spectral type of VES 735 (O8.5 V(e); , Panagia 1973). We have not attempted to put any formal error estimate on the covering factor, but given the uncertainties involved, both in the stellar properties and in estimating the various factors, this result is certainly consistent with the idea of KR 140 being an open bowl-shaped region. As demonstrated in § 6.4, an analysis of the IR data leads to the same conclusion independently.
5 THE AGE OF KR 140
The approach we have adopted here is first to date the HII region using data we have on the exciting star VES 735. With that age in mind, we then investigate the dynamics of the region, the goal being to show that certain scenarios for the evolution of KR 140, such as it being a blister region, are at least consistent with the age suggested from the exciting star. This approach is similar to that adopted by Dorland et al. (1986) in their study of the Rosette Nebula.
5.1 Stellar Content
The idea of using the stellar content of a HII region to measure the age of the nebulosity was first attempted by Hjellming (1968). Basically one plots the evolutionary tracks of stars with various masses in the vs. plane. One obtains from the spectral type of the exciting star and from the radio flux (much like ) and then the position in the plane determines an age for the star and thus the HII region. Clearly the effectiveness of this technique depends strongly on the quality of the calibration between theoretical and observational quantities as well as the quality of stellar models, which have vastly improved in the thirty years since this technique was introduced. In the early work the primary result was to indicate whether the HII regions were ionization or density bounded, and that many HII regions required additional, unobserved, sources of ionization.
Here we follow a slightly different technique compared to Hjellming (1968) in order to avoid any uncertainties associated with the covering factor and structure of the nebula. We instead use the absolute magnitude () as a measure of , which is possible because we have a good estimate of the distance to the star and the extinction along the line of sight (Kerton et al. 1999). Figure 4 plots the stellar evolution models of Schaerer & de Koter (1997) for a 20, 25 and 40 star along with the value determined for VES 735. The observed values for VES 735 are consistent with a 25 star with an age of a few million years away from the ZAMS (see Figure 4), where the age would be only of order years. Of course, the spectral type alone gives us a simple upper limit to the age of KR 140: for an O8.5 V star the main sequence lifetime is (Chieffi et al. 1998).
5.2 Dynamical Models: Spherically-symmetric
5.2.1 Strömgren Sphere
The simplest description of a HII region is that of the formation and expansion of a ionized ball of pure hydrogen at constant temperature in an uniform medium of constant density (Strömgren 1939). We summarize this only as a point of departure and contrast. The evolution of a Strömgren sphere starts with a formation phase where the O star ionizes a region of space around it to the radius () given by:
| (3) |
The initial rapid expansion to a radius of occurs in time ) (valid to , Osterbrock 1989). The time to create the initial Strömgren sphere is about (cm-3) y, instantaneous compared to other timescales. For KR 140, the observed radius () is 2.85 pc. Taking for an O8.5 V(e) star like VES 735 (Panagia 1973) and cm-3 for the original molecular cloud, pc. The initial HII region is overpressured compared to the surroundings and will expand into a uniform medium according to a law:
| (4) |
where is the sound speed in the ionized medium, is the initial radius and is the radius at time . With the densities quoted above the HII region will evolve from to on a timescale of 105 years, which is improbably short. Increasing the initial density makes smaller and forces the pressure expansion stage to be longer. A value of cm-3 will push the timescale to 106 years. However, this value is not consistent with our observations of the molecular material (§ 7), so the Strömgren sphere is not an appropriate dynamical model for KR 140.
5.2.2 Stellar Winds
In the radio image a local minimum is evident near the position of the central star (see Figure 1 in Kerton et al. 1999). One interpretation is that this is a wind blown bubble around the O8.5 V(e) star. The apparent radius of the central hole is 1.4 pc. We used the model of Castor et al. (1975) for the size of a circumstellar shell:
| (5) |
where is the shell’s radius (pc), is the mass loss rate ( yr-1), is the wind velocity (2000 km s-1) is the gas density (cm-3), and is the time ( years). Stellar wind properties of the B2 model of Schaerer & de Koter (1997) were used. For a wide range of densities we obtain timescales on the order of only 104 years. This is far too low a timescale and clearly this model is not an appropriate description of VES 735. Either the mass loss rate adopted is much too high, or the assumption of spherical symmetry is not valid.
5.3 Dynamical Models: Open Geometry
Evidence summarized thus far (§ 4.2.2 and § 6.4) indicates an open geometry with a covering factor of about 0.5 for both dust and ionized material. In this case the high pressure in the interior of the initial Strömgren sphere or stellar wind bubble is relieved, slowing down the expansion. Models have been developed to investigate the evolution of an HII region at the edge of a molecular cloud (see review of early models by Yorke (1986), and Comerón (1997) for a recent example). While complex numerical modeling is possible, Franco et al. (1994) have shown that the expansion of the ionization bounded side of such a blister HII region is well described by
| (6) |
This is based upon mass conservation between material being ejected in the flow and molecular material being eroded off the cloud. One can envisage the evolution of a blister as consisting of three stages: the initial rapid formation stage, a pressure driven expansion stage, and finally a blow-out stage. The relative length of time of the latter two stages depends upon the distance of the star from the edge of the cloud and the density structure of the cloud. One very important point is that an O star very close () to the edge of a cloud will very quickly develop a covering factor of in order 105 years and will maintain this covering factor over the lifetime of the O star (Yorke et al. 1983, 1989). We assume that the star formed very close to the edge of the cloud, thus ignoring the pressure driven expansion stage. Using Equation 6, the age of the region is of order a million years when pc. For the stellar properties of VES 735 this requires cm-3. This is somewhat encouraging as it does not require as vast a difference between the properties of the observed molecular cloud and the putative initial conditions.
6 KR 140 IN THE INFRARED
6.1 Morphology and Emission Mechanisms
Stars that are forming and evolving in the ISM interact with the interstellar dust component by heating, redistributing, and possibly destroying it. The dust can be heated by at least three distinct mechanisms: direct radiation from the central star, reprocessed radiation from the ionized gas, and diffuse radiation from the interstellar radiation field. Radiation pressure from the star acts on the dust in the ionized zone (Spitzer 1978) which causes the dust (and gas) to be pushed away from the star. Some forms of dust like polycyclic aromatic hydrocarbons (PAHs) are destroyed in intense ultraviolet fields. A morphological study of the infrared emission from KR 140 is therefore important to fully understand the energetics and effects on the environment.
As mentioned in § 2, IRAS scans of KR 140 at 12, 25, 60, and 100 m were processed by the HIRES software to generate maps of about 1′ resolution. The new beam shapes are somewhat elliptical and so point sources will be visibly stretched; however, the larger scale morphology of the observed dust emission from the nebula will not be greatly affected by the asymmetric beam.
The intensity of the dust emission, , at a particular frequency, , from a distance increment along the line of sight has the form
| (7) |
where is the number density of grains, is the Planck function at a temperature , is the radius of the particles, and is the absorption efficiency factor.
Figure 2 shows the four HIRES images of KR 140, with the 12 and 25 m images convolved to the 1420 MHz resolution, and overlaid by 1420 MHz contours (Figure 2a & b). The 12 and 25 m emission is spread well outside the radio contours of KR 140 (this is taken up in § 6.3). Features that are common to all four images in Figure 2 are the bright arcs on either side of the nebula (easiest to see in Figure 2c) that extend outside the radio contours. We interpret this as the limb-brightened warm dust shell around KR 140. Note that there could be cooler dust further out around the KR 140 complex that will not have been detected in the IRAS bands. We account for the energetics of this cooler dust in our models of KR 140 (§ 6.4).
6.2 Temperature and Column Density
Equation 7 can be used to calculate a mean dust temperature for each pixel of IR emission. Taking the intensity ratio for any two frequencies, and , yields:
| (8) |
where is the of Eq. 7, and the factor is from the frequency-dependent part of , where depends on the type of dust. The most common components proposed for interstellar dust are silicate and graphite (or some related carbonaceous material), which, at long wavelengths, have . This value of is close to what is generally observed in the ISM (Lagache et al. 1998).
The 60 m and 100 m data were used to calculate the dust temperature map, as they are the bands where classical grain emission dominates. It is likely that non-equilibrium heating of very small dust grains (VSGs) contributes some of the observed 60 m flux and so the derived temperatures are probably slight overestimates of the true grain temperatures (Boulanger et al. 1988). The images were brought to the same resolution and background subtracted and the IPAC analysis program ‘cttm’ was used to compute a dust temperature map. An azmuthially-averaged radial cut of this map is shown in Figure 5. The temperature distribution was sampled every in radius and every azimuthally. The temperatures in the central region are around 31 K. Nearer the edge of the HII region, the dust temperatures drop to around 28 K. However, a line of sight passing near the star also has cooler dust in the background and the foreground, which would lower the apparent temperature observed.
A calculation of dust temperature from first principles was done as a check on the empirical values output from ‘cttm’. In this calculation, a single silicate or graphite dust grain with a radius of 0.1 m (a typical interstellar size, see Kim, Martin & Hendry (1994)) was placed at a distance of 3.0 pc from the center of the nebula, corresponding to a dust grain within the KR 140 dust shell. The luminosity of the O8.5V(e) exciting star is about 105 (Panagia 1973). Making use of Planck-averaged absorption factors from Laor and Draine (1993), we find that if , the calculated dust temperature is about 28 K, in agreement with the temperature deduced empirically. Note, however, that this calculation did not take into account the recombination-line photons emitted by the ionized gas. Furthermore, some of the free-free photons and collisionally-excited cooling lines are emitted not in the ultraviolet, but in the optical (Osterbrock 1989), where the dust absorption efficiency is somewhat lower.
The optical depth from dust is defined to be
| (9) |
and can be calculated by dividing (Equation 7) by the Planck function , assuming a constant along the line of sight, adopted from the temperature map. Figure 6 displays a dust optical depth map at 100 m. The values range from about 0.0004 in the middle of the nebula to about 0.002 in the bright northwest rim. These values show that the dust is transparent to its own 100 m emission. The minimum in the center of the nebula and the ring-shaped appearance is most simply interpreted as limb brightening in a thick shell of dust with the highest column density along the northwest rim. The latter is the same region of the nebula where the 1420 MHz radio contours fall off most steeply (§ 4.1), and where there is no CO emission (§ 7.1).
The optical depth in the ultraviolet can be gauged using extinction curves from the literature. We are interested in the radial as opposed to line of sight optical depth. Judging the thickness of the shell from one of the arcs in Figure 6 gives a path length of about 7 cm. If we assume the dust is associated with gas at a molecular density of 100 cm-3, the molecular column density of this gas is about 7 cm-2. Using the extinction curves of Kim, Martin & Hendry (1994), we find that at 1100 Å (far in the ultraviolet), whereas at 5500 Å (in the optical), . The estimated optical depths show that the dust in the arcs has a high enough radial optical depth to absorb most of the incident ultraviolet photons. However, since KR 140 has a covering factor of 0.4 – 0.5 (§ 4.2.2 and § 6.4), the total infrared luminosity of the nebula will be correspondingly less than the bolometric luminosity of VES 735 (§ 6.4).
6.3 The 12 and 25 m Emission
It has been known for over a decade that there is excess emission within the 12 m IRAS passband (e.g., Boulanger, Baud & van Albada 1985). Onaka et al. (1996) found that more than 70% of the 12 m diffuse interstellar emission detected by IRAS is emitted in spectral features attributed to polycyclic aromatic hydrocarbons (PAHs; Léger & Puget 1984; Allamamdola, Tielens & Barker 1985). The 12 m image of KR 140 is very instructive. There is very little 12 m flux within the radio contours of KR 140, implying that PAHs are destroyed there in the intense ultraviolet radiation field. However, there is a large amount of diffuse flux outside the radio contours, especially to the west (Figure 2a). The PAH emission is a tracer of the photodissociation region around a nebula (Giard et al. 1994; Bregman et al. 1995; Fig. 10).
Unique among the HIRES images of KR 140, the 25 m image (Fig. 2b; Fig. 7) shows a bright spot near the center of the nebula, on a transition between a radio peak (the “left eye”) and the deepest depression. The IRAS Point Source Catalog (Joint IRAS Science Working Group 1988) lists this feature as IRAS 02165+6053, and it also has been identified with VES 735 (Bidelman 1988). Figure 7 shows that IRAS 02165+6053 and VES 735 are practically coincident. Dust closer to the star would tend to be warmer, contributing to the spot if not pushed away by radiation pressure.
The entire nebula looks hotter and more extended at 25 m than it would be for equilibrium emission from normal-sized grains. Most of the 25 m emission is probably contaminated by non-equilibrium emission from very small grains (VSGs; Sellgren 1984) which have absorbed a UV photon and have had their temperatures instantaneously rise to K. Although these small grains make up a tiny fraction of the mass in the dust distribution, they make up a good fraction of the number distribution and absorb a significant fraction of the near-ultraviolet radiation. This VSG emission is therefore a major source of uncertainty when analyzing the 25 m image.111Further evidence for contamination in the 25 m IRAS passband was presented by Cox (1990). He suggests that an iron oxide emission line falls within this IRAS passband which would result in even greater excess 25 m emission. Note that the “temperature-spiking” phenomenon also occurs outside the ionized zone, far from the exciting star.
6.4 Infrared Models
HII regions are some of the most luminous objects in the Galaxy when observed in the infrared, especially at wavelengths longer than 60 m. In fact, if the dust shell covers 4 steradians around the exciting star, the infrared luminosity should be a good measure of the star’s bolometric luminosity. To account for the true extent of the dust, we can define a covering factor of dust (). Often it is simply assumed that ; however, this is not correct even for . Some of the radiation from the star and nebula is at long enough wavelengths to avoid being absorbed by the dust. Using Cloudy we found that for models with , .
To calculate the integrated infrared flux from KR 140, the background in each of the four HIRES images was fitted and subtracted, and the total flux from the nebula was measured in each band. In order to estimate using these data, we used Cloudy to simulate the emission from large classical grains, roughly matching the fluxes at 60 and 100 m. This approach allows us to account for emission from grains with a range of temperatures and thus unobserved emission at long wavelengths. First, we constructed models with . We find . Since the resulting spectrum misses most of the observed 12 and 25 m flux (which is caused by temperature spiking of VSG’s and the excitation of PAH molecules) we converted the observed 12 and 25 m fluxes to luminosities using tophat approximations to the IRAS passbands (Emerson 1988) and added the results to . With this addition we find . Correcting from to we find . This is significantly below what would be expected for any late O main sequence star (e.g., Panagia 1973). We interpret this low apparent as being due to a covering factor of 0.4 – 0.5.
We know that VES 735 is an O8.5 V(e) star. Figure 8 demonstrates that one can reproduce the observed using the appropriate stellar parameters and a covering factor of about 0.5. A single temperature (T = 28.25 K) spectrum is shown for comparison; note the wider model curve caused by the range of dust temperatures contributing to the emission.
Using an alternative calibration of stellar parameters which includes wind-blanketed models (Kerton 1999), we find and . These results are still consistent with a blister model for KR 140.
7 KR 140 IN A MOLECULAR CLOUD
7.1 CO Signature
A slit spectrum of VES 735 allowed us to measure the radial velocity of the nebular H line within 30′′ of VES 735 to be km s-1with respect to the Local Standard of Rest [LSR] (Kerton et al. 1999). The differential radial velocity between VES 735 and the nebular line was measured to be km s-1.
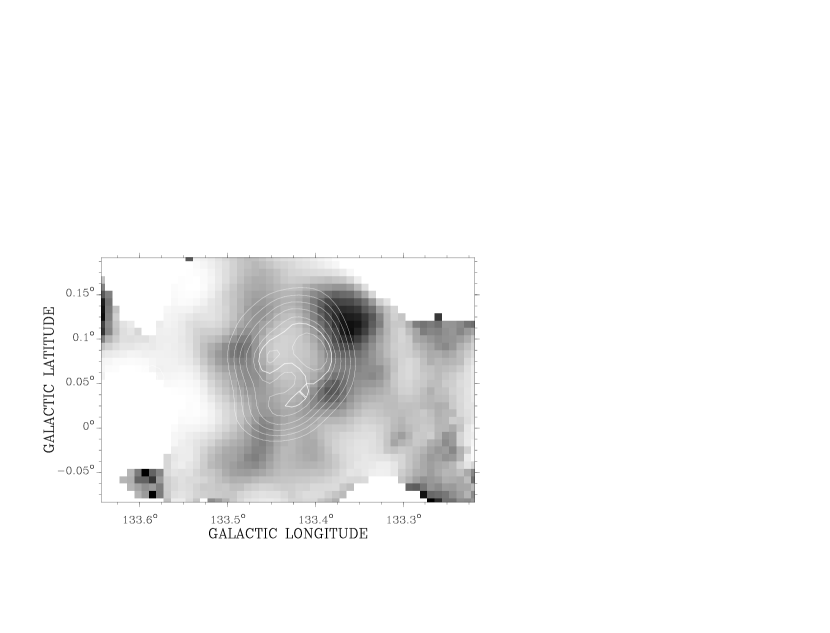
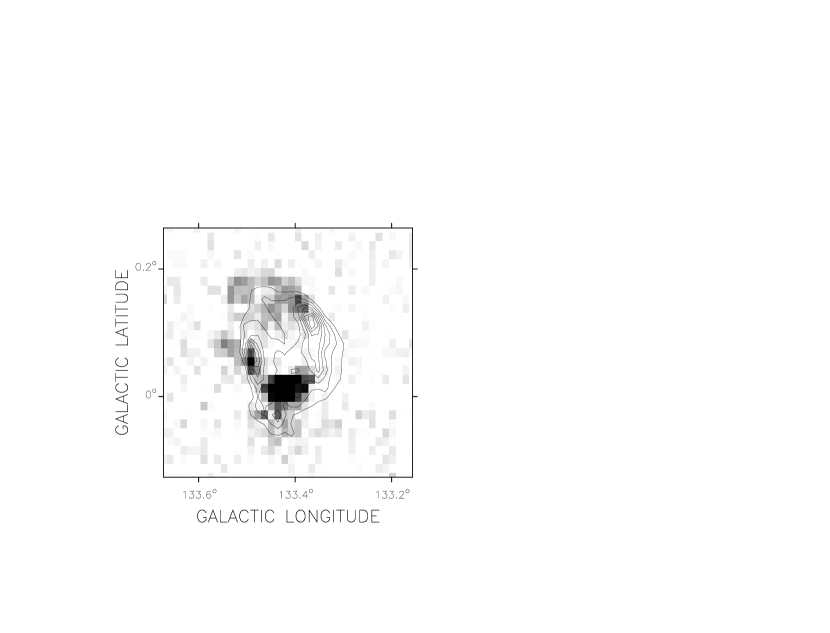
An expected effect of the evolution of the HII region is photodissociation of molecular gas both inside the HII region and in the immediate surrounding interstellar medium (ISM). The CO data traces the molecular gas content of the ISM, so an examination of the CO data cube ought to reveal a lack of emission near the ionized gas velocity of KR 140. Indeed, a distinct CO hole was found within the radio contours of KR 140 over the velocity range 45.53 km s-1to 47.16 km s-1(LSR), which corresponds to three channels of width 0.813 km s-1 in the CO cube. At more negative velocities, CO emission from the parent molecular cloud fills in the 1420 MHz contours.
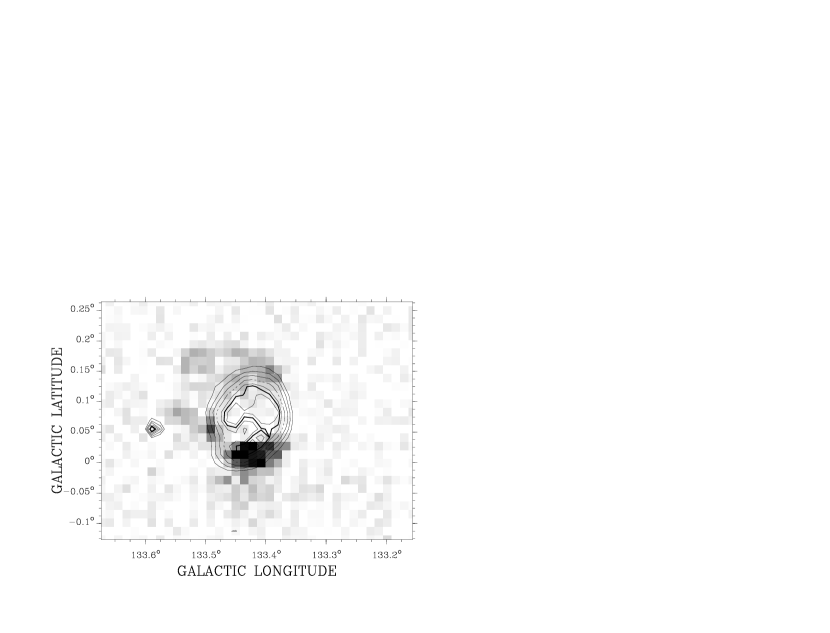
Figure 9 shows the sum of these three channels overlayed with the 1420 MHz continuum contours. A well defined ring structure is clearly seen. Interestingly, the ring does not extend all the way around the nebula: there is no CO emission in the north-west. This is the same area where the 1420 MHz contours are falling off more sharply (§ 4.1), there is a bright infrared arc (§ 6.1), and a bright HI feature (§ 8). The relationship between 12 m emission, which is a good tracer of the PDR, and the CO emission is shown in Figure 10. The north-west peak in the 12 m emission corresponds to the region where there is no CO emission. To the east, as one moves away from the HII region the 12 m peak occurs first followed by the peak in the CO emission.
7.2 Density and Mass of the Molecular Cloud
To estimate the mass of the molecular cloud we integrated the CO cube over the whole velocity range of the cloud (45.5 km s-1to 52.8 km s-1), and measured the total surface brightness of the molecular cloud. We can use the empirical factor to convert from CO surface brightness to molecular hydrogen column density. We have used cm-2 (K km s-1)-1 (Strong & Mattox 1996), where the quoted uncertainty is to take into account the range of values measured for a variety of different clouds, to obtain a mean column density of N(H2) cm-2. Assuming a path length of 7 pc (the north-south radial extent) the density of the molecular cloud is roughly cm-3, typical of a giant molecular cloud (Blitz 1993).
By integrating the column density over the face of the cloud, we estimate the mass of the cloud to be . This mass includes a He correction factor of 1.36, and the error bar includes the distance uncertainty. The CO images show that the parent molecular cloud of KR 140 has been greatly disrupted by the nebula and the exciting star VES 735 and so this mass will be an underestimate of the cloud’s initial mass.
7.2.1 Estimating the Mass of the Original Molecular Cloud
One way to estimate the mass of the original molecular cloud would be to assume that KR 140 is indeed a blister HII region as our data suggests. Yorke et al. (1989) have modeled blister HII regions with one exciting O star and found that mass loss rate of material through the blister is yr-1. However, these authors modeled an O6 star in a cloud with cm-3, which is not an accurate description of either VES 735 or its parental cloud. Unfortunately, Yorke et al. (1989) give no indication of how to scale their mass loss rate for different values of or . A analytic estimate of the amount of mass lost from a blister HII region is given by Whitworth (1979). His Equation (41) has the desirable property that it agrees with the results of Yorke et al. (1989) for the values used in their models; therefore, it might have the correct scaling for and . However, his calculations were based on a cylindrical geometry which is not a very realistic model for a more bowl-shaped spherically symmetric region such as KR 140.
In § 5.3, we made use of the blister evolution formula given by Franco et al. (1994). These authors considered a simple symmetric blister region and were also able to estimate the cloud evaporation rate:
| (10) |
where is the Strömgren radius and is the proton mass. In § 5.3, we found that an initial cloud density of 280 cm-3 and pc would match the observed radius of KR 140 in a time of 1 Myr (consistent with the age of VES 735). Using these values in the above equation gives a mass loss rate of yr-1. Therefore, about 290 of molecular material has been eroded from the cloud after 1 Myr. Including the effects of dust lowers , increases the age, and lowers , resulting in a very similar amount of erosion (280 ).
Taking into account the mass lost through erosion and the present ionized mass, we estimate the mass of the original molecular cloud in which VES 735 formed to be about , so this cloud would be classified as a dwarf molecular cloud (Elmegreen 1985). This seems to be a remarkably small cloud mass from which an O star has formed. Williams & McKee (1997) performed a statistical analysis of many nearby OB associations and molecular clouds, and found that it was more likely that clouds with masses greater than 10 should form O stars than clouds with lower masses. Other HII regions have been found with small molecular cloud masses (Hunter et al. 1990), but O star formation with a cloud mass below 104 is considered rare (Elmegreen 1985). Of course we have been attracted to this cloud because of the effect of VES 735 and not to other parts of the W3 cloud complex (Heyer et al. 1998) which have not formed O stars.
7.3 Interpretation of the Velocity
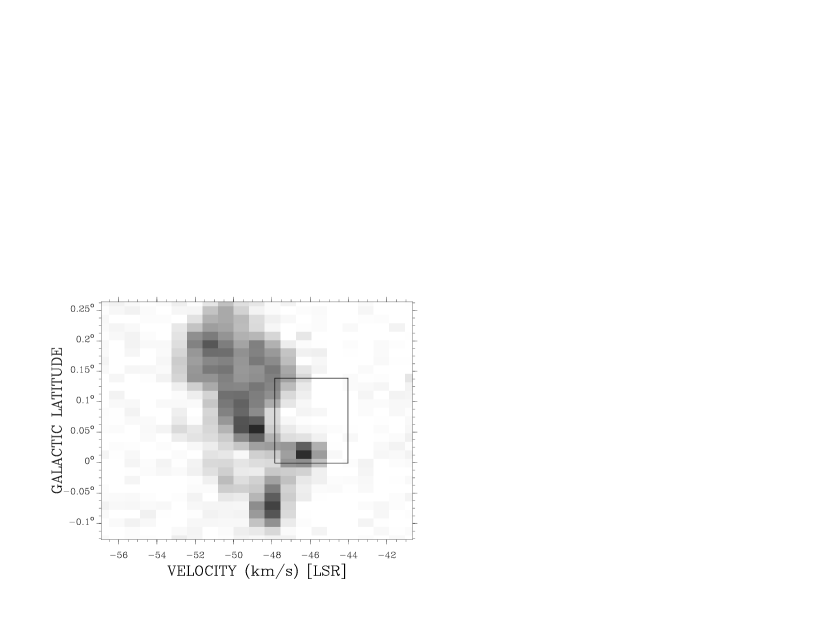
Stepping through the velocity channels in the CO data cube near the velocity of KR 140 shows that at higher (least negative) velocities ( km s-1) there is no emission, then the CO emission comes in at the southern end of the HII region and spreads northward, before filling in the 1420 MHz contours at a velocity of 48.78 km s-1. Perhaps the best way to illustrate these data is by examining the cube in velocity-latitude space. Figure 11 shows such a CO image of KR 140, averaged over the longitude range 133.366∘ to 133.477∘. Note the “hole” at the velocity of the ionized gas and VES 735.
The question arises as to the relative radial position of VES 735 and KR 140 with respect to the molecular gas. In general, it is difficult to use only the CO radial velocity information to determine absolute distances to clouds or GMCs. However, in this direction, Galactic rotation causes radial velocity to become more negative with increasing distance. On the face of it, that would place the molecular cloud on the far side of the star and nebula. However, this is possibly too naive an interpretation because if the cloud is only 10s of pc in radial extent (like its dimension in the plane of the sky), then the average shear would be too small to explain the large range in velocity (unless there were a large enhancement from a density wave).
To address the question of relative position, we made use of both the HI and CO data cubes to make an estimate of produced by gas with velocities out to km s-1. As in § 7.2 we used the conversion factor cm-2 (K km s-1)-1 to convert I(CO) to N(H2). We integrated both data cubes to obtain the atomic column densities. At the position of VES 735 we found N(HI) = cm-2 assuming the emission is optically thin, and N(H2) cm-2, the latter mostly from local rather than Perseus arm gas. Summing the contributions of atomic and molecular hydrogen we obtain the total hydrogen column density, NH = 2N(H2) + N(HI) cm-2. The total visual extinction is computed using the standard conversion factor, A mag cm-2 (Bohlin, Savage & Drake 1978). At the position of VES 735 we obtain A, where most of the uncertainty comes from the uncertainty in the factor (using the factors of Digel et al. 1996 gives a lower ). This value of compares favorably with the values around derived by Kerton et al. (1999) using a number of methods (e.g., colour, H emission measure, DIBs). However, if the cloud’s molecular column density (summed over to km s-1) of N(H2) cm-2 (§ 7.2) is included in the extinction calculation, then the rises to 8.0, which is quite inconsistent with the observed to VES 735. We also made maps of the predicted extinction over the surface of the nebula for comparison with the extinction map derived by comparing H surface brightness with radio emission (Kerton et al. 1999). Again, inclusion of the extinction from gas in the molecular cloud produces more than two magnitudes too much extinction. This is strong evidence that both VES 735 and the ionized gas of KR 140 lie on the near side of the molecular cloud gas which has velocities to km s-1.
The extinction measurements combined with Figure 11 suggest that KR 140 could be a blister HII region on the near side of the molecular cloud. This simple geometrical interpretation of KR 140 runs into difficulty if a systematic champagne flow has developed with gas flowing away from the parent cloud at up to the sound speed of km s-1. At face value, our H velocity implies that the ionized gas is redshifted with respect to the molecular gas, which means the HII region should be on the far side of the molecular cloud. However, it can be noted that H is considered to be a poor line for estimating the velocity field of champagne flows (Israel 1978; Yorke et al. 1984). Modeling of line profiles in champagne flows also shows that the velocity field can be quite random and of low amplitude, depending on geometry (Yorke et al. 1984). Recall that the geometry here is certainly not plane-parallel and probably more like a broken shell. Furthermore, our measurement sampled only gas within a projected distance of 30′′ of VES 735. Fabry-Perot data of the whole nebula in a line other than a hydrogen line would be a good way to obtain a better picture of the velocity structure of the ionized gas in KR 140.
The question then arises as to the origin of the radial velocity spread within the molecular cloud. If this is a single, gravitationally bound cloud, then this is just the virial velocity, and its mass can be estimated from
| (11) |
where is the length scale for the cloud, is the linewidth, and is the virial parameter and includes the effects due to surface pressure, magnetic fields, and nonuniform densities (Bertoldi & McKee 1992). As in § 7.2, we take pc, and measure a typical linewidth to be 5 km s-1(see Fig. 11). We take to be 1.1 (Williams & McKee 1997). With these values which is well over an order of magnitude larger than our measured CO mass of .
This result implies that the velocity field has another origin and can significantly alter the cloud structure over time. In fact, recalling that a velocity of 1 km s-1corresponds to 1 pc in a million years, the “crossing time”, , is only 3 Myr, comparable to our above estimates of the age of VES 735 and the HII region. From the radial arrangement derived from extinction, it seems that the background molecular material is moving toward KR 140. Perhaps the parent cloud giving rise to VES 735 was the result of a converging flow or “cloud collision” that is still ongoing (relative motion in the plane of the sky would be expected too).
8 HI SIGNATURE
In theory the presence of HII regions and their surrounding molecular material should be easily “visible” in HI data sets: in both the ionized and molecular regions there should be a deficit of HI emission due to a lack of neutral atomic hydrogen. In addition, if the geometry is favorable, neutral atomic hydrogen associated with the photodissociation region (PDR) at the ionized-molecular interface should be visible. In practice it is actually very difficult to observe HI features that are unambiguously associated with an HII region in raw HI data sets. This is primarily due to velocity confusion along the line of sight caused by the “turbulent” motion of the atomic gas. Since the velocity of the neutral atomic gas can be many times the typical channel width in the HI data sets velocity becomes a much poorer proxy for physical distance than in a CO data set, which is probing a species with lower velocity dispersion (heavier, cooler, and less turbulent). The situation is especially problematic for HII regions in the Galactic plane where one has to look through a large column of atomic gas towards the HII region. For KR 140 we are looking through the local arm and part way into the Perseus arm of the Galaxy. A preliminary reconnaissance of the HI cube confirmed that the complex HI emission structure along the line of sight makes seeing any HI signal associated directly with KR 140 extremely difficult. Nevertheless, some simple processing of the HI data cube does bring out some features associated with the region.
In order to exclude local HI emission (which is assumed to have a relatively smooth spatial structure) and to enhance the dynamic range of the resulting channel maps we constructed a median-subtracted data cube (Joncas et al. 1992; Joncas et al. 1985). In this technique a median spectrum is calculated for the data cube and then subtracted from each spectrum making up the cube. The resulting channel maps thus can contain both negative and positive values indicating deviations relative to the median base level.
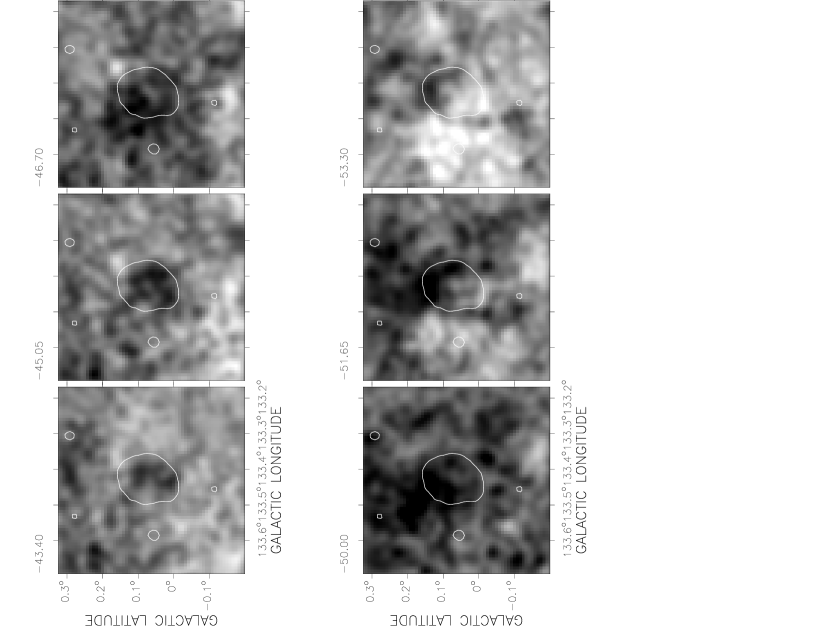
Figure 12 shows channel maps of the median-subtracted cube over the velocity range to km-1 bracketing the ionized gas velocity of km s-1 (Kerton et al. 1999). We could not detect any features definitely associated with KR 140 in the channel maps outside of this velocity range.
Examining these maps we note the following three features. First, there is a noticeable deficit of HI seen in velocity channels to km s-1 outside of the HII region. There is excellent positional agreement between this deficit in HI and the observed position of the CO emission. The deficit can be simply interpreted as being caused by a lack of HI emission in the molecular material surrounding KR 140. Second, we also see a drop in the HI emission occurring within the HII region in the and km s-1 channels. This deficit is most likely associated with the ionized gas in KR 140 as suggested by their spatial correspondence. Figure 13 presents spatially averaged HI and CO spectra for an area just outside of the HII region to the north-east and the area inside the HII region. The anticorrelation between HI emission and the presence of CO and HII is evident. Third, there is an enhancement of HI emission at (133.36∘,0.1583∘), seen best in the velocity channel km s-1. This could be low velocity dispersion material associated with the PDR. Atomic material in the PDR is expected to have a low velocity and thus should be seen in channels corresponding to CO emission.
9 THE ENVIRONMENT OF KR 140
9.1 Spontaneous Massive Star Formation
In the context of the Perseus Arm star formation activity, the KR 140 complex seems to be unique. Figure 1 shows that KR 140 is isolated from the massive and violent star formation that is ongoing around it. This isolation is evidence to us that KR 140 is an example of massive star formation in our Galaxy that is untriggered, at least in the sense used in the context of sequential star formation. In none of our data sets does there appear any evidence for a trigger of the star formation in KR 140. The exciting cluster of W4, OCl 352, is about 60 pc away from KR 140 for a cluster distance of 2.35 kpc (Massey, Johnson & DeGioia-Eastwood 1995). For a sound speed of 0.6 km s-1(isothermal speed in H2 at 100 K), the time for a signal to reach KR 140 would be about 90 Myr, much greater than our estimated age of KR 140 of a few million years or the age of OCl 352. From W3, a signal would take about 60 Myr, but W3 is itself much less than 105 years old (Kawamura & Masson 1998). The supernova remnant HB3 is also in this complex (Normandeau et al. 1997), but from Figure 1, the edge of the remnant is nowhere near to KR 140. Thus, KR 140 does not seem to be triggered by a neighboring HII region or a nearby supernova remnant, unless the impulse came along the line of sight. This conclusion is complemented by the overall smoothness of the KR 140 nebula; while the nebula does show density inhomogeneities, it is not far removed from a circular shape. Thus, any perturbation that might have triggered the star formation within KR 140 must have been a large scale phenomenon with a characteristic scale of pc. This kind of triggering might be more consistent with triggering via a spiral density wave (e.g., Elmegreen 1994, 1995) or by colliding molecular clouds. Of course, we cannot rule out those kinds of triggers, but the observational evidence would be difficult to find.
It is interesting to contrast KR 140 to another star forming region that has been studied with multiwavelength data, the Gemini OB1 molecular complex (Carpenter, Snell & Schloerb 1995a, 1995b). Within the molecular complex, these authors find young star clusters (from near infrared data) and a number of dense cores (as identified by CS observations) associated with IRAS point sources. Carpenter et al. suggest that the arc-shaped morphologies of these cores have been formed by swept-up gas from expanding HII regions, and that they would form the massive star clusters in the region. The other lower infrared luminosity sources (most likely belonging to lower mass cores) in the Gem OB1 complex are not found to be correlated with any arc-shaped structures or filaments in the molecular gas, and they are not adjacent to any HII regions; in fact they are spread almost randomly around the complex. Carpenter et al. therefore conclude that induced star formation is the prominent mode of formation for massive stars in the Gem OB1 molecular complex.
If KR 140 is indeed untriggered, then it seems to be an unusual form of spontaneous star formation since current observations suggest that the isolated mode of star formation is generally associated with low mass star forming regions as seen in Gem OB1 or even in Taurus.
9.2 IRAS Point Sources and Protostars
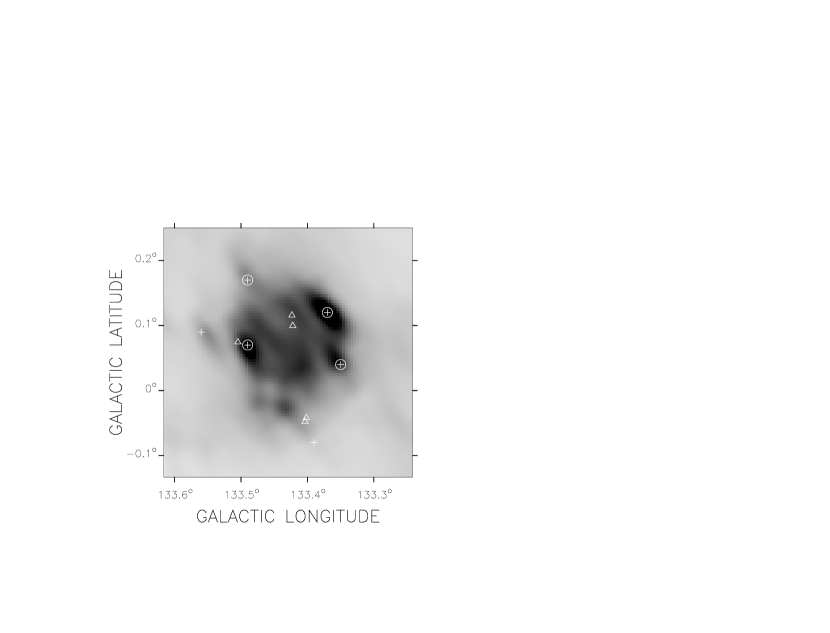
As has been seen in other sites in the Galaxy, an HII region can initiate star formation via the expansion of its ionization front (e.g., Elmegreen & Lada 1977). Other stars might also have formed spontaneously. Evidence for other star forming regions within KR 140 may be sought by examining the IRAS point source catalog. In addition to the IRAS point source 02165+6053 that is cross-referenced to VES 735, there are six other IRAS point sources in the area in and around KR 140 (see Table 3). The crosses in Figure 14 show the positions of these six IRAS point sources. The circled crosses are the sources discussed here that seem most likely to be associated with the KR 140 complex.
The source IRAS 02160+6057 identified with the north-west dust arc has been the subject of two molecular line investigations. Wouterloot & Brand (1989) identified it as a potential star-forming area via its IRAS colors (see their paper for the exact selection criteria), and examined it (along with about 1300 other IRAS point sources) for CO emission. They found a CO feature in that direction at a velocity of 49.7 km s-1(LSR), which corresponds to CO in the associated background molecular cloud, and assigned it the catalog number [WB89]417. This point source was then observed in an H2O line by Wouterloot, Brand & Fiegle (1993), but they were unable to detect any emission. This line of sight has one one of the highest column densities in the KR 140 HII region, and so it is possible that a protostar could be forming there as a result of the expansion of the HII region. However, examination of the HIRES images shows no point-like features in the dust arc, and none are found in follow-up submillimetre observations with SCUBA (Kerton et al. 2000). Therefore, IRAS 02160+6057 is most likely simply part of the KR 140 dust shell. Likewise, IRAS 02168+6052 appears to just be part of the eastern side of the dust shell; it has not been the subject of any molecular line observations.
The source IRAS 02157+6053 also seems to have been an identification of some part of the dust shell. In the submillimetre there is more structure in this region; this object appears to be a molecular core rather than a protostar (Kerton et al. 2000).
The point source IRAS 02171+6058 is identified with the dust feature to the north of the KR 140 complex. It was included in a CS(2–1) survey by Bronfman, Nyman & May (1996) of IRAS point sources that have colors characteristic of ultracompact HII regions; however, they were unable to make a detection. Lyder & Galt (1997) observed this source along with other ultracompact HII region candidates in a search for methanol maser emission. Again, they were unable to detect any maser emission from IRAS 02171+6058. These non-detections do not rule out the possibility that the source is a protostar. In fact there is a submillimetre detection and all evidence seems consistent with a B5V star (Kerton et al. 2000). It is outside the radio contours of HII region and is therefore difficult to interpret as being triggered.
A photographic survey of the W3 and W4 region turned up Bright InfraRed Stars (BIRS; Elmegreen 1980) which are brighter in I band than in R band. There are five of these stars in the KR 140 region of the sky. Table 4 gives their coordinates along with their R and I magnitudes and the positions are indicated by triangles on Figure 14. Elmegreen (1980) estimated that if these stars were at the distance of the Persues arm then they might be deeply embedded massive early or pre-main sequence stars, or even giants or supergiants. From examining the overall distribution of the BIRS stars (Figure 1 in Elmegreen 1980), we find there is an overabundance of BIRS around KR 140 as compared to the average. It is difficult to say whether or not these BIRS stars are physically associated with the KR 140 complex. However, BIRS 128 on the eastern side of the nebula seems to lie at a well defined edge of the dust shell, and within the CO shell.
9.3 The Gas Cloud
We have been able to estimate some properties of the original molecular cloud which spawned the KR 140 HII region. Originally having this cloud would then be classified as a dwarf molecular cloud. These are quite numerous in the ISM. The column density of cm-2 is about the same as the median column density of cm-2 in the molecular gas in the outer Galaxy (Heyer et al. 1998). Once VES 735 formed in the molecular cloud, it had a tremendous impact on the environment around it. It has incorporated 25 , ionized about 160 , and a further of cloud material has been removed since the ionization front broke out of the front part of the molecular cloud. The remnant cloud is of fairly low density, cm-3.
The velocity width of the molecular cloud is too large for the cloud to be bound, but it is unlikely to arise from velocity shear due to differential Galactic rotation. It is possible to interpret the velocity structure as a large scale flow of material towards KR 140. If true, this flow could have had an impact on the star formation history of this region.
We can use our estimate of the original molecular cloud mass to estimate the mass of the stellar cluster that likely formed along with VES 735. Hunter et al. (1990) observed clouds in our mass range and estimated cluster masses using a Miller-Scalo initial mass function (IMF; Miller & Scalo 1979). Using their data we find the correlation shown in Figure 15: . With the above cloud mass we estimate a cluster mass of about . Of course, since we know the mass of the most massive star we can use a Miller-Scalo IMF to estimate the mass of the cluster directly. Using Equation 12 in Elmegreen (1983) we estimate a cluster mass of about , consistent with the above “empirical” estimate. Using these cluster and cloud masses we estimate a star formation efficiency (SFE = ) of about 25% which is typical for clouds of this size (Hunter et al. 1990), although values can range over two orders of magnitude from cloud to cloud (Williams & McKee 1997). This low value of the SFE implies that the cluster within KR 140 will not be gravitationally bound.
Near infrared observations (such as ones in the ongoing 2MASS survey) should be able to detect a number of pre-main sequence stars from this cluster around VES 735. It would be interesting to compare the IMF in this region to the IMF in regions where the star formation was triggered. Which, if either, is a good description of the IMF in the Galaxy?
10 CONCLUSIONS
We have utilized our multiwavelength data set (all at a resolution of about 1′) to study not only the physics of the HII region itself, but also, since the data are from the larger CGPS survey, to study KR 140 in the context of the overall picture of star formation in the Perseus spiral arm. We find no evidence for a mechanism that triggered the formation of the O8.5V(e) star, VES 735, and its (largely unseen) cluster. We therefore conclude that this region formed spontaneously out of its parent molecular cloud, independent of the more vigorous star formation in W3 and W4 nearby.
Our data of KR 140 are consistent with the model of a bowl-shaped region viewed close to face on. Extinction measurements to the exciting star, VES 735, and nebula show that the HII region is quite likely on the near side of its molecular cloud. We have not observed any champagne flow, and cannot rule out other geometries. KR 140 has an age less than a few million years. We have estimated that the original molecular cloud had a mass of and an average density about 100 cm-3, which classifies it as a dwarf molecular cloud. This makes KR 140 even more unusual as it is a rare example of an O star that has formed in a cloud with a mass less than 10. There is tentative evidence that the molecular material is undergoing a large scale flow towards KR 140. Follow-up observations are needed to pursue this idea. There are four IRAS point sources associated with the KR 140 complex, one of which is a possible protostar candidate and another a molecular core. Near infrared observations of KR 140 are needed to find and study the young cluster that likely formed along with VES 735.
References
- Allamamdola et al. (1985) Allamamdola, L. J., Tielens, A. G. G. M. & Barker, J. R. 1985, ApJ, 290, L25.
- Becker et al. (1991) Becker, R. H., White, R. L. & Edwards, A. L. ApJS, 75, 1.
- Bertoldi & McKee (1992) Bertoldi, F. & McKee, C. F. 1992, ApJ, 395, 140.
- Bidelman (1988) Bidelman, W. P. 1988, Bull. D’Inf. Cent. Donnees Stellaires, 35, 52.
- Blitz (1993) Blitz, L. 1993, in Protostars and Planets III, eds. E. H. Levy & J. I. Lunine, (Tuscon: Univ. of Arizona Press), p. 125.
- Bohlin, Savage & Drake (1978) Bohlin, R. C., Savage, B. D. & Drake, J. F. 1978, ApJ, 224, 132.
- Boulanger et al. (1985) Boulanger, F., Baud, D. & van Albada, G. D. 1985, A&A, 114, L9.
- Boulanger et al. (1988) Boulanger, F., Beichman, C., Désert, F. X., Helou, G., Pérault, M. & Ryter, C. 1988, ApJ, 332, 328.
- Braunsfurth (1983) Braunsfurth, E. 1983, A&A, 117, 297.
- Bregman et al. (1995) Bregman, J. D., Sloan, G. C., Schultz, A. S. B., Temi, P. & Rank, D. M. 1995, BAAS, 27, 1314.
- Bronfman et al. (1996) Bronfman, L., Nyman, L-Å. & May, J. 1996, A&AS, 115, 81.
- Cao et al. (1997) Cao, Y., Terebey, S., Prince, T. A. & Beichman, C. A. 1997, ApJS, 111, 387.
- (13) Carpenter, J. M., Snell, R. L. & Schloerb, F. P. 1995a, ApJ, 445, 246.
- (14) Carpenter, J. M., Snell, R. L. & Schloerb, F. P. 1995b, ApJ, 450, 201.
- Castor et al. (1975) Castor, J., McCray, R., & Weaver, R. 1975, ApJ, 200, L107.
- Chieffi et al. (1998) Chieffi, A., Limongi, M. & Straniero, O. 1998, ApJ, 502 737.
- Clarke et al. (2000) Clarke, C. J., Bonnell, I. A. & Hillenbrand, L. A. 2000, in Protostars and Planets IV, ed. V. Mannings, A. P. Boss & S. S. Russell (Tucson: University of Arizona Press), in press.
- Comerón (1997) Comerón, F. 1997, A&A, 326, 1195.
- Cox (1990) Cox, P. 1990, A&A, 236, L29.
- Dickel (1980) Dickel, H. 1980, ApJ, 238, 829.
- Digel et al. (1996) Digel, S. W., Lyder, D. A., Philbrick, A. J., Puche, D. & Thaddeus, P. 1996, ApJ, 458, 561.
- Dorland et al. (1986) Dorland, H., Montmerle, T. & Doom, C., 1986, A&A, 160, 1.
- Elmegreen (1983) Elmegreen, B. G. 1983, MNRAS, 203, 1011.
- Elmegreen (1985) Elmegreen, B. G. 1985, in Protostars and Planets II, ed. D. C. Black & M. S. Matthews (University of Arizona, Tuscon), 33.
- Elmegreen (1992) Elmegreen, B. G. 1992, in Star Formation in Stellar Systems, ed. G. Tenorio-Tagle, M. Prieto, & F. Sanchez (Cambridge: Cambridge University Press), 381.
- Elmegreen (1994) Elmegreen, B. G. 1994, ApJ, 433, 39.
- Elmegreen (1995) Elmegreen, B. G. 1995, in The Formation of the Milky Way, ed. E. J. Alfaro & A. J. Delgado (Cambridge: Cambridge University Press) p. 28.
- Elmegreen & Lada (1977) Elmegreen, B. G. & Lada, C. J. 1977, ApJ, 214, 725.
- Elmegreen et al. (2000) Elmegreen, B. G., Efremov, Y., Pudritz, R. E. & Zinnecker, H. 2000, in Protostars and Planets IV, ed. V. Mannings, A. P. Boss & S. S. Russell (Tucson: University of Arizona Press), in press.
- Elmegreen (1980) Elmegreen, D. M. 1980, ApJ, 240, 846.
- Emerson (1988) Emerson, J. P. 1988, in Formation and Evolution of Low Mass Stars, ed. A. K. Dupree & M. T. V. T. Lago (Dordrecht:Kluwer), 193.
- English et al. (1998) English, J., Taylor, A. R., Irwin, J. A., et al. 1998, PASA, 15, 56.
- Ferland (1996) Ferland, G. J. 1996, Hazy: a Brief Introduction to Cloudy, University of Kentucky, Department of Physics and Astronomy Internal Report.
- Ferland et al. (1998) Ferland, G. J., Korista, K. T., Verner, D. A., Ferguson, J. W., Kingdon, J. B., & Verner, E. W. 1998, PASP, 110, 761.
- Franco et al. (1994) Franco, J., Shore, S. N. & Tenorio-Tagle, G. 1994, ApJ, 436, 795.
- Giard et al. (1994) Giard, M., Bernard, J. P., Lacombe, F., Normand, P. & Rouan, D. 1994, A&A, 291, 239.
- Gordon (1988) Gordon, M.A., 1988, in Galactic and Extragalactic Radio Astronomy, ed. G. L. Verschuur, K. I. Kellermann (New York: Springer–Verlag), p. 37.
- Gregory & Taylor (1986) Gregory, P. C. & Taylor, A. R., 1986, AJ, 92, 371.
- Heyer et al. (1996) Heyer, M. H., Brunt, C., Snell, R. L., Howe, J., Schloerb, F. P., Carpenter, J. M., Normandeau, M., Taylor, A. R., Dewdney, P. E., Cao, Y., Terebey, S. & Beichman, C. A. 1996, ApJ, 464, L175.
- Heyer et al. (1998) Heyer, M. H., Brunt, C., Snell, R. L., Howe, J. E., Schloerb, F. P. & Carpenter, J. M. 1998, ApJS, 115, 241.
- Heyer & Terebey (1998) Heyer, M. H. & Terebey, S. 1998, ApJ, 502, 265
- Hjellming (1968) Hjellming, R. M. 1968, ApJ, 154, 533.
- Hunter et al. (1990) Hunter, D. A., Thronson, H. A. Jr. & Wilton, C. 1990, AJ, 100, 1915.
- Israel (1978) Israel, F. P. 1978, A&A, 70, 769.
- Joint IRAS Science Working Group (1988) Joint IRAS Science Working Group 1988, IRAS Point Source Catalog, Version 2 (Washington: GPO).
- Joncas et al. (1985) Joncas, G., Dewdney, P. E., Higgs, L. A. & Roy, J. R. 1985, ApJ, 298, 596
- Joncas et al. (1992) Joncas, G., Durand, D. & Roger, R. S. 1992, ApJ, 387, 591
- Kallas & Reich (1980) Kallas, E. & Reich, W. 1980, A&AS, 42, 227.
- Kawamura & Masson (1998) Kawamura, J. H. & Masson, C. R. 1998, ApJ, 509, 270.
- Kerton (1999) Kerton, C. R. 1999, PhD Thesis, University of Toronto.
- Kerton et al. (1999) Kerton, C. R., Ballantyne, D. R. & Martin, P. G. 1999, AJ, 117, 2485.
- Kerton et al. (2000) Kerton, C. R., Martin, P. G., Johnstone, D. & Ballantyne, D. R. 2000, in preparation.
- Kerton & Martin (2000) Kerton, C. R. & Martin P. G. 2000, ApJS, 126, 85.
- Kim et al. (1994) Kim, S-H., Martin, P. G. & Hendry, P. D. 1994, ApJ, 422, 164.
- Lada et al. (1978) Lada, C. J., Elmegreen, B. G., Cong, H-I. & Thaddeus, P. 1978, ApJ, 226, L39.
- Lagache et al. (1998) Lagache, G., Abergel, A., Boulanger, F. & Puget, J.-L. 1998, A&A, 333, 709.
- Laor & Draine (1993) Laor, A. & Draine, B. T. 1993, ApJ, 402, L441.
- Léger & Puget (1984) Léger, A. & Puget, J. L., 1984, A&A, 137, L5.
- Loren (1976) Loren, R. B. 1976, ApJ, 209, 466.
- Loren (1977) Loren, R. B. 1977, ApJ, 218, 716.
- Lyder & Galt (1997) Lyder, D. A. & Galt, J. 1997, AJ, 113, 1310.
- Massey, Johnson & DeGioia-Eastwood (1995) Massey, P., Johnson, K. E. & DeGioia-Eastwood, K. 1995, ApJ, 454, 151.
- Miller & Scalo (1979) Miller, G. & Scalo, J. 1979, ApJS, 41, 513.
- Normandeau et al. (1997) Normandeau, M., Taylor, A. R. & Dewdney, P. E. 1997, ApJS, 108, 279.
- Onake et al. (1996) Onaka, T., Yamamura, I., Tanabé, T., Roellig, T. L. & Yeun, L. 1996, PASJ, 48, L59.
- Oster (1961) Oster, L., 1961, Rev. Mod. Phys., 33, 525.
- Osterbrock (1989) Osterbrock, D. E. 1989, Astrophysics of Gaseous Nebula and Active Galactic Nuclei (Mill Valley, CA: University Science Books).
- Panagia (1973) Panagia, N. 1973, AJ, 78, 929.
- Patel et al. (1998) Patel, N. A., Goldsmith, P. F., Heyer, M. H., Snell, R. L. & Pratap, P. 1998, ApJ, 507, 241.
- Roger et al. (1973) Roger, R. S., Costrain, C. H., Lacey, J. D., Landecker, T. L. & Bowers, F. K. 1973, Proc. IEEE, 61, 1270.
- Roger & Irwin (1982) Roger, R. S. & Irwin J. A. 1982, ApJ, 256, 127.
- Schaerer & de Koter (1997) Schaerer, D. & de Koter, A. 1997, A&A, 322, 598.
- Scoville et al. (1986) Scoville, N. Z., Sanders, D. B. & Clemens, D. P. 1986, ApJ, 310, L77.
- Sellgren (1984) Sellgren, K. 1984, ApJ, 277, 623.
- Shu et al. (1987) Shu, F. H., Adams, F. C. & Lizano, S. 1987, ARA&A, 25, 23.
- Spitzer (1978) Spitzer, L., Jr. 1978, Physical Processes in the Interstellar Medium (New York: Wiley).
- Storey & Hummer (1995) Storey, P. J. & Hummer, D. G. 1995, MNRAS, 272, 41.
- Strömgren (1939) Strömgren, B. 1939, ApJ, 89, 529.
- Strong & Mattox (1996) Strong, A. W. & Mattox, J. R. 1996, A&A, 308, L21.
- Taylor (1999) Taylor, A. R. 1999, in New Perspectives on the Interstellar Medium, ASP Conference Series Volume 168, eds. A. R. Taylor, T. L. Landecker, & G. Joncas (San Francisco, CA: American Society of the Pacific), pp. 3–14.
- Taylor & Gregory (1983) Taylor, A. R. & Gregory, P. C. 1983, AJ, 88, 1784.
- Tenorio-Tagle (1979) Tenorio-Tagle, G. 1979, A&A, 71, 59.
- Thronson et al. (1985) Thronson, H. A., Lada, C. J. & Hewagama, T. 1985, ApJ, 297, 662.
- Usami et al. (1995) Usami, M., Hanawa, T. & Fujimoto, M. 1995, PASJ, 47, 271.
- Vallée et al. (1979) Vallée, J. P., Hughes, V. A. & Viner, M. R. 1979, A&A, 80, 186.
- van der Werf & Goss (1990) van der Werf, P. P. & Goss, W. M. 1990, A&A, 238, 296.
- Veidt et al. (1985) Veidt, B. G., Landecker, T. L., Vaneldik, J. F., Dewdney, P. E. & Routledge, D. 1985, Radio Sciences, 20, 1118.
- Wen & O’Dell (1995) Wen, Z. & O’Dell, C. R. 1995, ApJ, 438, 784.
- Westerhout (1958) Westerhout, G. H. 1958, BAN, 14, 215.
- Whitworth (1979) Whitworth, Ant. 1979, MNRAS, 186, 59.
- Wilking et al. (1984) Wilking, B. A., Harvey, P. M., Lada, C. J., Joy, M. & Doering, C. R. 1984, ApJ, 279, 291.
- Williams & McKee (1997) Williams, J. P. & McKee, C. F. 1997, ApJ, 476, 166.
- Wouterloot & Brand (1989) Wouterloot, J. G. A. & Brand J. 1989, A&AS, 80, 149.
- Wouterloot et al. (1993) Wouterloot, J. G. A., Brand, J. & Fiegle, K. 1993, A&AS, 98, 589.
- Yorke (1986) Yorke, H. W. 1986, ARA&A, 24, 49.
- Yorke et al. (1983) Yorke, H. W., Tenorio-Tagle, G. & Bodenheimer, P. 1983, A&A, 127, 313.
- Yorke et al. (1984) Yorke, H. W., Tenorio-Tagle, G. & Bodenheimer, P. 1984, A&A, 138, 325.
- Yorke et al. (1989) Yorke, H. W., Tenorio-Tagle, G., Bodenheimer, P. & Różyczka, M. 1989, A&A, 216, 207.
- Zhang & Higgs (1997) Zhang, X. & Higgs, L. 1997, ChA&A, 21, 129.


| Property | Value | |
|---|---|---|
| General | DistanceaaData from Kerton et al. (1999) | 2.30.3 kpc |
| Diameter | 5.7 pc | |
| Exciting StaraaData from Kerton et al. (1999) | Name | VES 735 |
| Apparent Magnitude | ||
| Apparent | ||
| Spectral Type | O8.5 V(e) | |
| Radio Cont. (1420 MHz) | Flux Density | 2.350.05 Jy |
| Avg. Emission Measure | 2000 cm-6 pc | |
| 30 cm-3 | ||
| 160 | ||
| 48.05 | ||
| Infrared (IRAS)bbFluxes measured from HIRES images of KR 140 | 110 Jy | |
| 140 Jy | ||
| 970 Jy | ||
| 2300 Jy | ||
| Molecular Line (CO J=1-0) | cm-3 | |
| Current | 4400 |
| Model | AbundanceaaHII – average HII abundance as reported by Ferland (1996) | GrainsbbISM – typical high R grains; Orion – low R grains; see Ferland (1996) for details | Temperature | (ergs s-1 cm-1) |
|---|---|---|---|---|
| 1 | HII | Orion | variable | 4.2 |
| 2 | HII | ISM | variable | 3.6 |
| 3 | HII | none | variable | 4.6 |
| 4 | no He | Orion | variable | 3.9 |
| 5 | no He | ISM | variable | 3.3 |
| 6 | HII | Orion | fixed (7500K) | 3.3 |
| IRAS | ∘ | ∘ | Notes |
|---|---|---|---|
| 02168+6052 | 133.49 | 0.07 | part of dust shell |
| 02160+6057 | 133.37 | 0.12 | part of dust shell |
| 02157+6053 | 133.35 | 0.04 | part of dust shel; molecular core |
| 02171+6058 | 133.49 | 0.17 | no CS or CH3OH detection; colours of UCHII region |
| 02174+6052 | 133.56 | 0.09 | not associated (?) |
| 02156+6045 | 133.39 | 0.08 | not associated (?) |
| Star | ∘ | ∘ | R | I |
|---|---|---|---|---|
| BIRS 128 | 133.50472 | 0.07443 | 20.5 | 13.8 |
| BIRS 129 | 133.42336 | 0.11588 | 19.6 | 13.1 |
| BIRS 130 | 133.42205 | 0.09973 | 20.5 | 13.8 |
| BIRS 131 | 133.40169 | 0.04194 | 18.7 | 13.6 |
| BIRS 132 | 133.40358 | 0.04767 | 18.0 | 13.7 |