E-mail: nancy@epona.physics.ucg.ie
High resolution near-infrared polarimetry of Carinae and the Homunculus Nebula
Abstract
High resolution near-infrared adaptive optics imaging and polarimetry have been obtained of the Homunculus Nebula and its central illuminating star Carinae (HD 93308). Images and maps of the linear polarization at a resolution of 0.2′′ have been made in the J, H and K bands and in a narrow 2.15m continuum band (Kc). The overall appearance of the nebula in the near-IR is similar in all bands and to that at V, with specific features less sharp to longer wavelengths. A comparison between the published HST WFPC2 1.042m map and the AO J band image demonstrates that ground-based AO resolution can approach that of HST. The large-scale pattern of polarization vectors is centro-symmetric demonstrating that single scattering dominates everywhere except perhaps in the central bright core. The only difference between the near-IR and optical appearance is a narrow linear feature at position angle 320∘ extending across the NW lobe of the Homunculus. Polarization maps at Kc in the near vicinity of Carinae were restored using a PSF derived from blind deconvolution. There is a definitely detected extension in the direction of the optically visible speckle knots and an estimate of 18% for the polarization of one of the knots was made. This level of polarization suggests that the knots arise in dust+gas clouds in the near environment of Carinae, perhaps in an equatorial disc.
The most remarkable result of the linear polarization mapping is the level of similarity in the spatial structure, and also in the degree of linear polarization, between the near-IR and optical data. Comparison of the polarization along the projected major axis of the Homunculus shows values in the SE lobe to within a few percent from V band to 2.2m. In the NW lobe the near-IR linear polarization values agree to within a few percent over the 1.2-2.2m range, but are upto 10% lower than at V. Such a polarization pattern cannot arise in Mie scattering from a single power law distribution of grain sizes unless the particles are very small compared with the wavelength, in disagreement with mid-IR observations. In addition the colour dependence of the extinction was found to be shallower than the typical ISM, indicating the presence of large grains. Several possibilities are explored to try to explain these contradictory results. Optical depth effects and a broad distribution in grain sizes are favoured, perhaps with a dependence of the grain size with depth into the small obscuring clouds in the lobes of the Homunculus. However the presence of aligned grains, previously inferred from mid-IR polarization, may also affect the scattered radiation from the dust.
Key Words.:
reflection nebulae - stars: individual: Eta Carinae - techniques: polarimetric - techniques - adaptive optics1 Introduction
Carinae, situated in the Carina complex at about 2.3kpc (Davidson & Humphreys dahu97 (1997)), is one of the most massive stars known in the Galaxy and is going through the Luminous Blue Variable phase (Humphreys & Davidson huda94 (1994)) of unsteady mass loss (Davidson et al. da86 (1986)). During the 1840’s it underwent an outburst and reached visual magnitude -1; since then is has been emerging from the dust which condensed after this ejection (Walborn & Liller, wali (1977)). Long term monitoring of optical, IR, radio and X-ray spectra has revealed evidence of periodicity perhaps related to a binary or multiple star at the core of the nebula (Daminelli et al. dam97 (1997)).
The compact nebula around Carinae (HD 93308), called the Homunculus, was first shown by Thackeray (tha56 (1961)) to be highly polarized. The initial polarimetry was confirmed by Wesselink (wess (1969)) who measured linear polarization of around 40%. Visvanathan (vis (1967)) observed that the polarization centred on Carinae was almost constant with wavelength from U to R and increased with increasing aperture size. In a small aperture, higher polarization was observed on the NW side of the nebula than on the SE. The first systematic polarization maps were made by Warren-Smith et al. (warr (1979)) in the V band and demonstrated a centro-symmetric pattern of polarization vectors with a marked asymmetry in the polarization values along the major axis (position angle 130∘) with values upto 40% in the NW lobe. To produce such high values of polarization in a reflection nebula, Mie scattering by silicate particles with a size distribution weighted to smaller particles was invoked and modelled by Carty et al. (cart (1979)). In the near (0.5′′) vicinity of Car itself, speckle masking polarimetry in the H line and local continuum has revealed evidence for a compact equatorial disc aligned with the minor axis of the Homunculus (Falcke et al. falc (1996)). Within 1′′ of Car the polarization vector pattern does not remain centrosymmetric in the R band, suggesting that local structures and perhaps intrinsic emission may contribute to the morphology and scattered light (Falcke et al. falc (1996)). Polarimetry in the mid-infrared, where the dust emits rather than scatters radiation, shows an entirely different pattern of polarization vectors with a trend to be oriented radially, particularly near the boundary of the emission (Aitken et al. ait95 (1995)). Such a pattern can be interpreted in terms of emission from aligned grains; Aitken et al. (ait95 (1995)) suggest that the alignment mechanism may be gas-grain streaming, driven by the high outflow velocity, or a remnant magnetic field from a dense magnetized disc.
There is a wealth of IR observations of Car and the Homunculus on account of its intrinsic IR brightness, first observed by Westphal & Neugebauer (wene (1969)), and astrophysical interest. The IR spectrum is characterized by a peak around 10m, indicative of silicate grains (Mitchell & Robinson, miro (1978)). There is a central IR point source together with a second peak on the minor axis of the nebula, whose separation increases from 1.1 to 2.2′′ from 3.6 to 11.2m (Hyland et al. hyl (1979)). The near-IR spectrum of Car shows a steep increase with wavelength and prominent hydrogen lines of the Paschen and Brackett series as well as He I lines (Whitelock et al. whi (1983)) and weaker Fe II and [Fe II] lines (Altamore et al. alta (1994)). Maps in the J, H and K bands show that the structure is dominated by scattering, but beyond about 3m dust emission dominates (Allen all89 (1989)), with many clumps present. High spatial resolution observations have reported an unresolved central source (at L and M band, Bensammar et al. bens (1985)), with filaments and unresolved knots within 1′′ detected in many IR bands (Gehring gehr (1992)). Maps in the mid-IR show a similar structure and the compact central source has a dust temperature 650K and dust mass of 10-4M⊙ with nearby dusty clouds associated into loop features (Smith et al. smai (1995)). This source has been so prodigiously studied at so many wavelengths that it possesses its own review article in Annual Reviews of Astronomy and Astrophysics (Davidson & Humphries dahu97 (1997)).
Car can be considered an ideal source for adaptive optics on account of its very bright central, almost point, source (V7mag. - van Genderen et al. vang (1994)) and the limited radial extent (10′′) of the Homunculus, which means that the source itself can be used as a reference star for the wavefront sensor. As a consequence, off-axis anisoplaniticity does not significantly affect the adaptive optics (AO) correction out to the edges of the nebula. Previous near-infrared AO imaging of Car was obtained (Rigaut & Gehring rige (1995)), including some limited polarimetry (Gehring gehr (1992)) using the COME-ON AO instrument. Here we report on dedicated high resolution near-IR AO imaging polarimetry conducted at J, H, K, and in a continuum band at 2.15m, using the ADONIS system and SHARP II camera with the aim of studying the small-scale polarization structure of the Homunculus. The observations are described in Sect. 2; the reductions and polarization data are presented in Sect. 3 and the relevance of the results for the structure and dust properties of this remarkable reflection nebula are discussed in Sect. 4.
2 Observations
Imaging polarimetry of Carinae was obtained with the ADONIS Adaptive Optics instrument mounted at the F/8.1 Cassegrain focus of the ESO 3.6m telescope. ADONIS is the ESO common-user adaptive optics instrument; it employs a 64 element deformable mirror and wave-front sensor (Beuzit et al. bez97 (1997)). For the observations of Car, a Reticon detector was used as the wave-front sensor. The camera is SHARP II - a Rockwell 2562 HgCdTe NICMOS 3 array (Hofmann et al. hof95 (1995)). The pixel scale was chosen as 0.050′′2, giving a field of view of 12.812.8′′. Although this field does not encompass the full extent of the Homunculus nebula it was chosen so that well-sampled diffraction limited imaging would be possible in at least the H and K bands. Table 1 lists the observations; the two orientations, referred to as A and B, had Car in the lower right and upper left of the array respectively (east is up; north to the right) enabling full coverage of the Homunculus. The narrow band 2.15 m (henceforth Kc) observations were made with Car in the centre of the array. For each filter and orientation, exposures were made at 8 position angles of the polarizer: 0.0, 22.5, 45.0, 67.5, 90.0, 112.5, 135.0, 157.5∘ in sequence. In addition a repeat of the 0∘ exposure was made with the polarizer angle set to 180∘ in order to check the photometry and repeatability of the polarimetric measurements. Each full sequence of polarization measurements at the 8+1 position angles was repeated as specified in column 6 of Table 1. Offset sky chopping was employed and the relative position of the offset sky is listed in column 5 of Table 1; the exposure on sky was equal to the on-source time. As discussed in Ageorges & Walsh (agwa (1999)) it was not possible to calculate reliable K band polarimetry; these data will therefore only be discussed in terms of their high resolution imaging. On 1996 March 03 due to a technical problem, the computer control of the chopper malfunctioned and the offset sky had to be observed subsequent to each sequence of polarizer angles, and in some cases the exposure time on source was greater than on background sky. The last column of Table 1 gives an indication of the external seeing as measured by the Differential Image Motion Monitor at La Silla during the observations. Photometric standards were not observed and no attempt has been made to determine accurate magnitudes in the J, H, K and Kc filters.
| Field | Filter | No. | Exp. | Offset sky | No. | Date | Seeing |
|---|---|---|---|---|---|---|---|
| , (m) | Frames | (ms) | ,(′′) | Repeats | (′′) | ||
| KA | 2.16,0.16 | 200 | 50 | 0,-18 | 2 | 1996 Mar 01 | 1.2 |
| KB | -18,0 | 2 | |||||
| HA | 1.64,0.18 | 200 | 50 | 0,-18 | 2 | 1996 Mar 02 | 0.8 |
| HB | -18,0 | 2 | |||||
| JA | 1.25,0.15 | 200 | 50 | 0,-18 | 1 | 1996 Mar 03 | 0.7 |
| JB | -18,0 | 1 | |||||
| Kc | 2.145,0.017 | 100 | 50 | -18,0 | 2 | 1996 Mar 03 | 0.8 |
Polarized and unpolarized standards were observed in the course of the observations to determine the instrumental polarization and any rotation of the instrumental plane of polarization. The star HD 64299 which is relatively close to Car was observed at J, H and K as an unpolarized standard (polarization 0.15% at B (Turnshek et al. turn (1990)) and assumed to be low in the IR, although the actual values are not measured) and a point source for deconvolution. In the Kc filter, the star HD 94510 was observed. These stars were chosen primarily to be bright but not so bright as to saturate the SHARP II camera. ADONIS observations of these stars and the polarized reference sources are fully described in Ageorges & Walsh (agwa (1999)), where the observational details are also given.
3 Reductions and Results
3.1 Basic reduction
The data cubes at each position of the polarizer consists of M 256256 pixel frames, where M is given as the number of frames in Table 1. To produce a single image for each of the nine selected polarizer angles, the data were flat fielded using images obtained at the beginning of the night on the twilight sky with an identical set of polarizer angles. The data cubes were used to derive a bad pixel map as described by Ageorges & Walsh (agwa (1999)) using a sky variation method. The sky from the offset position was subtracted separately from each of the M frames before combination into a single image for each polarizer angle. These reductions were performed with the dedicated adaptive optics reduction package ‘eclipse’ (Devillard devil (1997)). The data frames at position angle 157.5∘ were not used in any computations of polarization on account of the discrepancy noted by Ageorges & Walsh (agwa (1999)). The reduced data then consisted of 2 sets of K band image pairs; 2 sets of H band image pairs; and 1 set of J band images; all with Car displaced from the centre of the detector and 1 set of Kc filter images centred on Car.
3.2 Registration of images
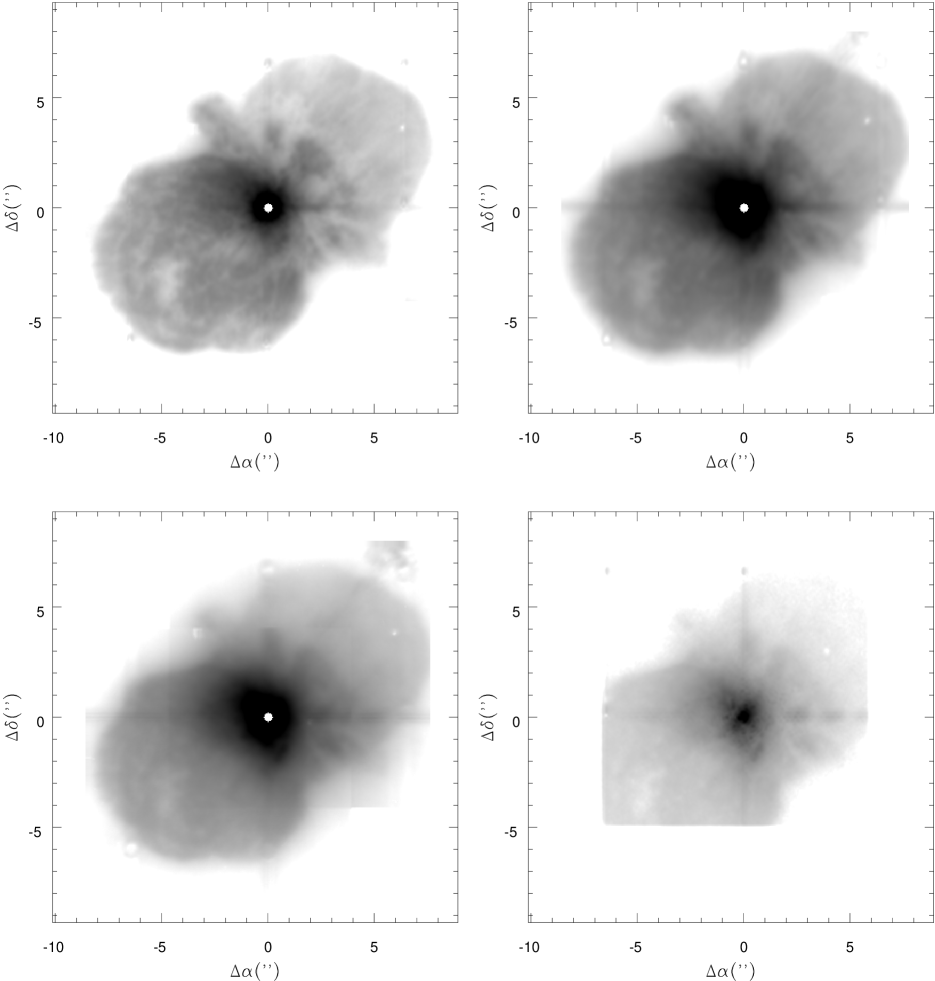
The rotation of the polarizer induces a small shift of upto 3 pixels in the position of the images (see Ageorges & Walsh agwa (1999), Fig. 2) and coupled with the (intended) shifts of Car across the SHARP II field, it is necessary to carefully align all images to a common centre in order to calculate precise colour or polarization maps for the whole of the Homunculus. On the J, H and K frames, the image of Car was saturated (overflow of A-to-D converter). The centroids of all the J, H and K images were determined using a large radius (30 pixels = 1.5′′); it was found that with such a large radius the centroid was not sensitive to the saturated core (typically a few pixel radius). Combined images of the coverage of the whole nebula, at each position of the polarizer, were formed by shifting, and rotating by 90∘, each image pair (e.g. JA and JB which were taken consecutively) to a common centre and averaging the pixels in common. The rotation was required to produce astronomical orientation. Shifts were restricted to integer pixels, thus the alignment can have a maximum error of 0.050′′. The alignment procedure was carefully checked by examining the coincidence of features in the nebula and in the core when saturation was not severe (e.g. in the J band images in particular). Where there were repeats of the full combined image (column 6 of Table 1), the two sets of images were averaged. The result was an image of dimensions 326326 pixels (16.316.3′′) with no data in the top left and lower right corners. Figure 1 shows the J, H, K and Kc total flux images (i.e. Stokes I) on a logarithmic scale. All images have identical scale and orientation. In the J, H and K images the saturation of the central source is indicated by the zero flagged pixels (region of radius 4 pixels about position of peak). There are a variety of artifacts: diffraction spikes along the principal axes caused by the secondary support; low level changes consequent on merging images (the overlap regions were used to scale the image pairs); a doughnut shaped feature caused by a hot pixel cluster which occurs at equal declination values at the extremity of the NW and SE lobes and near the rim of the NW lobe. These features, which are most apparent on the colour maps (Fig. 2), have not been masked out but are obviously not interpreted.
3.3 Colour maps
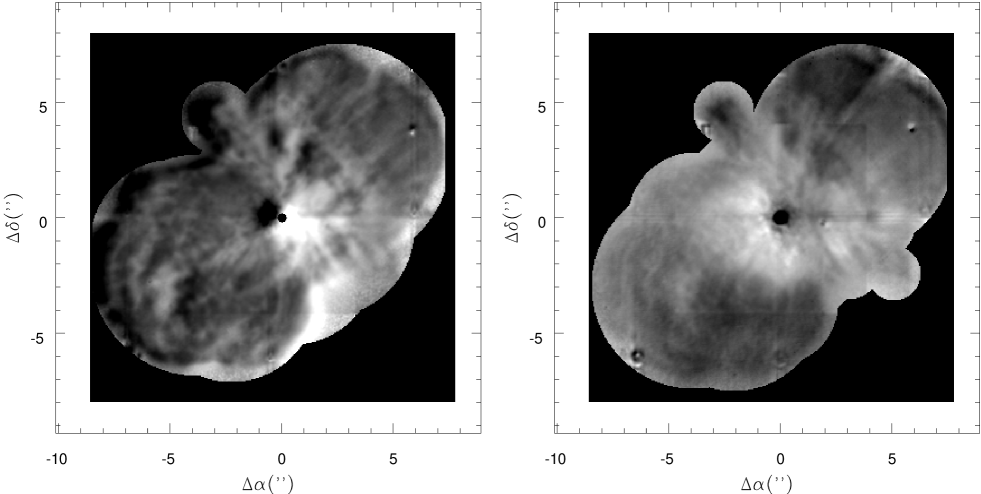
‘Colour’ maps were made by ratioing the J, H and K images. A cut-off in the form of a mask was applied to each colour map in order to prevent division by small numbers and produces the sharp bulbous edges in the maps. Figure 2 shows the J/H and H/K images on a logarithmic scale. On account of saturation the values over the core do not hold any colour information and have been set to zero. The range of valid ratio values are: (J-H) 0.02 - 2.5 mag.; (H-K) 0.02 - 1.5 mag.
3.4 Polarization maps
The linear polarization and position angle were calculated for the combined maps by fitting a cosine 2 curve to values at each point as a function of polarizer angle as fully described in Ageorges & Walsh (agwa (1999)). The discrepant point at PA 157.5 was not included in these fits (Ageorges & Walsh agwa (1999)). The input images were binned to improve the signal-to-noise in the polarization determination at the expense of spatial resolution. In addition a cut-off in polarization signal-to-noise (i.e. ) was applied to exclude points with large errors, such as at the edges of the Homunculus. Figure 3 shows the J, H and Kc band polarization vector maps superposed on logarithmic intensity contour maps to be directly compared to the images in Fig. 1. The data were binned into 44 pixels (0.20.2′′) before calculating the polarization; the polarization cut-off was set at errors of 2% for the J and Kc maps and 1.7% for the H band map.

3.5 Restoration of 2.15m images
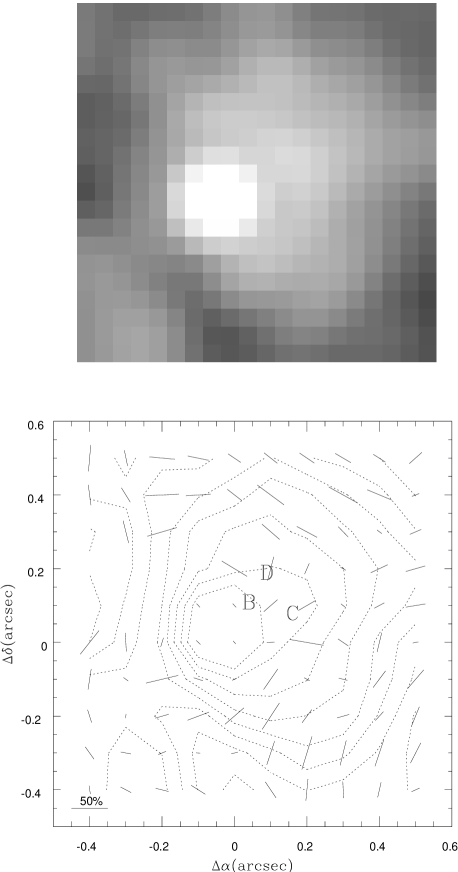
As described in Ageorges & Walsh (agwa (1999)) the Kc images were restored using the blind deconvolution algorithm IDAC (Jeffries & Christou jeff (1993)) to determine the PSF of the images. Only the central 128128 pixel area was restored to save computer time and only the images at polarizer angles of 0, 45, 90 and 135∘ were employed. Figure 4 shows the logarithmic total intensity map over the central 11′′ area resulting from restoring the four reduced images using the Richardson-Lucy algorithm (Lucy luc74 (1974)) with the IDAC PSF; the resulting image was reconvolved with a Gaussian of 3 pixel FWHM (0.15′′) since this is about the expected diffraction limited resolution at this wavelength.
A polarization map was calculated from the four restored 11′′ images and is shown in Fig. 4 for direct comparison with the logarithmic image. The data were binned 22 pixels before calculating polarization and the polarization cut-off error was 4%. An attempt was made to calculate the polarization at the positions of the speckle knots, discovered by Weigelt et al. (Weigelt & Ebersberger wei86 (1986) and Hofmann & Weigelt hof88 (1988)), whose positions are shown in Fig. 4. Knot A is the central (assumed) point source whilst knots B, C and D are to the NW at offsets of 0.114 (B), 0.177 (C) and 0.211′′ (D); these offsets correspond to only 2.3, 3.5 and 4.2 pixels in the images. In the restored images no distinct knots could be discerned at these positions but it is clear from Fig. 4 that there is an apron of IR radiation in the NW direction strongly hinting on an area of elevated brightness in the vicinity of these knots.
Aperture photometry of the Weigelt et al. knots in a 22 pixel area was performed for the three sets of images - restored with IDAC, Richardson-Lucy restored with the IDAC PSF and Richardson-Lucy restored. All the restorations were convolved with a Gaussian of 3 pixel FWHM. For the three images the aperture polarization determinations showed that knot B could not be distinguished from knot A (identical polarization within errors). Knot C showed very differing results depending on the method (it lies on a diffraction spike); only for knot D could a fairly consistent value of polarization be determined. From the three methods a mean polarization of 18 7 % and a position angle of 17 14 ∘ was derived for knot D. Given the position angle of knot D from knot A of 336∘ (Hofmann & Weigelt hof88 (1988)), a position angle of the polarization vector of about 60∘ is expected. To reconcile this discrepancy, it is suggested that knot D may not be directly illuminated by Carinae, i.e. there is multiple scattering within this core region which would not be too surprizing given the high (gas) densities (Davidson et al. davebb97 (1997)). The mean total intensity ratio knot A/knot D was 10:1, to be compared with the value of about 12:1 given by Hofmann & Weigelt (hof88 (1988)) for a wavelength of 8500Å. It is justified to attempt polarimetry at these positions since the images of Morse et al. (morse (1998), Fig. 5) and Ebbets et al. (ebb94 (1994)) show no obvious indication that the knots have substantial proper motion. This supposition is partly supported by the low radial velocities measured by Davidson et al. (davebb97 (1997)) who classify these knots as ‘compact slow’ ejecta from Car.
4 Discussion
4.1 Morphology
In the near-IR, scattering still dominates the structure of the Homunculus nebula as it does in the optical, and the general appearance is similar. The features in the colour maps in Fig. 2 correspond to those well known in the Homunculus (see for example the sketch of the various morphological features in Fig. 3 of Currie et al. curr (1996)). The paddle to the NW, which is bluer, as are the two knots at PA 0 and 280∘, are interpreted as belonging to the disk in which Carinae resides (see e.g. the sketch of Smith et al. smigeh (1998), Fig. 10). The jet NN to the NE is weaker at H and is barely detected at K, probably on account of lower extinction towards this jet in comparison to the Homunculus (assuming that scattering dominates this structure). The skirt to the SW is less striking in all the IR maps compared with the optical (see the beautiful HST images reproduced in Morse et al. morse (1998)) and does not show a distinct colour in Fig. 2. The SE lobe presents a more speckled appearance than the NW one where there are some radial features which show up well in the colour maps. The most prominent large scale feature in the H-K colour map (Fig. 2) is the dark trench extending over most of the NW lobe at PA 320∘. This feature is barely visible in the J and H maps but is much brighter at K. The ‘hole’ in the SE lobe, detected in the mid-IR by Smith et al. (smigeh (1998)), has rather red J-H and H-K colours; its western edge is noticeably brighter at J. The hole in the NW lobe, detected in the mid-IR images of Smith et al. (smigeh (1998)), is not visible in the near-IR images. The rim of the SE lobe is notably blue in the J-H map whilst it is barely discernable in the H-K map; the rim of the NW lobe is notably redder. These differences must be primarily due to differing amounts of line of sight extinction at the periphery of the lobe:- the SE lobe which is tilted toward the observer suffers less extinction than the NW lobe which is tilted away.
The trend noted by Morse et al. (morse (1998)) that structures become less pronounced with increasing wavelength continues into the near-IR. Figure 5 (upper) shows a cut in Log flux along the major axis (taken as PA 132∘) of the Homunculus from the J, H, K and Kc maps shown in Fig. 1. The central 2′′ is not shown for the J, H and K maps since the images of Carinae are saturated in this region. The effect of smoothing out of features is clear from this plot. This is more strikingly seen in Fig. 6 where an attempt has been made to display the near-IR flux distribution (linear scale) along the same cut shown by Morse et al. (morse (1998)) [their Fig. 6]. Note in particular the depth of the feature centred at offset 1.3′′ which shows a central depression of 40% of the peak value at 1.9′′ for a wavelength of 1.25m, compared to 94% at 0.63m. The lower contrast with increasing wavelength can be attributed to lower extinction, through the Homunculus lobes, of many small (0.3′′) optically thick knots. Such knots block the transmission of scattered radiation from Carinae through the front side of the lobes and on account of their optical thickness do not show much scattered light from their near sides. This can account for the more dappled appearance of the nebula in the J-H than the H-K colour map (Fig. 2).
Figure 6 reveals that at some positions of the nebula there can be substantial differences in the structure with wavelength: the peak at 3.3′′ in the K band, which is hardly noticeable at J, is the most prominent feature in this comparison. This peak is seen on the colour maps in Fig. 2 as the dark region in the H-K map south of Carinae. Whilst there are some colour differences over the near-IR range towards the edge of the nebula the most prominent are in the central (44′′) area. The knots in the NW lobe within 3.5′′ of Carinae are stronger in the J image than at longer wavelengths. This region is also marked out by having a distinctly lower polarization and corresponds to the disc (e.g. Smith et al. smigeh (1998)), which has a very different orientation to the Homunculus. The axis of the Homunculus is assumed to be tilted at about 35∘ to the plane of the sky (e.g. Meaburn et al. mea93 (1993); Davidson et al. davebb97 (1997)). However the HST proper motion studies favour a higher inclination of about 50∘ (Currie, 1999, priv.comm); the double flask model of Schulte-Ladbeck et al. (schul (1999)) has a 60∘ tilt to the plane of the sky. Differences in structure between the optical and near-IR can be understood in terms of increasing optical thinness with wavelength; at K the outer regions of the disk are optically thin and the sightline extends to the core of the Homunculus. This is also confirmed by features of the polarization maps (Sect. 4.2).
The J band image was compared in some detail with the HST F1042M image presented by Morse et al. (morse (1998)) as Fig. 4. The 1.04m HST image, which differs by only 0.24m in central wavelength from the J band image. These images make an excellent image pair for comparing HST with ground-based adaptive optics, although the AO image has not been deconvolved. The J band image is definately ‘fuzzier’. This must partly be due to the trend for features to be smoother at longer wavelengths but probably is primarily due to the differing character of the AO PSF compared with HST, since the diffraction limits are comparable (0.07′′ at J for ESO 3.6m and 0.09′′ at 1.04m for HST). Clearly the ground-based AO image is approaching the HST image in terms of resolving sharp features close to the diffraction limit. The only difference noticed between the images was the presence of a narrow bright feature running through the dark region at approximately =1,=-2′′ on the J band image. Presumably this distinct feature corresponds to a shaft of radiation escaping from the central disc.
The restored Kc map of the central region shown in Fig. 4 definitely shows an extension in surface brightness in the direction of the speckle knots (Weigelt & Ebersberger wei86 (1986) and Hofmann & Weigelt hof88 (1988)). As discussed by Ageorges & Walsh (agwa (1999)) several methods were used for restoring this image and all showed the presence of this feature, so its reality seems probable. That it is visible at K, in the UV and optical, strongly suggests that dust scattering is the common spectral feature, although these knots are known to have extraordinary line emission (Davidson et al. davebb95 (1995); Davidson et al. davebb97 (1997); Davidson et al. da99 (1999)). In Fig. 7 of Davidson et al. (davebb97 (1997)), the brightness profile of the continuum in the NW shows an extension in comparison with the SE direction and this was suggested as scattered light from dust in the speckle condensations C and D. The detection of an extension in this direction at Kc (the filter avoids the Brackett and He I lines, so is presumably pure continuum), confirms this interpretation. The polarization value derived for knot D in Sect. 3.5, although rather uncertain, suggests a scattering origin. Comparing the images in Fig. 4 with those presented in Fig. 5 of Morse et al. (morse (1998)), over almost identical regions, shows similarities to the NW of the central source but no detailed correspondence to the SE. This can be understood in the canonical picture that here the disk, tilted by some 35∘ to the line of sight, is being viewed obliquely and the radiation escapes preferentially towards the observer to the NW. That any UV continuum is visible at all to the NW indicates that the extinction must be fairly low and confirming the knots B-D as features on the nearside of the obscuring disc material.
The only ‘new’ morphological feature to come from the high resolution IR maps of the Homunculus is the linear feature at PA 320∘. This is seen on the H and K images and well seen in the H-K colour map (Fig. 2), but not in the J band (Fig. 1). The position angle of the linear feature points back to the position of Carinae and coincides with that of one of the whiskers detected outside the Homunculus by Morse et al. (morse (1998)) - WSK320 (see also Weis & Duschl weis (1999)). This ‘whisker’ has a high positive velocity (Weis & Duschl weis (1999)) and a suggested high proper motion (Morse et al. morse (1998)). The linear feature is also aligned with the only region of IR flux detected beyond the extent of the Homunculus, designated as NW-IR. This knot appears to be a rather diffuse cloud of extent 2′′, which is very red: the K/H flux ratio of the knot is twice that of the nearby region of the NW lobe of the Homunculus. NW-IR is highly polarized at H and well detected; the value of linear polarization is 36% in a 0.5′′ aperture. This value is slightly larger than the corresponding values for the edge of the Homunculus nearest the knot (see Fig. 3 where the feature is apparent and Fig. 5 for the polarization at the edge of the Homunculus). It is a real feature as it was observed on both H and K band images (the signal-to-noise was not large enough to detect it on the Kc image) and is presumably a dusty knot on the symmetry axis of the NW lobe. It was not however seen on the 2.15m image of Smith et al. (smigeh (1998)) perhaps on account of lower signal-to-noise.
If the whiskers are high velocity ejecta then considering their high length-to-width ratio, an extreme collimation mechanism is suggested. The detection of an aligned feature inside the Homunculus suggests that this could be a spatially continuous jet feature extending from close to Carinae. There is slightly elevated polarization (3-4% above the mean of the surroundings) on this narrow feature with a trend to lower polarization on both sides of its length (1-2% less). The elevated polarization suggests that the feature cannot be intrinsic line emission which would dilute the polarized flux. From the HST WFPC2 images, the whiskers are however bright in [N II] line emission. The detectable polarization within the Homunculus and the presence of a dust cloud at the end of this linear feature suggests a confined dust+gas feature. The NW-IR dust cloud is however in strong contrast with the highly confined line emission. It cannot be directly claimed that both are aspects of the same phenomenon although it is highly suggestive. It is suggested that the reason the linear feature is not seen at optical wavelengths and in the J band is on account of its being confined to the inside of the Homunculus where there is enough extinction to mask it at lower wavelengths. Clearly this feature would repay further study at high spatial resolution and with spectroscopy. No IR features were convincingly seen associated with any of the other whiskers. The jet NN is probably ballistic (e.g. Currie et al. curr (1996)) and the whiskers may be also; so detectable remnants may be expected extending back to Carinae itself. The confusion by extinction and dust scattering however makes this a difficult task.


4.2 Linear Polarization structure
The polarization maps shown in Fig. 3 have a smooth appearance. The structure of the polarization vectors shows no strong evidence for diverging from the characteristic centro-symmetric pattern indicating illumination by a central source. This result is in contrast to the optical polarization maps of Warren-Smith et al. (warr (1979)), which show a slightly elliptical pattern of polarization vectors. This difference indicates that the dust must be substantially optically thick in the central waist in the optical but thin in the J to K region. The overall smoothness of the polarization maps indicates that there cannot be substantial variations in the positions of the scattering centres along the line of sight through the lobes otherwise the polarization would vary between say the back and front of the lobe (assuming a Mie scattering origin in which the polarization depends solely on scattering angle). However if the nebula is composed of optically thick small clouds then the scattering is always from the side facing the observer and no single scattered flux is received from the rear side of a dense cloud. The overall smoothness of the centro-symmetric pattern also shows that there must not be much, if any, multiple scattering occurring in the Homunculus itself. The central region in the restored Kc polarization map (Fig. 4) appears to show some regions which depart from the centrosymmetric pattern. However these regions coincide with the positions of the telescope spider where the polarization determination is unreliable.
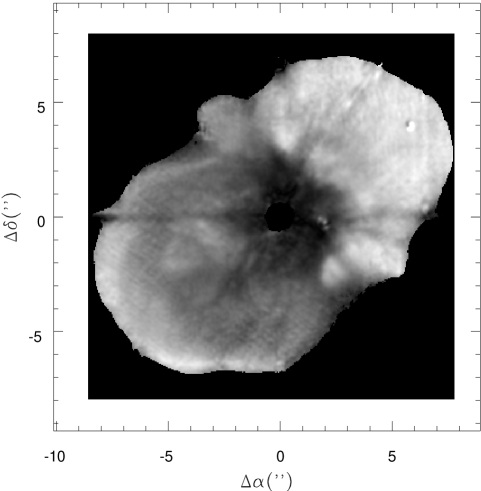
Comparison of the polarized and unpolarized images at J and H does not show intermediate scale features ( few times the diffraction limit) with lower polarization, corresponding to emission regions. The dominant features are the lower polarization central region and the more highly polarized lobes. The polarization structure along the NN jet to the NE is very similar in both J and H and shows a plateau at 20% at distances from 3.6 to 5.8′′ offset (in PA 33∘). The demarcation between the regions of the higher polarization lobes and the lower polarization central region is rather abrupt especially to the NW and W (the change from black to white on Fig. 7); to the SE it merges into the lower polarization of the lobe tilted towards the observer. The lower polarization region centred on Carinae is roughly rectangular in shape (see the H band polarization map - Fig. 7) with dimensions 5.55.0′′; the longer axis is perpendicular to the major axis of the Homunculus. If this region is interpreted as the disc with an inclination 90∘ to that of the Homunculus, then the NW region has the smaller inclination to the line of sight and the low polarization could arise on account of small scattering angles. The SE section of the disc should be behind the SE lobe and would therefore have low polarization on account of large scattering angles, be faint and relatively obscured by dust in the foreground lobe. For an inclination of the disc of 35∘ to the line of sight, the deprojected diameter is 10′′ which is similar to the projected minor axis diameter of the nebula (PA 42∘) excluding the NN jet and the skirt to the SW. It has been suggested that the central low polarization region reflects a change in grain properties (Smith et al. smigeh (1998)). However if the grains were smaller in the disc than in the lobes, then the polarization should be larger at long wavelengths.
The values of the linear polarization along the projected major axis at J, H and Kc (Fig. 5) are very strikingly similar. This can be compared to the polarization along the same axis at V shown in Warren-Smith et al. (warr (1979)) [Fig. 2 with direction reversed] and Schulte-Ladbeck et al. (schul (1999)), Fig. 9. From a low plateau of about 5% in the central region, the polarization rapidly increases to about 20% at 2.5′′ NW and less steeply to 13% at 2.5′′ SE. In the SE lobe the polarization values are identical to within 2% at J and H (i.e. within the errors). The shape of the polarization profile is also identical to that at V (Schulte-Ladbeck et al. schul (1999)) but the V values are 3% higher on average with the SE edge about 6% higher, i.e. definately larger than the typical errors. In the NW lobe the J polarization has a pronounced peak at 3.3′′; this peak is also apparent at V but less pronounced at H. The J and H values both increase steadily from 25% at 4′′ offset to 33% in J and 30% in H band at 8′′ offset. At V the polarization has a different behaviour: it is higher (around 40%), flatter with offset and shows a decrease beyond 7′′.
The change in the magnitude of the peak at 3′′ offset NW with wavelength can be interpreted as caused by different extinction optical depths in the various bands. At J (and V), the scattering arises predominantly in the equatorial disc, which has an inclination of about 35∘ and thus gives rise to polarization from scattering angles at around this value; at H the optical depth is lower and the disc begins to become transparent at this wavelength and there is a greater contribution of scattered flux from the rear lobe of the Homunculus. Further out in the NW lobe the H band polarization is systematically a few percent higher than at J whilst the V band polarization is about 10% higher. The difference between V and J band polarizations is readily understood in terms of the scattering at longer wavelength arising from deeper within the lobe since the line of sight extinction optical depth is lower. The V band polarization in the NW lobe, which is tilted away from the line of sight, arises predominantly from the nearside of the lobe where the scattering angle is closer to 90∘. The elevated polarization in the H band over the J band is the reverse of the trend of polarization decreasing with wavelength, but consistent with the presence of grains small with respect to the wavelength. However the deduction from the mid-IR data and colour temperature maps of Smith et al. (smigeh (1998)) suggest the hotter (400K) core dust is caused by smaller (0.2m) grains and the cooler (200K) outer lobes by larger (1-2m) silicate grains (see also Robinson et al. rob87 (1987)). None of these suggested grain sizes can explain the small changes of polarization with wavelength in the optical-IR range.
In Fig. 6 (upper) the linear polarization at J, H and Kc across the cut of Morse et al. (morse (1998)) is shown. The similarity of overall values is again apparent as for the projected major axis (Fig. 5), but there are local differences. At offset 1.5 to 2.0′′ for example, there is a distinct dip in the polarization at J by 4% and at offset 3 to 4′′ the peak in emission at Kc has lower polarization than at J and H. These differences can be interpreted as due to scattering from material at different depths within the nebula suffering differing amounts of extinction giving rise to different scattering angles and hence lower polarization. The dip at 1.5 to 2.0′′ is accountable by extinction at J biasing the polarization to regions nearer to the observer; the region at 3.5′′ coming from a more extincted rearward region, perhaps in the equatorial disc.
4.3 Dust properties and structure
The most surprizing result of the IR polarization measurements is that the polarization along the long axis shown in Fig. 5 is so similar in J and H. In the SE lobe the polarization values are also within a few percent of those at V. This was totally unexpected. For scattering by grains small enough to produce 30% polarization at V, the H band polarization should be 80-90% since the particles are now much smaller than the wavelength (approaching the Rayleigh scattering regime). Alternatively the grains are very small and Rayleigh scattering occurs at all wavelengths; however then it is not clear why the polarization values are not larger. If there is a substantial unpolarized component which dilutes the polarized flux, say from a different grain size population, then it would be expected that this is wavelength dependent. The only strong wavelength dependent difference is the higher polarization at V than in J and H by about 10% in the NW lobe, the reverse of the behaviour expected by scattering of grains small with respect to the wavelength.
One possibility for the lower than expected polarization at J and H from the Mie scattering prediction could be dust emission from the warm grains. This would become more significant with longer wavelength; thus some depolarization would be expected at K. The similarity of the Kc and H polarization shows that little depolarization is detected, thus refuting any influence on the J and H polarization values. If the grain properties were changing with position in the nebula this would be expected to have an effect on the behaviour of polarization at different wavelengths. In the NW lobe the differences between V and near-IR polarization can be attributed to differing scattering angles. If the line-of-sight optical depth is low the scattering region dominating the observed flux is deeper inside the lobe than for a high line-of-sight optical depth. The scattering angle for the lower line-of-sight optical depth will be larger. In the SE lobe there is no large-scale difference in polarization from V to K, corresponding to a situation where the line-of-sight optical depth is low or does not vary much.
In order to highlight this conclusion in Fig. 8 the polarization is plotted at four positions in the nebula defined by square 0.50.5′′ apertures. These positions were chosen in regions where the polarization distribution is fairly flat to give a representative estimate rather than an average over a wide range of values. The positions were chosen at (, ): (4.75,4.85), (1.15,0.55), (0.55,1.70) and (2.05,0.55) arcsec, representing offset distances of 6.8, 1.3, 1.8 and 4.9′′ from Carinae respectively. Assuming that the axis of the Homunculus is tilted by about 35∘ to the plane of the sky (Meaburn et al. mea93 (1993) Davidson & Humphreys dahu97 (1997)), the scattering angles of the first and last regions are 125 and 65∘ (or 140 and 40∘ for a 50∘ tilt to the plane of the sky). The region at (1.15,0.55) arcsec is expected to be in the disc and thus have a scattering angle about 35∘. The scattering angle for the third region (0.55,1.70′′) is not easily predicted and the polarization was used to place it at an appropriate scattering angle by interpolation. A value of about 45∘ is suggested.
An attempt was made also to plot the scattered flux in Fig. 8 by scaling the total counts in the images to the near-IR photometry of Whitelock et al. (whi94 (1994)). Since the near-IR magnitudes are decreasing with time, an approximate extrapolation was made to the year of observation; the following total magnitudes for Carinae and the Homunculus were adopted: J 2.7; H 1.9; K 0.6. Comparison with the plot of J magnitude of Carinae from 1970 to 1999 in Davidson et al. (da99 (1999), Fig. 3) shows the J band estimate to be reliable. The zero points for the magnitude system were taken from Koornneef (koor (1983)). No correction was attempted for the slight saturation on the central point source which affected the J and H images. The Kc image was used to scale the saturated K band flux. No attempt was made to correct for line of sight extinction. The lower panel of Fig. 8 shows the resulting fluxes in the apertures. The scattered flux decreases with scattering angle as expected for Mie scattering. The H and K fluxes generally agree fairly well whilst the J band fluxes are higher; this would be consistent with the scattering angles actually being less for the J band consequent on the depth at which the predominant scattering is viewed being less on account of line of sight extinction.
| (m) | mag. | mag. |
|---|---|---|
| Observed | ISM ∗ | |
| 0.336 | 2.90 | 3.90 |
| 0.410 | 3.25 | 3.25 |
| 0.631 | 3.06 | 1.98 |
| 1.042 | 1.75 | 0.91 |
| 1.250 | 0.49 | 0.66 |
| 1.650 | 0.23 | 0.39 |
| 2.150 | 0.22 | 0.23 |
| 2.200 | 0.14 | 0.22 |
∗ Normalised to the observed value at 0.410m
One way to attempt to visualize the extinction is to examine the wavelength variation of scattered light emerging at a position where there is an extinction feature. A position such as the pronounced drop in surface brightness at 1.3′′ on the Morse et al. (morse (1998)) cut (Fig. 6) appears to be promising. The fractional depth of this feature was measured relative to the peaks by linearly interpolating between the values at 0.5 and 2.0′′. This is clearly dependent on the spatial resolution, especially when it comes to estimating the peaks which are much sharper than the extinction hole. The result is given in Table 2 expressed in magnitudes (i.e. Aλ from the WFPC2 and ADONIS measurements). For comparison the expected extinction for a Galactic law matched to A4100A is listed in column 3 (using the Seaton (seat (1979)) extinction law as parametrized by Howarth how83 (1983) and R=3.1). For the Morse et al. (morse (1998)) data, the F336W point appears anomalous; it may be that the peaks also suffer extinction so the measurement of the extinction to the globule is underestimated. Over the range 4100 - 10420Å the extinction towards the nebula drops but less sharply than for the Galactic extinction law. There is clearly a jump in values between the HST 1.042m and the ADONIS J band extinctions, probably on account of differing spatial resolution and PSF’s causing differing degrees of infilling. Treating the measurements from J to K separately in Table 2 shows that the extinction also drops less steeply than the Galactic extinction curve, strengthening the suggestion of a flatter extinction law in this region of the Homunculus. This somewhat greyer extinction favours particles larger than those typically found in the ISM, in agreement with the conclusions of Smith et al. (smigeh (1998)) and others on dust emission. Davidson et al. (da99 (1999)) also suggested grey extinction from a comparison of the modestly wavelength dependent brightening of Carinae and the Homunculus in the optical and near-IR.

There is a strong discrepancy between the predictions of the extinction and emission of grains in the Homunculus and their polarization properties. If the grains were typically 1-2m in the Homunculus, Mie theory for spherical particles predicts a maximum polarization at 1.65m of 38% for a scattering angle of 120∘ (assuming that the size distribution is flat from 1-2m and using the Draine (drain (1985)) optical constants for silicate grains). However the V band polarization from Mie theory is only 13% for such a size range of particles at the same scattering angle. Whilst Rayleigh scattering from very small 0.1m grains produces a similar polarization at all wavelengths, it produces only a small variation in scattered flux with scattering angle (by a factor 2). Thus Rayleigh scattering is not capable of matching the points as shown by the scattered intensity and polarization curves in Fig. 8 (see caption for details). It has not so far been possible to find a single size distribution which would explain the consistent polarization value over a wide wavelength range and the similar variation in scattered flux with scattering angle from J-K (see Fig. 8). To explain the consistency of the polarization, other suggestions involving a grain size distribution together with optical depth effects which ‘tune’ the scattering properties with wavelength must be invoked.
Three possibilities are suggested to explain the dust scattering
structure in the Homunculus:
a) the grains possess a range in size which is similar at all
positions within the nebula but the extinction of this grain
distribution at a given wavelength is such that the particles which
contribute most to the scattering have lowest extinction. In other
words when the extinction cross section is low, the scattering cross
section is high. From Mie theory this is not possible for a single
grain species but could occur for some grain mixture. The extinction
acts to fine tune the size range contributing to
scattering. It is assumed here that the scattering angle changes
rather little with wavelength (hence extinction). For the
polarization to stay constant with wavelength, there
would need to be a grain size distribution inside
small clumps. The unit optical depth scattering surface would then
be deeper at longer wavelengths on account of the lower extinction.
Grain-gas or grain-grain collisions in the high velocity clouds
could perhaps explain the size distribution which would affect the
surface regions more strongly;
b) the effective scattering angle alters with wavelength on account of
the differing extinction. To longer wavelengths the small dust globules
become more transparent, resulting in an increase in scattering angle and
a greater proportion of the scattered flux arises from towards the rearside
of the lobes. This could compensate the increase of polarization with
wavelength by providing less polarized flux. Whilst this could work for
the NW lobe it is not easily able to explain the polarization behaviour in
the SE lobe. Here the scattering angle increases with increasing penetration
(lower line-of-sight extinction) into the lobe and so the polarization should be
expected to increase with increasing wavelength. In this case the relevant
parameter is again the line of sight extinction but it affects the
scattering angle;
c) the grains are aligned by the macroscopic velocity field of the
Homunculus such that it is their alignment that controls the polarization
rather than the individual grains. A rather extreme alignment such as
strings of dust particles would be required so it would be the incident
radiation on a grain rather than its intrinsic scattering properties
which would have a greater effect. Given that there are highly collimated
ejecta observed outside the Homunculus (Weis & Duschl weis (1999) and
Morse et al. morse (1998)), and that such features appear to extend
inwards towards Carinae, the suggestion of an influence of
the macroscopic grain alignment on the scattered radiation may not be
completely ruled out.
Suggestion (c) finds support in the detection of 12.5m polarization by Aitken et al. (ait95 (1995)), who first showed that there is organized grain alignment in the Homunculus. The maximum values of 12.5m polarization were about 5% and the E-vectors are oriented mostly radially at the edges (Aitken et al. ait95 (1995), Fig. 2), although the pattern is complex. It is notable that the 12.5m polarization is largest in each lobe where the near-IR polarization is greatest - viz. at the ends of the lobes. This suggests an intrinsic connection between the grains at the two wavelengths, rather than the polarization arising in different grain groups at the different wavelengths. Aitken et al. (ait95 (1995)) discuss radiation streaming as a mechanism to provide suprathermal grain spin of paramagnetic grains which then precess about the magnetic field direction. Fields strengths upto milli-Gauss were suggested and the field orientation in the lobes orthogonal to the major axis was favoured (Aitken et al. ait95 (1995)). One possible scenario which could relate the presence of aligned grains and the constancy of optical - IR polarization with wavelength has the grains in the foreground lobes of the Homunculus acting as the aligning medium for the scattered light from the rearside. By comparison with the case of Galactic grain alignment, the amount of extinction to produce 30% polarization (V band) is EB-V 3.3 (see e.g. Whittet, whitt (1992), Fig. 4.2). This is a large extinction but not ruled out given the deduced extinction of a few magnitudes for the ‘dark’ regions of the Homunculus (see Table 2). In addition the grains in the Homunculus are probably very different from those in the general interstellar medium, having been recently ejected from a star with anomalous abundances. It is clear that grain alignment cannot be wholly responsible for the constancy of the polarization with wavelength but may be a contributor. Further observations to explore the polarization in the 3-5m region where there is a mixture of scattering and emission would be particularly valuable.
5 Conclusions
The first high spatial resolution adaptive optics near-IR polarization maps of Carinae and the Homunculus nebula have been presented. Since the Homunculus is dominated by scattering then the appearance in the near-IR is rather similar to that observed in the optical and a comparison of the AO results with an HST 1.04m WFPC2 image was presented showing essentially the same features. The most important single result from this work is the overall similarity of the linear polarization from the V band to 2.2m within a few percent for the SE lobe and the lower values at J and H compared with V for the NW lobe. Image restoration was applied to a set of 2.15m continuum images to determine the polarization distribution in the near vicinity of Carinae. A tentative value of the polarization of the Weigelt et al. speckle knot D of 18% was determined suggesting that it is a dust cloud within the equatorial disc strongly illuminated by Carinae. Various models are discussed in order to explain the flat distribution of polarization with wavelength over the Homunculus. A possible association of a narrow feature within the NW lobe of the Homunculus with one of the highly collimated emission line ‘whiskers’ outside the nebula deserves further investigation.
References
- (1) Ageorges N., Walsh J. R., 1999, A&AS 138, 163
- (2) Aitken D. K., Smith C. H., Moore T. J. T., Roche P. F., 1995, MNRAS 273, 359
- (3) Allen D. A., 1989, MNRAS, 241, 95
- (4) Altamore A., Maillard J.-P., Viotti R., 1994, A&A 292, 208
- (5) Bensammar S., Letourneur N., Perrier F., Friedjung M., Viotti R., 1985, A&A 146, L1
- (6) Beuzit J.-L., Demailly L., Gendron E., et al., 1997, Exp. Astr. 7, 285
- (7) Carty T. F., Warren-Smith R. F., Scarrott S. M., 1979, MNRAS 187, 761
- (8) Currie D. G., Dowling D. M., Shaya E. J., et al., 1996, AJ 112, 1115
- (9) Daminelli A., Conti P. S., Looes D. F., 1997, New A 2, 107
- (10) Davidson K., Humphreys R. M., 1997, ARA&A 35, 1
- (11) Davidson K., Dufour R. J., Walborn N. R., Gull T. R., 1986, ApJ 305, 867
- (12) Davidson K., Ebbets D. C., Weigelt G., et al., 1995, AJ 109, 1784
- (13) Davidson K., Ebbets D. C., Johansson S., et al., 1997, AJ 113, 335 ApJ 305, 867
- (14) Davidson K., Gull T. R., Humphreys R, M., et al., 1999, AJ 118, 1777
- (15) Devillard N., 1997, ESO Messenger 87, 19
- (16) Draine B. T., 1985, ApJS 57, 587
- (17) Ebbets, D. C., Garner, H., White, R. L., et al., 1994, in Proc. 34th Herstmonceux Conference ”Circumstellar Media in the Late Stages of Stellar Evolution”, eds. R. E. S. Clegg, Stevens, I. R., Meikle, W. P. S., CUP, p.95
- (18) Falcke H., Davidson K., Hofmann K.-H., Weigelt G., 1996, A&A 306, L17
- (19) Gehring, G., 1992, Unpublished Ph. D. Thesis, Ludwig-Maximilians Universität, Munich, Germany
- (20) Hofmann K.-H., Weigelt G., 1988, A&A 203, L21
- (21) Hofmann R., Brandl, B., Eckart, A., et al., 1995, Proc. SPIE 2475, 192
- (22) Howarth I. D., 1983, MNRAS 203, 301
- (23) Humphreys R. M., Davidson K., 1994, PASP 106, 1024
- (24) Hyland A. R., Robinson G., Mitchell R. M, Thomas J. A., Becklin, E. E., 1979, ApJ 233, 145
- (25) Jeffries S. M., Christou J. C., 1993, ApJ 415, 862
- (26) Koornneef J., 1983, A&A 128, 84
- (27) Lucy L. B., 1974, AJ 79, 745
- (28) Meaburn J., Walsh J. R., Wolstencroft R. D., 1993, A&A 268, 283
- (29) Mitchell R. M., Robinson G., 1978, ApJ 220, 841
- (30) Morse J. A., Davidson K., Bally J., et al., 1998, AJ 116, 2443
- (31) Rigaut F., Gehring G., 1995, Rev. Mex. A&A 2, 27
- (32) Robinson G., Mitchell R. M., Aitken D. K., Briggs G. P., Roche R. F., 1987, MNRAS 227, 535
- (33) Schulte-Ladbeck R., Pasquali A., Clampin M., et al., 1999, AJ 118, 1320
- (34) Seaton M. J., 1979, MNRAS 187, 75P
- (35) Smith C. H., Aitken D. K., Moore T. J. T., et al., 1995, MNRAS 273, 354
- (36) Smith N., Gehrz R. D., Krautter J., 1998, AJ 116, 1332
- (37) Thackeray A. D., 1956, Observatory 76, 154
- (38) Turnshek D. A., Bohlin R. C., Williamson R. L., Lupie O. L., Koornneef J., 1990, AJ 99, 1243
- (39) van Genderen A. M., De Groot M. J. H., Thé P. S., 1994, A&A 283, 89
- (40) Visvanathan N., 1967, MNRAS 135, 275
- (41) Walborn N. R., Liller M. H., 1977, ApJ 211, 181
- (42) Warren-Smith R. F., Scarrott S. M., Murdin P., Bingham R. G., 1979, MNRAS 189, 299
- (43) Weigelt G., Ebersberger J., 1986, A&A 163, L5
- (44) Weis K., Duschl W., 1999, A&A 349, 467
- (45) Wesselink G., 1960, Lowell Obs. Bull 105, 305
- (46) Westphal J. A., Neugebauer G., 1969, ApJ 156, L45
- (47) Whitelock P. A., Feast M. W., Carter B. S., Roberts G., Glass I. S., 1983, MNRAS 203, 385
- (48) Whitelock P. A., Feast M. W., Koen C., Roberts G., Carter B. S., 1994, MNRAS 270, 364
- (49) Whittet D. C. B., 1992, Dust in the Galactic Environment, Institute of Physics, Bristol