Photometry of Nova V 1493 Aql ††thanks: Based on data collected at the Osservatorio Astrofisico di Catania, stazione M. G. Fracastoro, Serra la Nave (Etna), Italia
Abstract
We report on photometric observations of V 1493 Aql during the early decline and highlight some uncommon aspects of the light curve . V 1493 Aql was hotter at maximum light than in the following phases, and was characterized by the presence of a long lasting secondary maximum, that, unlike in other novae, was quite red in color. The mean of three distance estimates yields d Kpc. Such a large distance would place V 1493 Aql at the extreme outskirts of our Galaxy or even in an external Local Group galaxy.
Key Words.:
08.14.2 novae, cataclysmic variables - 08.09.2 stars: individual: V 1493 Aql1 Introduction
V 1493 Aql (= Nova Aql 1999 n. 1) was discovered by Tago (1999) as an 8.8 mag object on two films taken on July 13.56 UT with a 55-mm f/3 camera lens. Nothing was visible on a film taken 4 days before. The precursor of the nova was too faint in quiescence to be recorded by the 1.2 m Palomar Schmidt, which sets the amplitude of the outburst in the mag range (Moro et al, 1999). Low-resolution spectra taken on July 14.6 UT by Ayani and Kawabata (1999) showed strong, broad Balmer lines with FWHM about 3400 . Similar values are reported by Tomov et al (1999) on July 15.9 UT who, in addition, remark the presence of FeII emission lines and the lack of absorption components in the Balmer emission lines. The decline of the nova was very fast and already on July 17.02 UT was fainter than 11.0, thus indicating a of the order of 3 days. On August 3.89 the nova was already at (Lehky, 1999). We took advantage of an observing run at the Catania Observatory to monitor the following stages in the decline of the nova. The object underwent a secondary outburst which began shortly before our observations. In this letter we report our and other photometric observations of V 1493 Aql and discuss the implication of these data in the context of the classical nova phenomenon.
2 Observations and data reduction
From August 5th 1999 to August 15th we observed V 1493 Aql with the 91 cm telescope of the Osservatorio Astrofisico di Catania at the M. G. Fracastoro mountain station on Mt. Etna, equipped with a single channel photometer with filters. Standard stars from the lists of Landolt (1983,1992) were observed each night for calibration purposes. The full data, as well as further details on the observations, are available in electronic form.
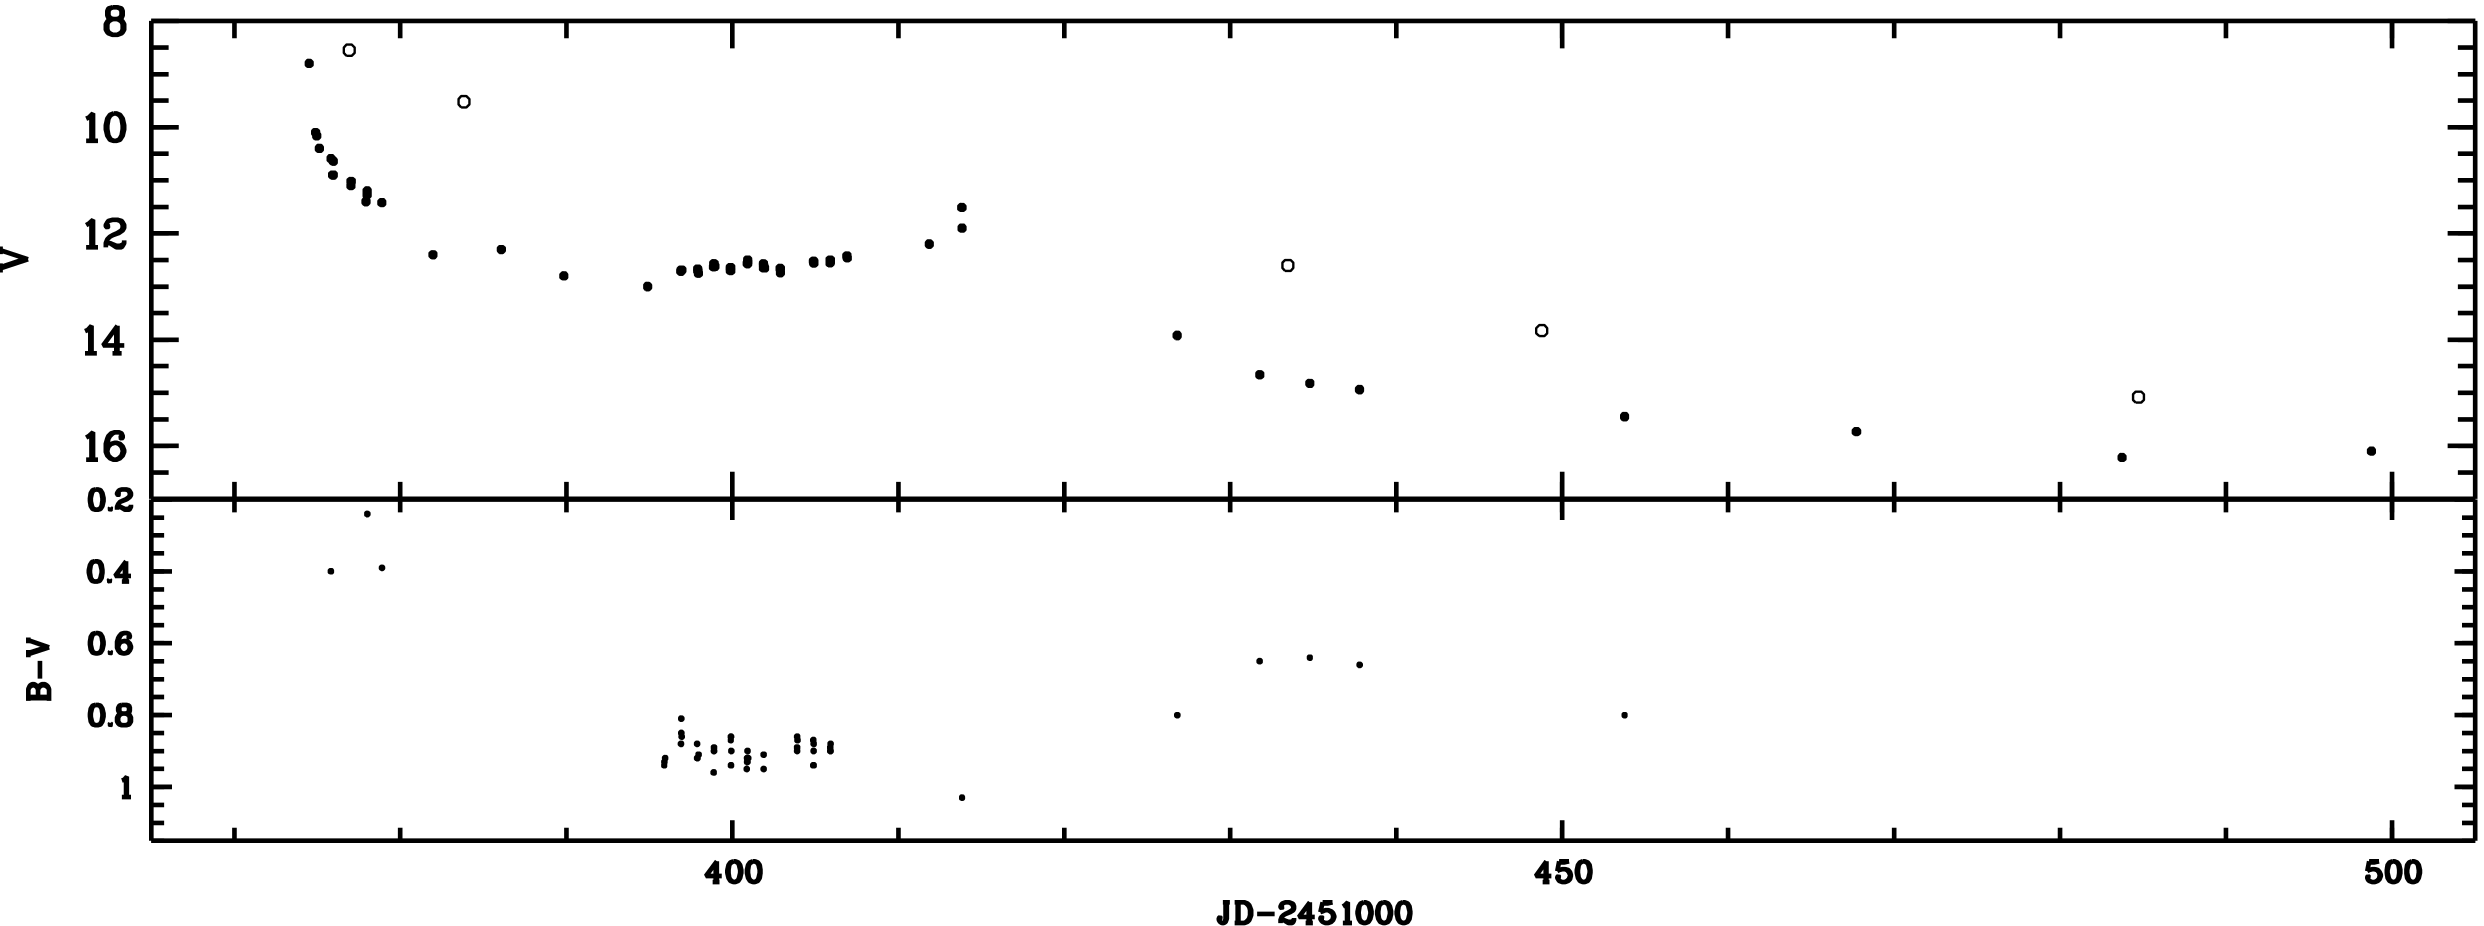
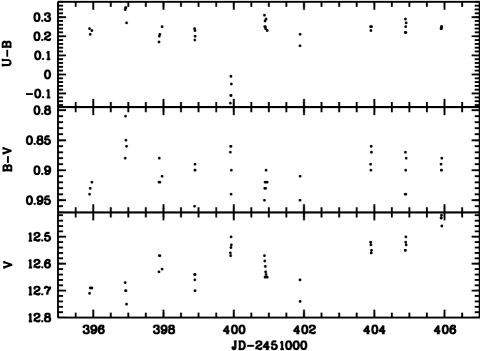
Each night we observed at least two among four stars which are angularly near to V 1493 Aql (GSC 01048-0098, GSC 01048-01359, HD 230704, HD 178263) for comparison. Unfortunately all the four stars showed variations in our photometry which were above the expected measurement errors. The Tycho Catalogue (Perryman et al 1997) reports a photometric variability for all of them. We made no use of the differential photometry, although all the data is available electronically. Figure 1 shows photometric data from the present work and from the IAU circulars, while Figure 2 shows the Serra La Nave data in more detail. In the time span by our observations V 1493 Aql showed a brightening of about 0.4 mag. Fluctuations from night to night and even within the night were larger than the estimated errors. We searched for a periodicity in the photometric data and may safely exclude the presence of periodicities of 5 days, or shorter. The periodograms relative to , and are very similar.
3 The photometric behavior during decline
It is well known that each nova has its own individuality and that no two novae are completely alike in their photometric behavior (Payne–Gaposhkin 1957; Mc Laughlin 1960; Duerbeck 1981; Van den Bergh and Younger 1987). Light curves tend to differ from each other immediately after the first phase of near exponential decay from maximum light showing either regular or irregular variations with oscillations, rapid decline (absorption) followed by recovery, re-brightening, and in many cases even a continuous nearly exponential smooth decline. See also Bianchini and Friedjung (1992) for an interpretation of the oscillatory behaviour.
The light curve of V 1493 Aql is characterized, after the first rapid decline to , by some evidence of the onset of small amplitude oscillations with the presence of two local minima at (JD 381.904, Reszelski 1999) and at (JD 394.89 Lehky, 1999). Then a conspicuous re-brightening, with some indication of a secondary oscillation takes place, almost in coincidence with our observations. The secondary maximum reaches on JD (Hanzl, 1999). AAVSO data confirm the general trend near the secondary maximum, but do not show any clear evidence of oscillations in the previous phase. It is possible that the rather large scatter in these data has masked oscillations of small amplitude. If we consider the whole light curve, the brightening looks like a secondary outburst with an increase in mag with respect to the local minimum of . From another perspective the secondary maximum at falls about 2.5 mag above the curve which corresponds to a smooth decline. The total duration of the secondary outburst is of the order of 40 days.
We have examined several light curves of novae in outburst, looking for similarities with V 1493 Aql and found only a marginal evidence for a similar behaviour. While the presence of more or less coherent oscillations is a characteristic shared by about 15 % of novae (with V 603 Aql and GK Per as prototypes), the long lasting re-brightening “profile” of V 1493 Aql is quite rare, if not unique. To the best of our knowledge, only a few objects bear some resemblance to V 1493 Aql: 1) N Dor 1971a (Van den Bergh & Younger 1987), but the brightening was of much shorter duration and smaller range in magnitude, and much longer; 2) N Cep 1971 (ibidem) , similar to N Dor 1971 but with some evidence of an another small amplitude brightening; 3) N Her 1963 = V533 Her, the same, with additional small amplitude brightenings; 4) DK Lac (very long ) presented many brightening peaks of very short duration at semiregular time intervals; 5) the recurrent nova T CrB showed a secondary maximum that took place about 100 days after the principal eruption.
Also the observations, despite their coverage of the time interval of the nova decline being only partial, indicate a peculiar behaviour. Other novae generally become bluer as they evolve : smoothly decreases indicating that the shrinking in radius of the emitting “photosphere” is accompanied by a gradual increase in temperature. This is generally interpreted as a gradual decrease in the opacity, due to a decrease in density, and the gradual uncovering of the hotter internal layers in the burning shell. Instead, V 1493 Aql is hotter at maximum light ( ) than in the following phases: near the secondary maximum and in the following decline. This clearly indicates that the secondary maximum corresponds to a relative increase of the size of the “photosphere” and a decrease in temperature. Only five points, quite well spaced from the beginning of the outburst up to late stages, are available for the R band (Fig. 2), although, none is near the secondary maximum. Remarkably, they define a curve which has a similar slope as the curve. Actually, at a more accurate inspection (V-R) shows a decrease with time, a behavior that contrasts with that generally observed in other novae, e.g. Nova Vul 1984 ( Robb and Scarfe , 1995), where steadily increases with the progress of the outburst.
4 Absolute magnitude, reddening and distance
Nova distances can be derived from a comparison between their intrinsic and observed luminosities and therefore require that the latter are corrected for the effect of interstellar extinction. Van den Bergh and Younger (1987) from an exhaustive study of novae at maximum, found that after correction for reddening, the intrinsic color of novae two magnitudes below maximum, i.e. at time , is , with an rms of 0.12. Comparison with the measured allows to estimate . For V 1493 Aql we have two points near with and respectively. If we assume at we obtain i.e. , assuming . Tomov et al. (1999) noted the presence of strong NaI D interstellar lines indicative of a large reddening and consistent with the above value.
At such low galactic latitudes () the use of the dust maps of Schlegel et al (1998), to estimate reddening is limited because for the contaminating sources have not been removed from the maps, so that they provide at best an upper limit to the the reddening. The value derived for V 1493 Aql is , which appears completely inconsistent with the observed colors.. We shall therefore adopt and .
We use three methods to estimate the absolute magnitude of the nova in outburst:
-
1.
the empirical relation between absolute magnitude at maximum and rate of decline (MMRD, Zwicky 1936; Della Valle & Livio 1995). Taking , ( which is likely to be an upper limit) from the MMRD relation of Della Valle & Livio (1995), we obtain . We point out that at very short , as in our case, the relation is rather flat and produces changes on less than 0.1 mag. The observed maximum was at but we allow for a slightly brighter at maximum ( ), since it seems reasonable that the real maximum has been missed. Adopting it is straightforward to obtain Kpc.
-
2.
The absolute magnitude 15 days after maximum light appears to be independent of the speed class (Buscombe & de Vaucoleurs 1955) and is a good standard candle. As absolute magnitude at day 15 we take as the average value of various estimates reported in Warner (1995, p.266). At day 15 we have implying Kpc. We point out that day 15 lies inside the secondary maximum. Had we used the value corresponding with the smooth (unperturbed) decline then Kpc.
-
3.
Another estimate of the nova distance can be obtained on the basis of the “theoretical” assumption that the nova luminosity at maximum is close to or exceeds the Eddington luminosity () for a 1 object. In this framework fast novae should reach the highest peaks, up to (Warner 1995). If we take as a representative value for V 1493 Aql, we obtain M. Near maximum light novae radiate mostly in the optical and the bolometric correction BC is quite small and close to . If we take together with and we obtain Kpc.
It is disturbing that the absolute visual magnitude obtained with the MMRD method () is smaller than the absolute bolometric magnitude obtained in the assumption . We recall however that the intrinsic dispersion in the MMRD curve of Della Valle and Livio (1995) is of the order of magnitudes. The two estimates can be reconciled if a bolometric luminosity close to 10 is assumed (this gives , if ). We recall that Duerbeck (1981) indicated that very fast novae should radiate at this high rate . Also Livio (1992), on the basis of numerical calculations, suggested . Since a rather massive white dwarf ( ) is theoretically required to produce a very fast nova such as V 1493 Aql, then also Livio’s relation points to . By these arguments the distance Kpc obtained with method 3. should be considered as a lower limit and the unweighted average, Kpc of the three different estimates is rather conservative.
We have tried to estimate the total amount of the “excess” energy associated with the secondary outburst by measuring the area of the region delimited by the observed luminosity curve and the curve corresponding to a smooth, near exponential decline. The total time interval of the secondary brightening is 40 days and the extra energy contained in the bump associated with the secondary outburst is of the order of erg . We point out, however, that this value may be affected by a non negligible error because of the uncertainty in the estimate of the curve corresponding to the “smooth” decline.
5 Discussion
The very fast character of the light curve of V 1493 Aql associated with the conspicuous re-brightening (peak increase in mag with respect to the smoothed V curve and total duration of about 40 days) is not common in novae. This, together with the fact that V 1493 Aql is hotter at maximum light () than in the following phases: near the secondary maximum and in the following decline) makes V 1493 Aql quite peculiar among novae. We considered the possibility that the rapid reddening of V 1493 Aql in the early phases might be due to the formation of dust, however we regard this unlikely because dust formation is associated with the presence of a “deep minimum” in the light curve, which is not observed. Moreover dust is generally found in slow novae.
The large distance we have derived requires a comment. Clearly would be significantly reduced if the apparent magnitude at maximum were much brighter than 8.8. If the distance would be reduced to a more comfortable 6.2 Kpc. However, we consider it very unlikely that a object might have escaped the attention of vigilant sky-watchers during a few days. The lack of detection on films taken on 9.9 July UT (Tago 1999), implies that even if the nova managed to escape the attention of the astronomers, it had to decline by mag in an extremely short time. Considering that the observed decline already suggests a less than 3 days, this would imply a decay by about 5 magnitudes in less than 6 days, thus making of V 1493 Aql the fastest known nova. The photometric and spectroscopic behaviour of V 1493 Aql is that of a nova; the presence of an emission line spectrum near the maximum of the outburst (Ayani & Kawabata 1999; Tomov et al 1999; Lynch et al 1999) is generally associated with the very fast character in the light curve. We are therefore reluctant to accept that this is a unique object which does not obey the empirical MMRD-like relations found for other members of its class.
The three distance estimates are compatible, within 1.7 . Although the distances estimated from the magnitude at maximum are uncertain, to the extent that the “true” maximum may have been missed, the fact that assuming we obtain distances which are compatible with the estimate from at day 15, suggests that the maximum may not have been missed by more than a few tenths of magnitude.
A distance of Kpc places V 1493 Aql at over 14 Kpc from the Galactic centre, thus the star is at the outskirts of our own galaxy. If however the distance is 25.5 Kpc, as derived from the magnitude at day 15, then the distance from the Galactic centre is about 20 Kpc and thus the nova is outside the Galaxy. In this case it would fall in a Local Group galaxy, which could be called the Aquila galaxy. That a Local Group galaxy at such low Galactic latitudes could have gone undetected is not implausible, so the fact that no Local Group galaxy is known in that direction does not allow to rule out this possibility. The existence of the Aquila galaxy may be disproved by number counts and/or radial velocity surveys.
Acknowledgements.
We are grateful to G. Carbonaro, A. Di Stefano and M. Puleo for the assistance during the observations. We wish to thank G. Masi for kindly providing an unpublished measure. We acknowledge with thanks use of the data from the AAVSO International Database .References
- (1) Ayani K., Kawabata, T., 1999, IAUC 7223
- (2) Bianchini, A., Friedjung M., 1992, A&A., 257, 599
- (3) Bouma R.J., 1999, IAUC 7225, 7232
- (4) Buscombe, W, De Vaucouleurs, G., 1955, Obs., 75, 170
- (5) Della Valle M., Livio, M. 1995, ApJ 452, 704
- (6) Duerbeck, H.W., 1981, Pub. A.S.P. 93, 165
- (7) Hanzl D., 1999 IAUC 7228, 7254, 7273, 7313
- (8) Hajek P., 1999 IAUC 7228
- (9) Hornoch, K., 1999, IAUC 7225, 7232
- (10) Landolt, A. U., 1983, AJ 88, 439
- (11) Landolt, A. U., 1992, AJ 104, 340
- (12) Lehky M., 1999, IAUC 7232
- (13) Livio M., 1992, ApJ 393, 516
- (14) Lynch D.K., Rudy R.J., Mazuk S., Puetter R.C., 1999 IAUC 7258
- (15) Masi G., 1999, IAUC 7228, 7313 and private communication
- (16) Mc Laughlin, D. B., 1960, in ”Stellar Atmospheres” , Chicago Univ. Press.
- (17) Moro D.,Munari U., Tomov T., Henden A., 1999 IBVS 4785
- (18) Payne-Gaposchkin C., 1957 in ”The Galactic Novae” North-Holland Publ. Company, Amsterdam
- (19) Pereira A., 1999, IAUC 7225
- (20) Perryman M.A.C. et al, 1997, ESA-SP-1200,
- (21) Reszelski M., 1999, IAUC 7232
- (22) Robb, R.M., Scarfe , C.D., MNRAS 273, 347
- (23) Safar J., 1999, IAUC 7228
- (24) Schlegel D.J., Finkbeiner D.P., Davis M., 1998, ApJ, 500, 525
- (25) Schmeer P., 1999 IAUC 7232
- (26) Souza W.C.,1999, IAUC 7225
- (27) Tago A., 1999 IAUC 7223
- (28) Tomov T., Moro, D., Munari U., 1999 IAUC 7225
- (29) Van den Bergh, S., Younger, P.F., 1987, A& AS, 70, 125
- (30) Warner B., 1995 in ”Cataclysmic Variable Stars” , Cambridge University Press, Cambridge UK, p. 266
- (31) Yoshida S. & Kadota K., 1999, IAUC 7273
- (32) Zejda M.,1999 IAUC 7228, 7313
- (33) Zwicky, F., 1936, PASP, 48, 191