The extinction curve of the lensing galaxy of B1152+199 at ††thanks: Nordic Optical Telescope is operated on the island of La Palma jointly by Denmark, Finland, Iceland, Norway, and Sweden, in the Spanish Observatorio del Roque de los Muchachos of the Instituto de Astrofisica de Canarias.
W
Key Words.:
quasars: individual: B1152+199 – galaxies: ISM – ISM: dust, extinction – ISM: evolution – gravitational lensinge present photometry of the gravitational lens candidate CLASS B1152+119 obtained with the Nordic Optical Telescope. The two QSO components are resolved in the , , , and bands confirming the lensing nature of the system. The lens galaxy is clearly detected in , , and and its position is found to be almost coincident with the faint QSO image which is heavily extincted (relative to the brighter QSO image) by dust in the lens galaxy. The extinction curve of the lens galaxy derived from the relative photometry is well fitted by a Galactic extinction law with and . From a simple model of the system we predict a time delay of 60 days.
1 Introduction
Dust is ubiquitous in the Universe and is responsible for extinction of the light from distant sources. The type of dust (composition, grain sizes and shape) determines the amount of extinction as a function of wavelength – the extinction curve . Extinction curves almost certainly evolve with redshift since the metallicity, elemental abundance ratios, mean star-formation rate, and energy-injection rates that determine the structure and evolution of the dust are all strong functions of redshift. The extinction in our Galaxy has been well studied (Cardelli et al. 1989), but very little is known about extinction in other galaxies, especially at higher redshifts. This is unfortunate as dust plays an increasingly important role in contemporary cosmology.
Recently the use of multiply imaged QSOs has been explored as a means of inferring differential extinction curves for distant galaxies (Nadeau et al. nadeau (1991); Malhotra et al. malhotra (1997); Falco et al. Falco (1999)). The idea behind this approach is that a lensed QSO can be used as a ‘standard beacon’, shining through different paths of the lensing galaxy. If one of the images suffers negligible extinction, or if the extinction curve is the same throughout the galaxy, then the relative intensity ratios of any two images as a function of wavelength is a direct measure of the extinction curve.
As a part of the CLASS radio survey, Myers et al. (Myers (1999)) reported the discovery of a new gravitational lens candidate, CLASS B1152+199, with an image separation of and a flux ratio of at 8.46 GHz. Spectra obtained with the Keck II telescope revealed a background quasar at and a foreground galaxy at . Optical follow-up observations revealed a bright unresolved object ( and ) located at the radio position, presumably the brighter of the two lensed images. The non-detection of the weak image in and is indicative of a large color difference between the two images. If B1152+199 is indeed a gravitationally lensed system this could be attributed to differential extinction caused by dust in the lens, making B1152+199 a well-suited system for studying the extinction law of the lensing galaxy.
2 Observations and reduction
We have performed multiwavelength photometry on data of B1152+199 obtained with the ALFOSC instrument at the 2.56-m Nordic Optical Telescope (NOT). The ALFOSC instrument is equipped with a Loral/Lesser CCD with an approximate gain of and and a pixel scale of . The observations were performed within the span of a few days to avoid time delay and variability effects. The observing log is given in Table 1. The conditions were photometric with average seeing ranging from in the band to in the band. The CCD frames were reduced (overscan subtracted, trimmed and flatfielded) using an IRAF-based pipeline.111developed by Andreas O. Jaunsen
On June 25 1999 UT, we also obtained photometric observations of standard stars in M92. Using these and calibrated photometry by Davis (private communication) we fitted the transformation equations to 19 stars in M92 to derive the color, extinction and zero-point terms for the calibration to the Johnson–Kron–Cousins system.
| Date | ||||||
|---|---|---|---|---|---|---|
| UT | sec | sec | sec | sec | sec | sec |
| June 23 1999 | 600 | 600 | ||||
| June 25 1999 | 2700 | 1100 | 400 | 900 | ||
| July 02 1999 | 400 | 600 |
3 Deconvolution of B1152+199
The two QSO images together with the lens galaxy were deconvolved with the MCS deconvolution algorithm (Magain et al. Magain (1998)). This method is based on the principle that the resolution of a deconvolved image must be compatible with its sampling, which is limited by the Nyquist frequency. In order to improve the sampling of the images we adopted a pixel size in the deconvolved images as half the pixel size of the original frames (). (See Burud et al. burud (1998) for more details on the implementation of the MCS algorithm).
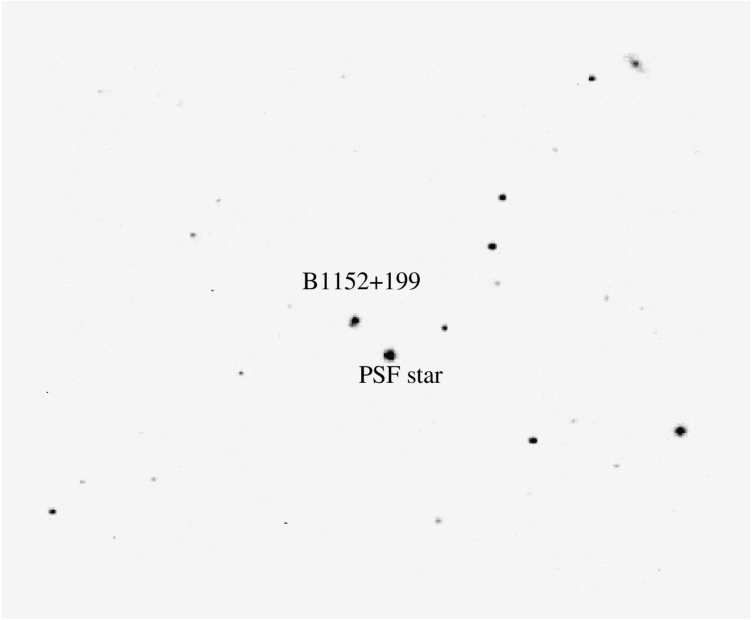
In order to successfully deconvolve the images, the point-spread function (PSF) must be bright and located close to B1152+199 to minimize the photon noise and to avoid PSF variation as a function of the position on the chip. We used the bright star 13 South West of B1152+199 as a PSF star (Fig. 1).
Careful examination revealed that this star had a faint red companion. By deconvolving this star with another PSF in the field we were able to resolve the red companion star and subtract it, before using the bright star as a model for the PSF. We compared the star to other stars in the field to check that the companion star was correctly subtracted. The best fitting positions of the weak QSO image relative to the strong QSO image returned from the MCS algorithm is given in Table 2. These yield a smaller separation that expected from the radio positions (Myers et al. Myers (1999)). The deconvolution code is very sensitive to PSF variations, and small residuals from the subtraction of the red companion could explain the discrepancies between the fitted positions and the radio position of the weak QSO image.
In order to improve the photometry we fixed the position of the weak QSO image relative to the bright QSO image to the radio coordinates. The quality of the results was checked from the residual maps, as explained by Courbin et al. (Courbin (1998)). During the deconvolution the lens galaxy can be modeled numerically or by an analytical function (e.g., de Vaucouleurs, exponential-disk law). The lens galaxy in B1152+199 was well fitted by the numerical model and an exponential disk law, whereas a de Vaucouleurs model gave significantly bad residuals. The best fitting exponential disk law was centered at relative to the bright QSO image.
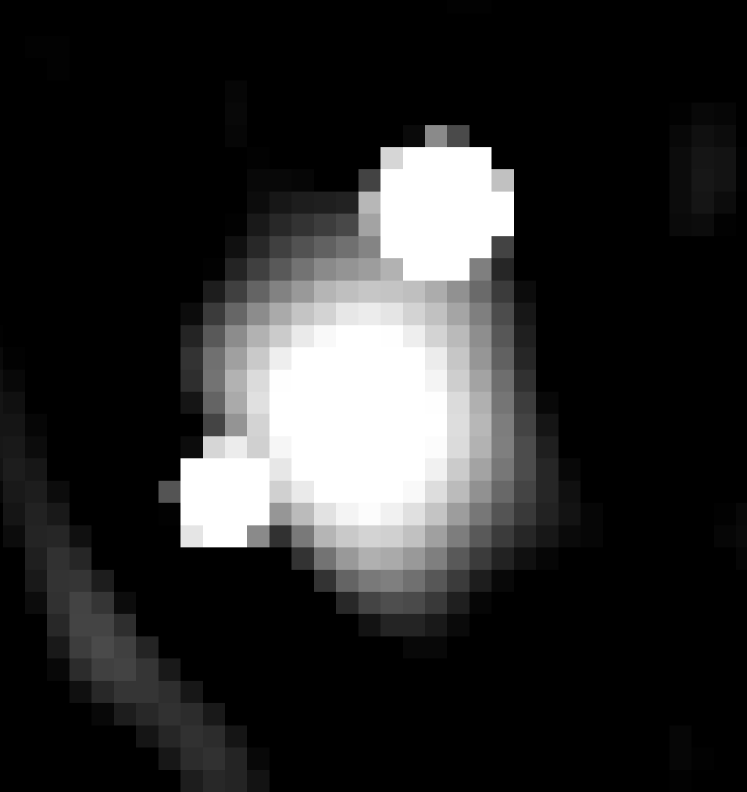
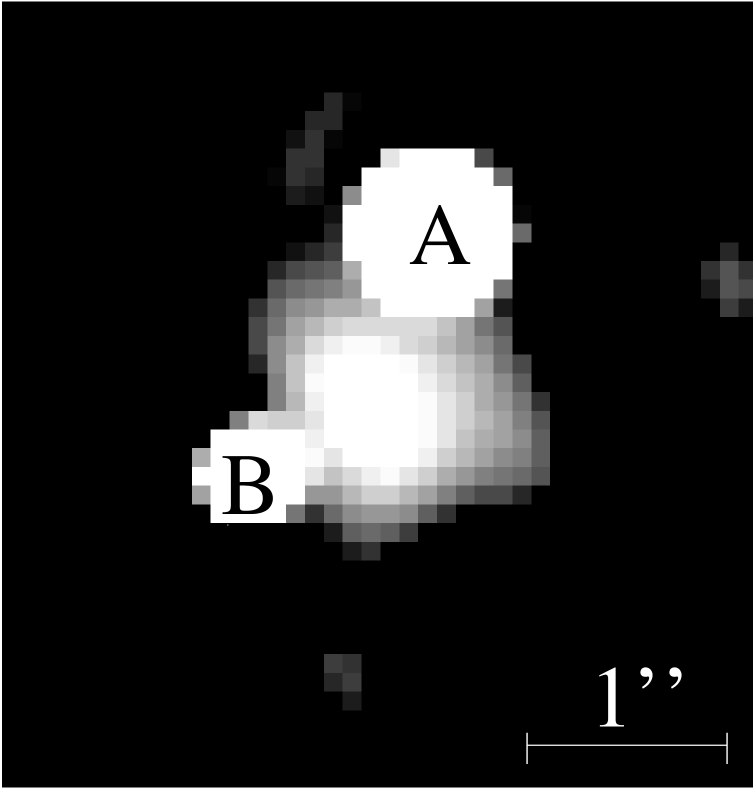
Both components of B1152+199 were resolved in the , , and bands (Fig. 2). Following Myers et al. (Myers (1999)) we will refer to the bright component as “A” and the weak component as “B”. In the and bands we failed to detect the B image due to the increasing size of the seeing disc with shorter wavelength and the large differential extinction of the system (see Sect. 5). The lens galaxy was detected in the , and bands. We performed aperture photometry of the galaxy on the deconvolved images with an aperture diameter of . The , , , and band magnitudes of the A and B images and the galaxy (G) were calibrated (Table 3) whereas no standard photometry was available in the band.
Additional extended signal was observed just South East of the B image (notably in the band). We discuss this further in Sect. 4.
4 PSF photometry of B1152+199
In addition to the deconvolution we performed PSF photometry on the system with the IRAF DAOPHOT package (Stetson stetson (1987)). As PSF star we used the same star as in the deconvolution, with the faint red companion removed with the IRAF task substar. Again we fixed the position of the B image relative to the A image on the the radio position to ensure the correct separation. The results from this analysis is not as robust as the results from the deconvolution since it does not simultaneously fit a model for the galaxy, but the differences between the results of the two approaches is indicative of the magnitude of the systematic photometric uncertainties.
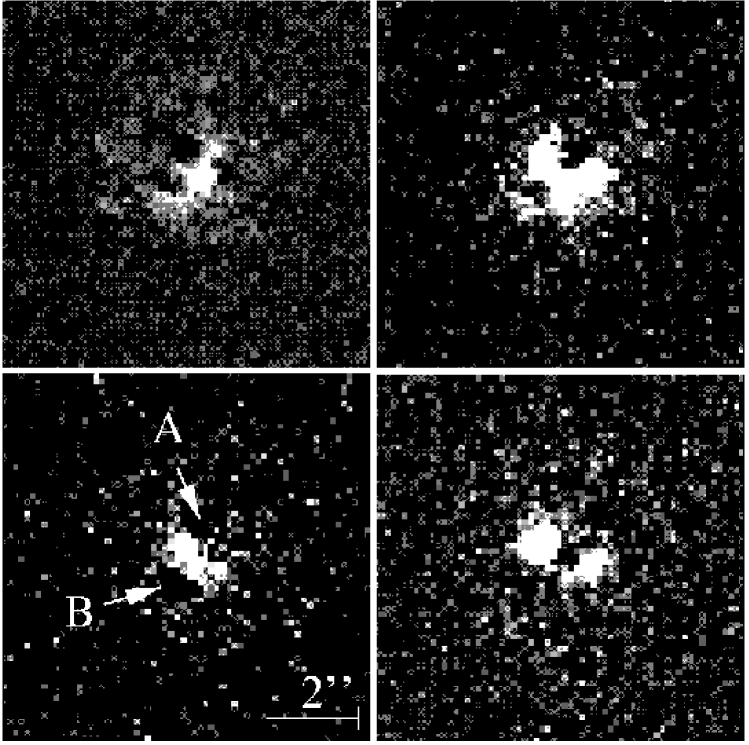
The two QSO images were resolved in the , , , and bands. The results from the PSF photometry is given in Table 2. After subtracting the scaled PSFs we detected the lensing galaxy in the , , and band residual images (Fig. 3). The and band images indicates that the extended flux South East of the B image, detected in the deconvolved images, stems from the lensing galaxy. The light from the B component passes through the galaxy close to its center, and in the deconvolution process some of the light from the galaxy may have been attributed to the B image.
To test the results from the deconvolution we performed aperture photometry with the SExtracter software (Bertin & Arnouts bertin (1996)) on the images cleaned with DAOPHOT. The residual images in Fig. 3 show artifacts of the PSF subtraction (seen as circular dark spots). These affect the aperture photometry which should therefore be considered rather uncertain. In the and bands we obtain and with an aperture diameter of . In the band the signal is rather weak, and thus in the outer parts dominated by the PSF subtraction artifacts. We can however obtain a color by comparing the and flux within an aperture of . This yields . The color of the galaxy from the deconvolution or from PSF photometry are consistent with the lensing galaxy being a irregular or late type galaxy at (Fukugita et al. fukugita (1995)). By comparing the photometric results from the two approaches we estimate the magnitude of the systematic photometric errors due to the limited quality of the data to be in the order of 0.4 mag for galaxy magnitudes and 0.2 mag for the QSO magnitudes.

| Filter | (BA)MCS | (BA)PSF | ||
|---|---|---|---|---|
| mag | mag | |||
| 5.84 0.51 | ||||
| 4.42 0.02 | 0.88 | 4.44 0.12 | ||
| 3.87 0.06 | 0.78 | 3.67 0.06 | ||
| 2.98 0.01 | 0.86 | 2.69 0.03 | ||
| 2.61 0.04 | 0.94 | 2.29 0.04 |
| FWHM | A | B | G | |
|---|---|---|---|---|
| 16.75 | ||||
| 17.00 | ||||
| 17.28 | ||||
| 16.42 | ||||
| 16.38 | ||||
5 Galaxy extinction
Significant differential extinction of the B image relative to the A image was observed (Tables 2 and 3). The A image, however, does not appear to be significantly reddened. In what follows we assume that the A image is unaffected by extinction by dust in the lensing galaxy. The Galactic extinction curve is fairly well known, with well parameterized as a function of a single parameter, , defined as the ratio between the extinction, , and the color index (Cardelli et al. Cardelli (1989); Fitzpatrick fitz (1999)). This parameterization is valid over the observed values ranging from to , with a mean (canonical) Galactic value of . Large give flat UV extinction curves due to large grains whereas small and small grains lead to large UV extinctions.
The variation of the flux ratio with wavelength directly measures the extinction curve of the galaxy. We have assumed that the intrinsic flux ratio is given by the radio flux ratio (BA=1.21).
The extinction curve of B1152+199 was well fitted by a Galactic extinction law, using either the flux ratios from the deconvolution or from the PSF photometry. However the best fitting values of the parameters and differ somewhat. We first discuss the fit to the deconvolution data. In the deconvolved and band images the galaxy and the B image were too weak to be separated. We can however obtain upper limits on the B image flux by using the total flux of the galaxy and the B image. These are and . The best fitting restframe values of the parameters to the deconvolution flux ratios are and (Fig. 4, solid curve). The predicted magnitude of the B image from the observed A image magnitude and are and . Furthermore the inferred agree well with the band magnitude of the galaxy inferred from the PSF photometry (Sect. 4). It is therefore likely that the upper limits presented above are dominated by the galaxy flux rather than flux from the B image.
The PSF photometry detected the B component in the band which gives us another point on the extinction curve. The best fitting restframe values of the parameters to the PSF photometry flux ratios are and (Fig. 4, dashed curve). The extinction curves inferred from the two approaches are comparable. As discussed in Sect. 4 the systematic uncertainties in the photometry is of the order 0.2 magnitudes. This uncertainty is illustrated by the different slopes of the extinction curves derived from the two approaches. We conclude that the extinction curve of the lensing galaxy of B1152+199 is fitted by the Galactic extinction law and put the following constrains on the parameters: and .
If the reddening is due to dust extinction in the lens galaxy we can derive the column density of neutral hydrogen from the observed by assuming a gas to dust ratio for the galaxy. For the Milky Way cm -2 mag-1, (Diplas & Savage Diplas (1994)) while the value for Damped Lyman Absorbers (DLAs) may be up to 20 times larger (Fall & Pei Fall (1993)). With the inferred for the lens galaxy: cm -2, where is the parameterization of the range in the observed in different systems. Thus, the lensing galaxy of B1152+199 would qualify as a DLA (N(H I) cm -2) regardless of the value of .

| e | P.A. | delay | |||||
| ″ | ″ | 1b/a | deg | kpc | kpc | km/s | days |
| 0.56 | 0.21 | 21 | 0.02 | 5.42 | 253 | 59 |
6 A simple model of B1152+199
A simple model with a dark halo, represented by
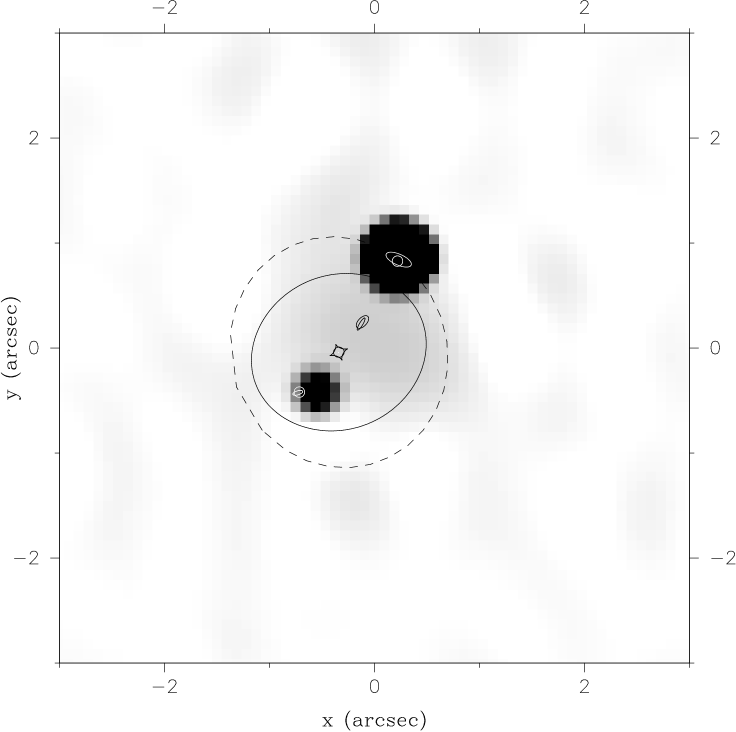
as the dominating mass was fitted to the data (Kneib et al. kneib (1996)). Although the observational constraints available from our data were too poor to perform detailed modeling, a set of best-fitting parameters could be derived for the system (see Table 4). We used the radio positions and flux ratios for the two QSO components while we experimented with different positions for the lens galaxy. We found that the two-image configuration could not be reproduced with the galaxy in the position found from the deconvolved images. An improved fit was obtained by placing the galaxy closer to the B component. The position was chosen to be consistent with what is found in the PSF-subtracted images. This position means that the B component passes through the galaxy while the A component passes outside the galaxy, which is consistent with the large observed differential extinction. The model predicts a time delay of 59 days. In Fig. 5 we show the critical and caustic curves of the lens model overlaid the deconvolved image.
7 Discussion
Extinction curves have been derived for the Galaxy and the Magellanic Clouds, mainly through multi-color photometry of individual stars, for which the intrinsic luminosities is known from their spectral types (Cardelli et al. Cardelli (1989)). The extinction curves of the LMC and SMC can be fitted by the Galactic extinction law (see Mathis mathis (1990); Fitzpatrick fitz (1999)). The main difference is the 2175 Å bump (cf. Fig. 4) which is not observed in the LMC and SMC. At distances 10 Mpc study of individual stars is difficult and other methods must be considered. In this paper we have shown that accurate extinction curves of high- galaxies can be determined by studying gravitationally lensed systems. We have found that the extinction curve of B1152+199 is well fitted by the Galactic extinction law. It is interesting to note that the inferred in principle is outside the validity of the parameterization of Galactic extinction curve by Cardelli et al. (Cardelli (1989)). Note also that the differential extinction of B1152+199 , is one of the largest observed to date (Falco et al. Falco (1999)).
The evidence for a Galactic extinction curve is intriguing, but and band observations with longer exposure times and better seeing are needed to rule out other extinction curves. These will sample the restframe UV radiation which is highly sensitive to dust extinction, and thus strongly constrain the shape of the extinction curve, and allow for the possible detection of the 2175 Å bump.
The predicted time delay of 59 days makes B1152+199 an interesting candidate for monitoring.
Acknowledgements.
We thank Andreas O. Jaunsen for providing the pipeline for the reduction, Jean-Paul Kneib for providing his Lens Tool software for modeling the system, and Lars Freyhammer for performing the observations. We thank Kirsten K. Knudsen and Anja C. Andersen for valuable discussions. IB is supported in part by contract ARC94/99-178 “Action de Recherche Concertée de la Communauté Française (Belgium)” and Pôle d’Attraction Interuniversitaire, P4/05 (SSTC, Belgium). The data presented here have been taken using ALFOSC, which is owned by the Instituto de Astrofisica de Andalucia (IAA) and operated at the Nordic Optical Telescope under agreement between IAA and the Astronomical Observatory of Copenhagen. This work was supported by the Danish Natural Science Research Council (SNF).References
- (1) Bertin E., Arnouts S., 1996, A&AS 117, 393
- (2) Burud I., Stabell R., Magain P. et al., 1998, A&A 339, 701
- (3) Cardelli J.A., Clayton G.C., Mathis J.S., 1989, ApJ 345, 245
- (4) Courbin F., Lidman C., Magain P., 1998, A&A 330, 57
- (5) Diplas A., Savage B.D., 1994, ApJ 427, 274
- (6) Falco E., Impey C.D., Kochanek C.S. et al., 1999, ApJ 523, 617
- (7) Fall S.M., Pei, Y.C. 1993, ApJ 402, 479
- (8) Fitzpatrick E.L., 1999, PASP 111, 63
- (9) Fukugita M., Shimasaku K., Ichikawa T., 1995, PASP 107, 945
- (10) Kneib J.-P., Ellis R.S., Smail I. et al., 1996 ApJ 471, 643
- (11) Magain P., Courbin F., Sohy S., 1998, ApJ 494, 452
- (12) Malhotra S., Rhoads J.E, Turner E.L., 1997, MNRAS 288, 138
- (13) Mathis J.S., 1990, ARA&A 28, 37
- (14) Myers S.T., Rusin D., Fassnacht C. D. et al., 1999, AJ 117, 2565
- (15) Nadeau D., Yee H. K. C., Forrest W. J. et al., 1991, ApJ 376, 430
- (16) Stetson P.B., 1987, PASP 99, 191