SUPERNOVAE
The properties of supernovae (SNe) are reviewed. It is shown that the observed characteristics of the morphological classes of SNe (types Ia, Ib/c, II) can be explained in terms of two basic explosion mechanisms, i.e. core collapse of massive stars and thermonuclear explosion of low/moderate mass stars. The study of SNe can provide valuable insight in the late phases of the evolution of their progenitors and, therefore, can constrain the theory of stellar evolution quite tightly. Also, bright SNe of type Ia can be used to probe the Universe up to high redshifts, allowing us to measure cosmological constants and to gain valuable information on the formation and evolution of galaxies. The case of SN 1987A is discussed in some detail: it appears that in this event a number of predictions were astonishingly well verified but still many aspects were completely at variance with “common wisdom” expectations, indicating that the SN phenomenon is still not fully understood.
1 Introduction
As their name indicates, supernovae (SNe) are discovered in the sky as “new stars” (-novae) of exceptionally high brightness (super-). The fact that SNe are formidable explosions completely different from, and vastly more energetic than classical novae aaaNovae are produced by sudden nuclear ignition of a very thin layer of hydrogen near the surface of a degenerate star accreting matter from a binary companion., was first recognized by Baade and Zwicky (1934). They noticed that novae during explosion become no brighter than about 1 million times (i.e. 15 mag) they are in a quiescent phase. Therefore, any historical event in our Galaxy that had reached a magnitude as bright as 0 or brighter but is not detectable at present, had to belong to a separate class of intrinsically brighter objects. And indeed, the distribution of observed magnitudes of explosive events detected in galaxies of the Local Group indicated the presence of two peaks, one at the expected brightness of classical novae and another at more than thousand times brighter luminosities.
Supernovae represent the explosive death of both low mass stars (type Ia) and moderate and high mass stars (types Ib/c and II). They are extremely bright, (roughly 10bbbIn Astronomy the symbol is used to denote the Sun. Thus, is the solar luminosity and is the solar mass. rivalling, for a few days, the combined light of the entire host galaxy. In all cases, a SN explosion injects highly metal-enriched material (at least 1 ) and a conspicuous amount of kinetic energy (about 1051 ergs) into the surrounding medium (see Section 2.1). In addition, the blast waves from SN explosions produce powerful sources of radio and X-ray emission – supernova remnants – that can be seen and studied many thousands of years after the event (see Section 2.2). Therefore, it is clear that SN explosions are crucial events that determine most of the aspects of the evolution of galaxies, i.e. most of the visible Universe.
Some SNe in our Milky Way galaxy have been close enough to be visible to the naked eye, and records of their occurrence can be found in ancient annals. In particular, during the past 2000 years 9 such events have been recorded. A few of these events were very bright. The supernova of 1006 AD, for example, was about 1/10 as bright as the full moon! The last supernova to be seen in our Galaxy was discovered in 1604 by the famous astronomer Kepler. On the basis of these historical records one may infer that the average rate of SN explosions in the Galaxy be of the order of 5 per millennium. However, one has to allow for the fact that most SNe are either too far or are too obscured by dark dust clouds of the galactic disk to be visible. Actually, one can estimate that only about 10% have been close enough and bright enough to be detectable by naked eye. Therefore, a more realistic SN explosion rate for our Galaxy is about one every twenty years (see also Section 2.3).
Being so bright, SNe are ideal probes of the distant Universe. And indeed studies of SNIa up to redshifts have allowed us to explicitely measure both the local expansion rate of the Universe and other cosmological parameters (see Section 2.4). The brightest supernova discovered in the last three centuries is supernova 1987A in the Large Magellanic Cloud, a small satellite galaxy to the Milky Way. Section 3 is devoted to it.
2 Properties of Supernovae
2.1 Supernova Types
Morphologically, Supernovae are distinguished into two main classes, Type I and Type II according to the main criterion of whether their spectra (thus, their ejecta) contain Hydrogen (Type II) or no Hydrogen (Type I).
Type II SNe are produced by the core collapse of massive stars, say, more massive than 8 and at least as massive as 20 (SN 1987A) or even 30 or more (SN 1986J). Thus, the lifetime of a SNII progenitor is shorter than about 100 million years (and can be as short as a FEW million years). Therefore, SNII can be found only in galaxies that are either just formed or that have efficient, ongoing star formation, such as spiral and irregular galaxies.
| Type | Ia | Ib/c | II |
|---|---|---|---|
| Hydrogen | NO | NO | YES |
| Optical | Metal lines | Metal lines | P Cyg lines |
| Spectrum | deep 6150 Å | no 6150 Å | Balmer series |
| Absolute | |||
| Luminosity | small dispersion | small disp.? | large disp. |
| at max light | standard candles | ||
| Optical | homogeneous | rather | heterogeneous |
| Light Curve | homogeneous | ||
| UV spectrum | very weak | weak | strong |
| Radio | no detection | strong | strong |
| Emission | fast decay | slow decay | |
| Location | all galaxies | spirals | spirals & |
| irregulars | |||
| Stellar | old | young | young |
| Population | |||
| Progenitors | white dwarfs | moderately | massive stars |
| in binary systems | massive stars |
The class of Type I supernovae has been recognized (e.g., Panagia 1985) to consist of two subclasses, Type Ia and Type Ib/c that, although sharing the common absence of Hydrogen, are widely apart in other properties and, especially, in their origins. The spectroscopic criterion to discern the two subclasses from each other is the presence (Ia) or absence (Ib/c)cccThey are classified Ib if strong He lines are present in their spectra, and Ic otherwise. of a strong Si+ 6150Å absorption feature which is prominent in their early epoch spectra. The astrophysical difference between Type Ia and Ib/c SNe is that the former are found in all type of galaxies, from ellipticals through spirals to irregulars, whereas the latter are found exclusively in spiral galaxies, mostly associated with spiral arms and frequently in the vicinities of large ionized nebulae (giant HII regions). These characteristics indicate that SNIb/c are the end result of a relatively young population of stars (ages less than 100 million years) while SNIa progenitors must be stellar systems that have considerably longer lifetimes, of the order of 109 years or more.
The progenitors of SNIa are believed to be stars that would not produce a SN explosion if they were single stars but that end up exploding because, after reaching the white dwarf stage, they accrete enough mass from a binary companion to exceed the Chandrasekhar mass, and ignite explosive nucleosynthesis in their cores. This process of “nuclear bomb” is expected to disrupt the entire star while synthetizing about 0.6 (Ia) of radioactive 56Ni, which will power the SN optical light curves. SNIa are very luminous objects and form a quite homogeneous class of SNe, both in their maximum brightness and their time evolution. Thus, SNIa constitute ideal “standard candles” for distance determinations on cosmological scales (see Sect. 2.4).
Type Ib/c, on the other hand, must be significantly more massive because they are only found in spiral galaxies, and often associated with their spiral arms: this suggests progenitor masses in excess of 5. Therefore, either they represent the upper end of the SNIa class or they are a subclass of core collapse supernovae, possibly massive stars that occur in binary systems and are able to shed most of their outer H-rich layers before undergoing the explosion.
2.2 Radio Properties
A series of papers published over the past 18 years on radio supernovae (RSNe) has established the radio detection and/or radio evolution for 25 objects: 2 Type Ib supernovae, 5 Type Ic supernovae, and 18 Type II supernovae. A much larger list of almost 80 more SNe have low radio upper limits (e.g., Weiler et al. 1986, 1998). A summary of the radio information can be found at: http://rsd-www.nrl.navy.mil/7214/weiler/sne-home.html.
All known RSNe appear to share common properties of: 1) non-thermal synchrotron emission with high brightness temperature; 2) a decrease in absorption with time, resulting in a smooth, rapid turn-on first at shorter wavelengths and later at longer wavelengths; 3) a power-law decline of the flux density with time at each wavelength after maximum flux density (optical depth ) is reached at that wavelength; and 4) a final, asymptotic approach of spectral index to an optically thin, non-thermal, constant negative value.
The current model for radio supernovae includes acceleration of relativistic electrons and compression of the magnetic field, necessary for synchrotron emission. These processes occur at the SN shock interface with a relatively high-density circumstellar medium (CSM) which has been ionized and heated by the initial UV/X-ray flash Chevalier (1982a,b). This CSM, which is also the source of the initial absorption, is presumed to have been established by a constant mass-loss () rate, constant velocity () wind (i.e., ) from a red supergiant (RSG) progenitor or a binary companion.
In our extensive study of the radio emission from SNe, several effects have been noted: 1) Type Ia are not radio emitters to the detection limit of the VLAddd The VLA is operated by the NRAO of the AUI under a cooperative agreement with the NSF.; 2) Type Ib/c are radio luminous with steeper spectral indices and a fast turn-on/turn-off, usually peaking at 6 cm near or before optical maximum; and 3) Type II show a range of radio luminosities with flatter spectral indices and a relatively slow turn-on/turn-off. These results lead to the conclusion that most SNII progenitors were RSGs, SNIb/c result from the explosion of more compact stars, members of relatively massive binary systems, and SNIa progenitors had little or no appreciable mass loss before exploding, excluding scenarios that involve binary systems with red giant companions. In some individual cases, it has also been possible to detect thermal hydrogen along the line of sight (Montes, Weiler & Panagia 1997, Chu et al. 1999), to demonstrate binary properties of the stellar system, and to show clumpiness of the circumstellar material (e.g., Weiler, Sramek & Panagia 1990). More speculatively, it may be possible to provide distance estimates to radio supernovae (Weiler et al. 1998).

As an illustration we show that case of SN 1979C that exploded in April 1979 in the spiral galaxy NGC 4321=M100. This supernova was first detected in the radio in early 1980 (Weiler et al. 1981) and is still bright enough to be accurately measured at different frequencies, thus offering a unique opportunity to do a very thorough study of its radio properties, the nature of the radio emission mechanisms and the late evolution of the SN progenitor. Figure 1 displays the time evolution of SN 1979C radio flux at two frequencies (1.47 and 4.88 GHz). One can recognize the “canonical” properties (non-thermal spectral index, flux peaking at later times for lower frequencies, asymptotic power law decline) that allows one to estimate the circumstellar material distribution, corresponding to a constant velocity pre-SN wind with a mass loss rate of /year and a probable 20 progenitor. In addition, the almost sinosoidal modulation of the light curves reveals the presence of a 5 binary companion in a slightly elliptical orbit (Weiler et al. 1992). And the marked jump up of the flux about ten years after the explosion (Montes et al.2000) suggests that the progenitor had a rather sudden change in its mass loss rate about 10,000 years before exploding, possibly due to pulsational instability (Bono & Panagia 1999, in preparation).
2.3 Supernova Rates
Determining the rates of SN explosions in galaxies requires knowing how many SNe have exploded in a large number of galaxies over the period of time during which they were monitored. Although it sounds easy, this process is rather tricky because data collected from literature usually do not report the control times over which the searches were conducted. On the other hand, more systematic searches that record all needed information have been started rather recently and the number of events thus recorded is rather limited, so that the statistics is still rather uncertain. In a recent study, Cappellaro et al.(1999) have thoroughly discussed this problem and, from the analysis of all combined data set available, have derived the most reliable SN rates for different types of galaxies. We have taken their rates and, for each galaxy class, we have renormalized them to the appropriate H-band () luminosity rather than the B-band () luminosity as done by Cappellaro et al. (1999). These new rates, displayed in Table 2, are essentially rates per unit galaxy mass because the H-band luminosity of a galaxy is roughly proportional to its mass. We see that SN rates closely reflect the star formation activity of the various classes, not only for type II and Ib/c SNe but also for SNIa. In particular, the rates for SNII-Ib/c are 3-4 times higher in late type spirals (Sbc-d) and irregulars than they are in early type spirals (S0-Sb): this is clear evidence that star formation is considerably more active in the former than it is in the latter group. Also, we notice that late type galaxies (i.e. the ones with most active star formation, Sbc through Irr) have SNIa rates which are 4-10 times higher that the earliest type galaxies (i.e. E-S0). This is a new result (Panagia 1999, in preparation) and implies that SNIa progenitors are intermediate mass stars (say, ) and that early type galaxies are likely to capture and accrete star forming galaxies on a time scale of one to few billion years to replenish their reservoir of SNIa progenitors.
Recent estimates of the global history of star formation in the Universe were used by Madau, Della Valle & Panagia (1998) to compute the theoretical Type Ia and Type II SN rates as a function of cosmic time from the present epoch to high redshifts. They show that accurate measurements of the frequency of SN events already in the range , and even more so at higher redshifts, will be valuable probes of the nature of Type Ia progenitors and the evolution of the stellar birthrate in the Universe.
| Galaxy Type | SNIa | SNIb/c | SNII | All SNe |
|---|---|---|---|---|
| E-S0 | 0.050.02 | 0.050.02 | ||
| S0a-Sb | 0.100.04 | 0.060.03 | 0.240.111 | 0.400.12 |
| Sbc-Sd | 0.210.08 | 0.140.07 | 0.860.35 | 1.210.37 |
| Sm, Irr | 0.590.24 | 0.330.24 | 0.970.60 | 1.870.67 |
2.4 Cosmological Applications
As mentioned before, SNIa are virtually ideal standard candles (e.g., Hamuy et al. 1996) to measure distances of truly distant galaxies, currently up to redshift around 1 and, considerably more in the foreseeable future (for a review, see Macchetto and Panagia 1999). In particular, Hubble Space Telescope observations of Cepheids in parent galaxies of SNe Ia (an international project lead by Allan Sandage) have lead to very accurate determinations of their distances and the absolute magnitudes of SNIa at maximum light, i.e. and (e.g., Sandage et al. 1996, Saha et al. 1999). Using these calibrations it is possible to determine the distances of much more distant SNe Ia. A direct comparison with the Hubble diagram (i.e. a plot of the observed magnitudes of SNIa versus their cosmological velocities) of distant SNe Ia () gives a Hubble constant (i.e. the expansion rate of the local Universe) of (Saha et al. 1999). Studying more distant SNIa (i.e. ) it has benn possible to extend our knowledge to other cosmological parameters. The preliminary results of two competing teams (Riess et al. 1998, Perlmutter et al. 1999) agree in indicating a non-empty inflationary Universe with parameters lying along the line . Correspondingly, the age of the Universe can be bracketed within the interval 12.3–15.3 Gyrs to a 99.7% confidence level (Perlmutter et al. 1999).
3 Supernova 1987A in the Large Magellanic Cloud
3.1 The Early Story
Supernova 1987A was discovered on February 24, 1987 in the nearby, irregular galaxy, the Large Magellanic Cloud, which is located in the southern sky. SN 1987A is the first supernova to reach naked eye visibility after the one studied by Kepler in 1604 AD and is undoubtedly the supernova event best studied ever by the astronomers. Actually, despite the fact that SN 1987A has been more than hundred times fainter than its illustrious predecessors in the last millennium, it has been observed in such a detail and with such an accuracy that we can define this event as a first under many aspects (e.g. neutrino flux, identification of its progenitor, gamma ray flux) and in any case as the best of all. Reviews of both early and more recent observations and their implications can be found in Arnett et al. (1989) and Gilmozzi and Panagia (1999), respectively.
SN 1987A early evolution has been highly unusual and completely at variance with the wisest expectations. It brightened much faster than any other known supernova: in about one day it jumped from 12th up to 5th magnitude at optical wavelengths, corresponding to an increase of about a factor of thousand in luminosity. However, equally soon its rise leveled off and took a much slower pace indicating that this supernova would have never reached those peaks in luminosity as the astronomers were expecting. Similarly, in the ultraviolet, the flux initially was very high, even higher than in the optical. But since the very first observation, made with the International Ultraviolet Explorer (IUE in short) satellite less than fourteen hours after the discovery, the ultraviolet flux declined very quickly, by almost a factor of ten per day for several days. It looked as if it was going to be a quite disappointing event and, for sure, quite peculiar, thus not suited to provide any useful information about the other more common types of supernova explosions. But, fortunately, this proved not to be true and soon it became apparent that SN 1987A is the most valuable mean to test our ideas and theories about the explosion of supernovae.
And even particle emission was directly measured from Earth: on February 23, around 7:36 Greenwich time, the neutrino telescope (”Kamiokande II”, a big cylindrical “tub” of water, 16 m in diameter and 17 m in height, containing about 3300 m3 of water, located in the Kamioka mine in Japan, about 1000 m underground) recorded the arrival of 9 neutrinos within an interval of 2 seconds and 3 more 9 to 13 seconds after the first one. Simultaneously, the same event was revealed by the IMB detector (located in the Morton-Thiokol salt mine near Faiport, Ohio) and by the “Baksan” neutrino telescope (located in the North Caucasus Mountains, under Mount Andyrchi) which recorded 8 and 5 neutrinos, respectively, within few seconds from each other. This makes a total of 25 neutrinos from an explosion that allegedly produces 10 billions of billions of billions of billions of billions of billions of them! But a little more than two dozens neutrinos was more than enough to verify and confirm the theoretical predictions made for the core collapse of a massive star (e.g., Arnett et al. 1989 and references therein). This process was believed to be the cause of the explosion of massive stars at the end of their lives, and SN 1987A provided the experimental proof that the theoretical model was sound and correct, promoting it from a nice theory to the description of the truth.
3.2 SN 1987A Progenitor Star
From both the presence of hydrogen in the ejected matter and the conspicuous flux of neutrinos, it was clear that the star which had exploded was quite massive, about twenty times more than our Sun. And all of the disappointing peculiarities were due to the fact that just before the explosion the supernova progenitor was a blue supergiant star instead of being a red supergiant as common wisdom was predicting. There is no doubt about this explanation because SN 1987A is exactly at the same position as that of a well known blue supergiant, Sk 202. And the IUE indicated that such a star was not shining any more after the explosion: the blue supergiant had gone BANG (Gilmozzi et al. 1987, Kirshner et al. 1987).
On the other hand, common wisdom cannot be wrong and it was not quite wrong, after all. At later times, in late May 1987, the IUE revealed the presence of emission lines of nitrogen, oxygen, carbon and helium in the ultraviolet spectrum. They kept increasing in intensity with time and proved to be quite narrow, indicating that the emitting matter was moving at much lower speeds (less than a factor of hundred slower) than the supernova ejecta. The chemical abundances and the slow motion were clear sign that that was matter ejected by a red supergiant in the form of a gentle wind. But there was no such a star in sight just before the explosion. Therefore, the same star that exploded, had also been a red supergiant, less than hundred thousand years before the explosion itself: a short time in the history of the star but quite enough to make all the difference.
3.3 Explosive Nucleosynthesis
The optical flux reached a maximum around mid-May, 1987, and declined at a quick pace until the end of June, 1987, when rather abruptly it slowed down, setting at a much more gentle decline of about 1% a day (Pun et al. 1995). Such a decay has been followed since then quite regularly: a perfect constant decay with a characteristic time of 114 days, just the same as that of the radioactive isotope of cobalt, 56Co, while transforming into iron. This is the best evidence for the occurrence of nucleosynthesis during the very explosion: 56Co is in fact the result of 56Ni and this latter can be formed at the high temperatures which occur after the core collapse of a massive star. So now, not only are we sure that such a process is operating in a supernova explosion, just as theorists predicted, but we can also determine the amount of nickel produced in the explosion, slightly less than 8/100 of a solar mass or, approximately, 1% of the mass of the stellar core before the explosion. And the hard X-ray emission detected since July 1987 and the subsequent detection of gamma-ray emission confirm the reality of this process and provide more details about its exact occurrence (e.g., Arnett et al. 1989 and references therein).
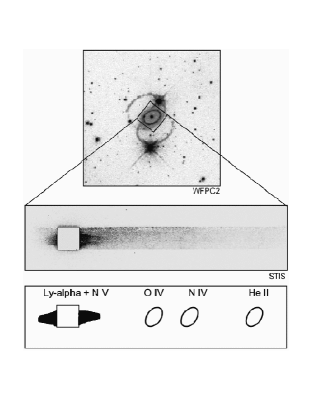
3.4 HST Observations
The Hubble Space Telescope was not in operation when the supernova exploded, but it did not miss its opportunity in due time and its first images, taken with the ESA-FOC in August 23 and 24, 1990, revealed the inner circumstellar ring in all its “glory” and detail (cf. Jakobsen et al. 1991), showing that, despite spherical aberration, HST was not a complete disaster, after all.
Since those early times, Hubble has kept an attentive eye on SN 1987A,
obtaining both imaging and spectrographic observations (e.g., Fig. 2) at
least once a year, accumulating valuable data and revealing quite a
number of interesting results (see Gilmozzi & Panagia 1999),
such as:
- The sequence of images obtained over more than 8 years has allowed
us to measure the expansion of the supernova material
directly: this the first time it has ever been possible and has
permitted to identify the correct models to understand the explosion
phenomenon (Pun et al. 1999, in preparation).
- The origin and the nature of the beautiful circumstellar rings are
still partly a mistery. They have been measured to expand rather
slowly, about 10-20 , i.e. 100-2000 times slower than the SN
ejecta, and to be highly N rich: both these aspects
indicate that the rings were expelled from the progenitor star when it was
a red supergiant, about 20,000 years before the explosion
(Panagia et al. 1996). However, one would have expected such a star to eject
material in a more regular fashion, just pushing away material gently
in all directions rather than puffing rings like a pipe smoker.
Another puzzle is that the star was observed to be a “blue” supergiant
in the years before the explosion, and not a red supergiant anymore.
This forces one to admit that the star had a rather fast evolution,
which was not predicted by “standard” stellar evolution theory, and
still is hard to understand fully.
- The highest velocity material expelled in SN 1987A explosion has
been detected for the first time by the Space Telescope Imaging
Spectrograph (STIS) (e.g., Sonneborn et al. 1998). The spectrograph has
found the first direct evidence for material from SN 1987A colliding
with its inner circumstellar ring. The fastest debris, moving at
15,000 are now colliding with the slower moving gas of the inner
circumstellar ring (Fig. 2) .
In less than a decade the full force of the supernova fast material will hit the inner ring, heating and exciting its gas and producing a new series of cosmic fireworks that will offer a spectacular view for several years. This is going the “beginning of the end” because in about another century most, if not all, the material in the rings will be swept away and disappear, loosing their identities and merging into the interstellar medium of the Large Magellanic Cloud. This is not a complete loss, however, because by studying this destructive process, we will be able to probe the ring material with a detail and an accuracy which are not possible with current observations.
References
References
- [1] W.D. Arnett et al., ARA&A 27, 629 (1989).
- [2] W. Baade and F. Zwicky, Proc. Nat. Acad. Sci. U.S. 20, 254 (1934).
- [3] E. Cappellaro, R. Evans and M. Turatto, Astron. & Astrophys. 351, 459 (1999).
- [4] R.A. Chevalier, Astrophys. J. 259, 302 (1982a).
- [5] R.A. Chevalier, Astrophys. J. Lett. 259, L85 (1982b).
- [6] Y.H. Chu et al., Astrophys. J. Lett. 512, L51 (1999).
- [7] R. Gilmozzi et al., Nature 328, 318 (1987).
- [8] R. Gilmozzi and N. Panagia, Mem. Soc. Astron. It. 70, 583 (1999).
- [9] M. Hamuy et al., Astron. J. 112, 2391 (1994).
- [10] R.P. Kirshner et al., Astrophys. J. 320, 602 (1987).
- [11] P. Jakobsen et al., Astrophys. J. 369, L63 (1991).
- [12] F.D. Macchetto and N. Panagia, in Post-Hipparcos Cosmic Candles, eds. A. Heck & F. Caputo, p. 225-245 (Kluwer-Holland, 1999).
- [13] P. Madau, M. Della Valle and N. Panagia, Mon. Not. Roy. Astron. Soc 297, L17 (1998).
- [14] M.J. Montes, K.W. Weiler, & N. Panagia, Astrophys. J. 488, 792 (1997).
- [15] M.J. Montes et al., Astrophys. J., in press (2000).
- [16] N. Panagia, 1985, in Supernovae As Distance Indicators, Lect. Notes Phys. Vol. 224, p. 226-240 (Springer-Verlag-Berlin, 1985).
- [17] N. Panagia et al., Astrophys. J. 380, L23 (1991).
- [18] N. Panagia et al., Astrophys. J. 457, 604 (1996).
- [19] S. Perlmutter et al., Astrophys. J. 517, 565 (1999).
- [20] C.S.J. Pun et al., Astrophys. J. Suppl. 99, 223 (1995).
- [21] A.G. Riess et al., Astrophys. J. 504, 935 (1998).
- [22] A. Saha et al., Astrophys. J. 522, 802 (1999).
- [23] A. Sandage et al., Astrophys. J. 460, L15 (1996).
- [24] G. Sonneborn et al., Astrophys. J. 492, 139 (1998).
- [25] K.W. Weiler et al., Astrophys. J. 243, L151 (1991).
- [26] K.W. Weiler et al., Astrophys. J. 301, 790 (1986).
- [27] K.W. Weiler, N. Panagia, & R.A. Sramek, Astrophys. J. 364, 611 (1990).
- [28] K.W. Weiler et al., Astrophys. J. 500, 51 (1998).