X-ray Spectra of a large sample of Quasars with ASCA
Abstract
The results from an X-ray spectral analysis of a large sample of quasars, observed with ASCA, are presented. The sample was selected to include all ASCA observations of quasars, with z and M, available up to January 1998. The data reduction leaves 62 quasars, 35 radio-loud and 27 radio-quiet, suitable for spectral analysis. Differences are found between the radio-quiet quasars (RQQs) and the radio-loud quasars (RLQs); the RLQs have flatter X-ray spectra (), with little iron line emission or reflection and are more X-ray luminous than the softer () RQQs, in agreement with previous studies. A correlation between and optical H was also found for the radio-quiet quasars in this sample, whereby the steepest X-ray spectra tend to be found in those objects with narrow H widths. The correlation is significant at 99% confidence, confirming the well-known trend between and H FWHM in Seyfert 1s (Brandt et al. 1997), but at higher luminosities.
Other spectral complexities are observed from this sample. A soft X-ray excess, with blackbody temperatures in the range 100 - 300 eV, is seen in many low z radio-quiet quasars. In most cases the temperatures are probably too hot to originate directly from the disk and could imply that some reprocessing is involved. Iron K line emission features are also found in the RQQs; but often from partially ionised material. Indeed in the highest luminosity RQQs there is neither evidence for iron line emission nor the reflection component expected from disk reflection models. These observations can be explained by an increase in the quasar accretion rate with luminosity, leading to an increase in the ionisation state of the surface layers of the disk. The occurrence of ionised or ‘warm’ absorbers is rare in this sample, with only 5 detections in low z objects. However excess neutral X-ray absorption is found towards several of the high z, predominantly radio-loud, quasars. Although found to increase with quasar redshift, this ‘intrinsic’ absorption may be associated with radio-loud AGN.
keywords:
galaxies: active - galaxies: quasars - surveys: quasars - X-rays1 Introduction
Discovered in 1963 (Schmidt 1963), quasars are the most luminous continuously emitting objects in the Universe and represent the high luminosity end of the class of objects known as Active Galactic Nuclei (AGN). Like their lower luminosity cousins - Seyfert 1 galaxies - the bulk of the energy produced in quasars is thought to arise from accretion onto a compact object (the putative super-massive black hole). This central engine is also thought to be where the X-rays, that are observed from both quasars and Seyfert 1s, originate from.
In one model, the UV photons produced by viscous dissipation in an accretion disk are Comptonised to X-ray energies by a hot corona above the surface of this disk (Haardt & Maraschi 1993). These hard X-rays in turn illuminate the accretion disk, being either ‘reflected’ back towards the observer or thermalised into optical or UV photons. Evidence for these ‘reflection’ features (in the form of an iron K emission line, Fe K absorption edge and Compton scattering hump) is commonly observed in the X-ray spectral band in Seyfert 1 galaxies (e.g. Pounds et al. 1990, Nandra & Pounds 1994). The detection of these reflection features however, in quasars, remains more ellusive (Reeves et al. 1997, Lawson & Turner 1997). In the radio-loud quasars the situation is somewhat further complicated by the presence of a powerful relativistic radio-jet. In the X-ray band, these radio-loud quasars have flatter X-ray spectral emission (e.g. Wilkes & Elvis 1987, Lawson et al. 1992), and are generally more luminous than the radio-quiet quasars. The radio-loud quasars also have little or no X-ray (iron) line emission; this is often interpreted in terms of the Doppler boosting of the X-ray continuum, by the relativistic jet (see Reeves et al. 1997 and references therein).
This paper presents the results of a detailed spectral analysis of 68 quasars obtained from the ASCA public archive. The aims are to extend the results that were presented in Reeves et al. (1997), which contained a smaller sample of 24 objects. The objects considered in this sample contain a roughly equal mix of both radio-loud and radio-quiet quasars. The bigger sample, for instance, allows us to perform an investigation of the properties of iron K lines and reflection in quasars, which will be limited in some of the objects by signal-to-noise. It also permits us to investigate the properties of quasars over a large range of luminosity and redshift. A further aim of the paper is to make the results of this analysis available to the general community; the paper presents results from a considerable number of quasars that are currently unpublished.
In the following section, the selection and properties of the sample are discussed. Section 3 then outlines the spectral fitting that was performed on the quasars in the sample. The following sections (4-7) then present and discuss the results in terms of the X-ray continuum emission, soft X-ray excesses from quasars, the properties of the iron line and reflection associated with the putative accretion disk and also the effects of absorbing material on the quasar spectra. Values of km s-1 Mpc-1 and are assumed and all fit parameters are given in the quasar rest frame.
2 The ASCA sample of Quasars
Data have been selected mainly from the ASCA public archive, using all quasars that were available up until January 1998. The observations included in this paper are shown in table 1; in general when there has been a multiple observation of a given quasar we have taken the first observation. In total 68 quasars have been included in the sample, with the objects selected predominantly type I AGN. This covers a wide range of redshift (from z=0.06 to z=4.3), and also a wide range of luminosities (M to -30 and L erg s-1 to 1047 erg s-1). Note that redshift and luminosity cut-offs of z and M respectively have been used to define the sample. The distribution of quasar redshift for this sample is included as figure 1. Note that at z , the sample is predominantly made up of bright core-dominated radio-loud quasars.

Standard (to conservative) ASCA screening criteria and data selection have been used in analysing the data, this leaves 62 quasars that have sufficient signal-to-noise for further spectral analysis and interpretation. The selection criteria used in reducing these observations are outlined in Reeves et al. (1997). Of these 62 quasars, 35 are radio-loud and 27 are radio-quiet; according to the definition of radio-loudness (RL) used by Wilkes & Elvis (1987), where RL = log (F5GHz/FB). The cut-off between radio-quiet and radio-loud is defined arbitrarily at R=1. The roughly even numbers of objects in both classes allows us to investigate the properties within both.
Some objects, as described above, have been left out of the subsequent analysis. The radio-quiet object IRAS P09104+4109 may be a buried quasar, i.e. surrounded by a very high column of material; however most of the X-ray emission is thought to originate from a surrounding cluster and X-ray luminous cooling flow (Fabian & Crawford 1995). Similarly the RQQ E 0015+162 is strongly contaminated by the powerful X-ray emitting cluster CL 0016+16 (e.g. Neumann & Bohringer 1997) and the spatial resolution of ASCA is not sufficient to resolve these two objects. Therefore further analysis of these 2 sources have been excluded from our sample. Finally spectra have only been extracted where the source is detected at the 5 level in the ASCA detectors. This excludes the radio-quiet quasars QSO 0215-504, MS 12487+5706 and QSO 1725+503 from further study. The radio-quiet broad absorption line (BAL) quasar PHL 5200 has only been detected in the GIS3 and SIS0 detectors, but not GIS2 nor SIS1. As the data from this quasar contain few counts with which to constrain the spectral form, this object has also been excluded from further study in the sample.
3 X-ray Spectral Fitting
The ASCA data reduction process provides four seperate spectra, one for each of the four (GIS and SIS) instruments. Spectral fitting was performed by simultaneously fitting the data from each instrument, allowing the relative normalisations to vary as necessary. The processed spectra were fitted with a spectral model using the X-ray spectral fitting software XSPEC v10.0, over the energy range 0.8-10 keV for the GIS instruments and from 0.6-10 keV for the SIS.
The standard model used consists of a power-law with neutral absorption, together with a Gaussian-shaped narrow ( keV) Fe K line at 6.4 keV in the rest frame of the quasar. The absorption column that was fitted has two components; (i) the Galactic column density which was fixed in value in the z=0 frame, and (ii) the intrinsic absorption of the quasar in its rest frame, which was allowed to vary in value. The Galactic column densities have been obtained from the getnh program, run under the xanadu system, which uses data from Stark et al. (1992) and other surveys; absorption cross-sections have been taken from Morrison & McCammon (1983). Where possible more accurate values of towards a particular quasar have been taken from individual observations using either Elvis et al. (1989) or Murphy et al. (1996), which use higher spatial resolution.
| Source | Common | Object | Co-ordinates (2000) | Obs Date | Duration | z | MV | RL | N | ||
|---|---|---|---|---|---|---|---|---|---|---|---|
| Name | Class | RA | Dec | (yy.ddd) | (ksec) | ||||||
| 0014+813 | S5 | RLQ | 00 17 08.0 | 81 35 07 | 93.302 | 68.1 | 3.41 | -29.7 | 2.33 | 14.6 | |
| 0015+162 | E | RQQ | 00 18 31.8 | 16 29 26 | 93.200 | 91.5 | 0.554 | -24.0 | 0.71 | 4.22 | |
| 0050+124 | IZWI | RQQ | 00 53 34.8 | 12 41 36 | 95.196 | 93.6 | 0.061 | -23.4 | -0.59 | 5.07 | |
| 0054+144 | PHL 909 | RQQ | 00 57 09.8 | 14 46 11 | 96.018 | 45.8 | 0.17 | -23.1 | -0.02 | 4.2 | |
| 0057-222 | TON S180 | RQQ | 00 57 20.1 | -22 22 55 | 96.192 | 96.5 | 0.062 | -23.0 | -0.70 | 1.57 | |
| 0205+024 | NAB | RQQ | 02 07 49.8 | 02 42 55 | 96.018 | 118.6 | 0.155 | -24.2 | -0.21 | 2.99 | |
| 0208-512 | PKS | RLQ | 02 10 46.2 | 51 01 02 | 95.015 | 32.2 | 1.003 | -26.3 | 3.63 | 2.49 | |
| 0215-504 | QSO | RQQ | 02 17 25.3 | -50 15 32 | 95.192 | 100.8 | 2.620 | -25.7 | 1.17 | 2.47 | |
| 0232-04 | PKS/PHL1377 | RLQ | 02 35 07.2 | -04 02 05 | 94.220 | 104.5 | 1.438 | -27.5 | 2.75 | 3.28 | |
| 0237-233 | PKS | RLQ | 02 40 08.1 | -23 09 17 | 94.222 | 104.4 | 2.224 | -28.0 | 3.50 | 2.29 | |
| 0332-403 | PKS | RLQ | 03 34 13.7 | -40 08 26 | 94.224 | 45.1 | 1.445 | -25.4 | 4.17 | 2.18 | |
| 0333+321 | NRAO140 | RLQ | 03 36 30.1 | 32 18 28 | 94.032 | 92.6 | 1.258 | -27.3 | 2.85 | 14.2 | |
| 0348-120 | PKS/H | RLQ | 03 51 10.8 | -11 53 20 | 96.036 | 109.0 | 1.520 | -25.1 | 3.56 | 4.09 | |
| 0410+110 | 3C 109.0 | RLQ | 04 13 40.3 | 11 12 14 | 95.240 | 103.9 | 0.306 | -23.9 | 3.25 | 30.0 | |
| 0420-01 | PKS | RLQ | 04 23 15.7 | -01 20 33 | 97.243 | 60.9 | 0.915 | -25.6 | 3.52 | 7.47 | |
| 0438-436 | PKS | RLQ | 04 40 17.1 | -43 33 09 | 93.194 | 85.8 | 2.852 | -26.3 | 4.75 | 1.3 | |
| 0440-285 | PKS | RLQ | 04 42 37.5 | -28 25 29 | 97.268 | 57.4 | 1.952 | -25.5 | 3.48 | 2.93 | |
| 0443-282 | X | RLQ | 04 43 19.3 | -28 20 04 | 97.268 | 57.4 | 0.156 | -24.0 | 1.33 | 2.93 | |
| 0449-183 | E | RQQ | 04 51 38.8 | -18 18 55 | 94.063 | 80.3 | 0.338 | -23.0 | 0.97 | 3.77 | |
| 0528+134 | PKS | RLQ | 05 30 56.4 | 13 31 54 | 95.066 | 62.9 | 2.07 | -26.9 | 4.03 | 23 | |
| 0537-286 | PKS | RLQ | 05 39 54.2 | -28 39 55 | 94.074 | 102.7 | 3.11 | -25.2 | 4.35 | 1.95 | |
| 0558-504 | PKS | RLQ | 05 59 47.4 | -50 26 51 | 96.249 | 97.6 | 0.137 | -24.4 | 1.34 | 5.28 | |
| 0836+715 | S5 | RLQ | 08 41 24.4 | 70 53 41 | 95.076 | 40.1 | 2.17 | -28.2 | 3.33 | 2.83 | |
| 0903+169 | 3C 215.0 | RLQ | 09 06 31.8 | 16 46 11 | 95.308 | 84.8 | 0.411 | -23.4 | 3.23 | 3.37 | |
| 0910+410 | IRAS | RQQ | 09 13 45.5 | 40 56 26 | 93.316 | 91.8 | 0.442 | -23.8 | 0.80 | 1.82 | |
| 1029-1401 | HE | RQQ | 10 31 54.3 | -14 16 52 | 95.342 | 107.0 | 0.086 | -24.2 | -0.12 | 5.27 | |
| 1101-264 | Q | RQQ | 11 03 25.2 | -26 45 15 | 96.168 | 42.8 | 2.152 | -28.7 | 0.61 | 6.38 | |
| 1104-1805 | HE | RQQ | 11 06 33.5 | -18 21 24 | 96.162 | 107.8 | 2.319 | -28.7 | -0.96 | 4.24 | |
| 1114+445 | PG | RQQ | 11 17 06.2 | 44 13 33 | 96.126 | 172.2 | 0.144 | -23.3 | -0.88 | 1.93 | |
| 1116+215 | PG | RQQ | 11 19 08.7 | 21 19 17 | 95.139 | 43.1 | 0.177 | -24.6 | -0.28 | 2.2 | |
| 1148+549 | PG | RQQ | 11 51 20.4 | 54 37 32 | 95.341 | 81.6 | 0.968 | -27.4 | -0.15 | 1.17 | |
| 1211+143 | PG | RQQ | 12 14 17.6 | 14 03 12 | 93.154 | 91.8 | 0.085 | -23.8 | -0.92 | 2.83 | |
| 1216+069 | PG | RQQ | 12 19 20.6 | 06 38 37 | 95.359 | 45.5 | 0.334 | -25.4 | 0.41 | 1.91 | |
| 1219+755 | Mrk205 | RQQ | 12 21 44.0 | 75 18 37 | 94.337 | 75.1 | 0.070 | -23.4 | -0.27 | 2.74 | |
| 1226+023 | 3C 273 | RLQ | 12 29 06.6 | 02 03 08 | 93.361 | 29.2 | 0.158 | -26.7 | 2.92 | 1.9 | |
| 1247+268 | PG | RQQ | 12 50 05.6 | 26 31 06 | 95.168 | 100.8 | 2.041 | -28.7 | -0.44 | 0.86 | |
| 12487+5706 | MS | RQQ | 12 50 58.0 | 56 49 55 | 94.143 | 86.2 | 1.843 | -25.3 | 1.07 | 1.22 | |
| 1253-055 | 3C 279 | RLQ | 12 56 11.1 | -05 47 21 | 93.172 | 92.2 | 0.538 | -24.3 | 4.60 | 2.22 | |
| 1308+326 | B2 | RLQ | 13 10 28.6 | 32 20 43 | 96.162 | 86.8 | 0.997 | -28.0 | 2.65 | 1.10 | |
| 13349+2438 | IRAS | RQQ | 13 37 18.7 | 24 23 03 | 95.178 | 49.9 | 0.107 | -23.7 | 0.20 | 1.08 | |
| 13434+0001 | RD J | RQQ | 13 43 23.6 | 00 00 55 | 96.012 | 252.4 | 2.350 | -23.8 | 2.27 | 3.26 | |
| 1404+226 | PG | RQQ | 14 06 21.8 | 22 23 46 | 94.194 | 100.6 | 0.098 | -23.1 | -0.34 | 2.0 | |
| 1407+265 | PG | RQQ | 14 09 23.7 | 26 28 20 | 93.183 | 84.8 | 0.944 | -27.5 | 0.45 | 1.4 | |
| 1416-129 | PG | RQQ | 14 19 03.7 | -13 10 44 | 94.210 | 79.1 | 0.129 | -24.3 | -0.46 | 7.2 | |
| 1422+231 | B | RLQ | 14 24 38.1 | 22 56 00 | 95.014 | 86.5 | 3.62 | -29.0 | 2.65 | 2.88 | |
| 1425+267 | PG | RLQ | 14 27 35.6 | 26 32 13 | 96.208 | 91.8 | 0.366 | -25.6 | 1.75 | 1.54 | |
| 1440+356 | Mrk478 | RQQ | 14 42 07.4 | 35 26 22 | 95.183 | 86.8 | 0.079 | -23.1 | -0.01 | 1.24 | |
| 1508+571 | Q | RLQ | 15 10 02.1 | 57 03 04 | 95.061 | 165.8 | 4.3 | -26.8 | 3.36 | 1.34 | |
| 1510-089 | PKS | RLQ | 15 12 50.4 | -09 06 00 | 96.233 | 64.4 | 0.360 | -25.1 | 3.47 | 8.38 | |
| 1559+089 | Q | RQQ | 16 02 22.5 | 08 45 36 | 96.236 | 63.7 | 2.269 | -26.2 | 0.87 | 4.22 | |
| 1614+051 | PKS | RLQ | 16 16 37.6 | 04 59 32 | 94.214 | 92.4 | 3.21 | -25.8 | 4.12 | 5.21 | |
| 1633+38 | 4C38.41/B2 | RLQ | 16 35 15.3 | 38 08 03 | 96.064 | 22.2 | 1.814 | -26.3 | 4.16 | 1.02 | |
| 1634+706 | PG | RQQ | 16 34 25.0 | 70 35 27 | 94.122 | 63.1 | 1.334 | -28.9 | -0.59 | 5.74 | |
| 1718+481 | PG | RLQ | 17 19 38.6 | 48 08 07 | 94.121 | 63.5 | 1.084 | -28.1 | 1.56 | 2.61 | |
| 1725+503 | QSO | RQQ | 17 26 57.5 | 50 15 48 | 95.063 | 85.6 | 2.100 | -24.2 | 1.59 | 3.24 | |
| 17254-1413 | PDS 456 | RQQ | 17 28 19.8 | -14 15 56 | 98.066 | 114.2 | 0.184 | -27.1 | -0.46 | 24.0 | |
| 1745+624 | Q | RLQ | 17 46 14.7 | 62 27 04 | 94.239 | 55.5 | 3.87 | -26.2 | 1.59 | 3.51 | |
| 1821+643 | E | RQQ | 18 21 59.2 | 64 21 07 | 93.170 | 91.5 | 0.297 | -26.8 | 0.013 | 5.6 | |
| 1946+765 | HS | RQQ | 19 44 54.8 | 77 05 52 | 95.294 | 78.5 | 3.02 | -29.7 | -0.51 | 7.4 | |
| 2000-330 | PKS | RLQ | 20 03 23.9 | -32 51 47 | 95.286 | 67.9 | 3.777 | -26.5 | 4.05 | 7.8 | |
| 2019+098 | 3C 411.0 | RLQ | 20 22 08.3 | 10 01 12 | 94.296 | 56.8 | 0.469 | -23.1 | 3.85 | 7.92 | |
| Table 1 continued | ||||||||||
| Source | Common | Object | Co-ordinates (2000) | Obs Date | Drn | z | MV | RL | N | |
| Name | Class | RA | Dec | (yy.ddd) | (ksec) | |||||
| 2043+749 | 4C 74.26/S5 | RLQ | 20 42 37.1 | 75 08 01 | 94.296 | 43.7 | 0.104 | -24.3 | 1.60 | 13.3 |
| 2126-158 | PKS | RLQ | 21 29 12.0 | -15 38 41 | 93.136 | 105.5 | 3.27 | -28.0 | 3.37 | 4.85 |
| 2149-306 | PKS | RLQ | 21 51 55.3 | -30 27 53 | 94.299 | 46.5 | 2.345 | -26.3 | 3.83 | 1.93 |
| 2225-055 | PHL 5200 | RQQ | 22 28 30.3 | -05 18 55 | 94.172 | 55.0 | 1.98 | -27.0 | 0.03 | 4.07 |
| 2230+114 | CTA 102 | RLQ | 22 32 36.3 | 11 43 51 | 95.340 | 45.0 | 1.037 | -26.1 | 3.78 | 5.05 |
| 2251+113 | PKS/PG | RLQ | 22 54 10.4 | 11 36 38 | 96.153 | 73.4 | 0.323 | -25.3 | 2.43 | 5.53 |
| 2251-178 | MR | RQQ | 22 54 05.7 | -17 34 54 | 93.310 | 21.6 | 0.068 | -23.4 | -0.43 | 2.84 |
| Quasar | Radio | Continuuma | N | c | Line Fluxd | EQW | e | |||
|---|---|---|---|---|---|---|---|---|---|---|
| Name | Class | Flux | L2-10 | |||||||
| S5 0014+813 | RL | 1.690.05 | 3.80 | 107.6 | 64.5 | 19.8 | 0.0 | 329.8/319 | ||
| E 0015+162 | RQ | 1.990.09 | 2.92 | 2.81 | 6.2 | 9.3 | 0.3 | 267.3/258 | ||
| IZWI | RQ | 2.370.05 | 6.81 | 0.055 | 0.31 | 8.9 | 12.0 | 483 | 11.9 | 604.3/608 |
| PHL909 | RQ | 1.110.11 | 4.1 | 0.39 | 0.0 | 5.25 | 158 | 4.5 | 257.4/247 | |
| TON S180g | RQ | 2.310.07 | 16.1 | 0.088 | 0.0 | 5.0 | 123 | 8.2 | 978.7/977 | |
| NAB 0205+024 | RQ | 2.100.08 | 5.82 | 0.297 | 0.0 | 1.0 | 722.5/713 | |||
| PKS 0208-512 | RL | 1.690.04 | 9.49 | 31.3 | 4.6 | 32.2 | 0.0 | 201.5/268 | ||
| QSO 0215-504 | RQ | |||||||||
| PHL1377 | RL | 1.720.06 | 2.55 | 17.0 | 3.8 | 3.0 | 0.0 | 224.7/253 | ||
| PKS 0237-233 | RL | 1.680.06 | 1.65 | 25.5 | 12.2 | 5.1 | 0.0 | 213.8/207 | ||
| PKS 0332-403 | RL | 1.710.12 | 1.12 | 7.75 | 1.0 | 0.7 | 65.4/83 | |||
| NRAO 140 | RL | 1.670.02 | 10.8 | 64.5 | 10.2 | 190.4 | 0.0 | 892.7/951 | ||
| H 0348-120 | RL | 1.870.20 | 0.32 | 2.45 | 0.0 | 0.0 | 47.2/50 | |||
| 3C 109.0 | RL | 1.710.05 | 6.51 | 2.32 | 3.0 | 51.9 | 6.7 | 114 | 7.9 | 624.4/605 |
| PKS 0420-01 | RL | 1.750.07 | 2.85 | 7.96 | 0.2 | 0.0 | 175.7/164 | |||
| PKS 0438-436 | RL | 1.630.13 | 1.46 | 38.7 | 22.3 | 3.4 | 0.0 | 123.2/110 | ||
| PKS 0440-285 | RL | 1.610.07 | 1.27 | 16.1 | 1.4 | 1.9 | 202.63/176 | |||
| X 0443-282 | RL | 2.040.13 | 7.69 | 0.22 | 0.0 | 2.9 | 177.9/190 | |||
| E 0449-183 | RQ | 1.640.06 | 1.25 | 0.436 | 0.0 | 0.0 | 161.9/186 | |||
| PKS 0528+134 | RL | 1.640.06 | 3.81 | 49.1 | 42.0 | 23.1 | 2.33 | 119 | 4.1 | 289.7/260 |
| PKS 0537-286 | RL | 1.470.08 | 2.04 | 49.1 | 14.5 | 3.0 | 1.4 | 152.8/163 | ||
| PKS 0558-504 | RL | 2.200.07 | 29.9 | 1.19 | 0.0 | 7.5 | 61 | 4.8 | 1254.6/1229 | |
| S5 0836+715 | RL | 1.410.03 | 18.5 | 216 | 9.0 | 40.5 | 2.6 | 567.5/633 | ||
| 3C 215.0 | RL | 1.860.03 | 3.46 | 1.72 | 0.0 | 1.8 | 90 | 2.5 | 411.6/410 | |
| IRAS 0910+410 | RQ | 1.910.06 | 2.72 | 1.78 | 4.07 | 29.3 | 8.18 | 500 | 17.5 | 452.9/379 |
| HE 1029-1401g | RQ | 1.83 | 30.9 | 0.620 | 0.0 | 15.7 | 97 | 12.7 | 1251.7/1327 | |
| Q 1101-264 | RQ | 1.840.24 | 0.40 | 6.26 | 0.7 | 0.0 | 34.1/50 | |||
| HE 1104-285 | RQ | 2.100.09 | 1.1 | 22.8 | 18.1 | 8.2 | 0.0 | 205.5/199 | ||
| PG 1114+445 | RQ | 1.710.06 | 3.09 | 0.228 | 6.7 | 209.3 | 3.81 | 137 | 8.2 | 578.4/583 |
| PG 1116+215 | RQ | 2.090.05 | 8.12 | 0.658 | 0.43 | 5.6 | 10.4 | 274 | 9.9 | 382.6/405 |
| PG 1148+549 | RQ | 1.880.10 | 0.45 | 1.33 | 0.0 | 0.0 | 109.7/103 | |||
| PG 1211+143 | RQ | 2.060.05 | 7.01 | 0.113 | 0.0 | 7.44g | 233 | 9.4 | 846.6/759 | |
| PG 1216+069 | RQ | 1.570.09 | 3.59 | 1.13 | 0.0 | 2.87 | 0.0 | 234.6/227 | ||
| Mrk 205 | RQ | 2.130.03 | 15.4 | 0.184 | 0.25 | 11.8 | 12.2 | 157 | 6.5 | 986/854 |
| 3C 273 | RL | 1.550.01 | 230 | 17.9 | 0.38 | 157.5 | 30.3 | 32 | 8.3 | 2034/2030 |
| PG 1247+268 | RQ | 1.830.09 | 0.64 | 9.21 | 0.0 | 0.0 | 234.6/227 | |||
| MS 1248+5706 | RQ | |||||||||
| 3C 279 | RL | 1.830.02 | 11.6 | 10.3 | 0.52 | 19.0 | 0.0 | 997.4/1018 | ||
| B2 1308+326 | RL | 1.850.14 | 0.97 | 3.10 | 3.7 | 3.4 | 0.8 | 208.2/163 | ||
| IRAS 13349+2438g | RQ | 2.360.05 | 12.15 | 0.285 | 0.78 | 27.6 | 8.75 | 205 | 5.6 | 531.7/607 |
| RD J13434+0001 | RQ | 1.90.4 | 0.17 | 3.96 | 48 | 4.7 | 0.38 | 432 | 2.0 | 15.0/21 |
| PG 1404+226g | RQ | 1.770.15 | 1.5 | 0.02 | 0.0 | 3.11 | 604 | 4.6 | 160.2/175 | |
| PG 1407+265 | RQ | 2.030.04 | 2.57 | 7.52 | 0.61 | 3.0 | 0.0 | 484.5/480 | ||
| PG 1416-129 | RQ | 1.780.02 | 14.1 | 0.682 | 0.0 | 12.5 | 140 | 8.1 | 650.5/636 | |
| B 1422+231 | RL | 1.680.14 | 1.05 | 35.5 | 1.0 | 0.0 | 87.04/75 | |||
| PG 1425+267 | RL | 1.720.07 | 3.15 | 1.40 | 3.2 | 56.8 | 2.83 | 124 | 6.1 | 460.6/399 |
| Mrk 478g | RQ | 1.980.03 | 5.75 | 0.077 | 0.66 | 5.9 | 5.36 | 191 | 5.4 | 597.7/541 |
| Q 1508+571 | RL | 1.430.08 | 1.03 | 40.2 | 1.0 | 0.0 | 169.9/175 | |||
| PKS 1510-089 | RL | 1.290.05 | 10.1 | 4.29 | 1.8 | 6.69 | 88 | 4.9 | 547.1/540 | |
| Q 1559+089 | RQ | 1.920.41 | 0.20 | 3.6 | 0.0 | 0.0 | 20.96/22 | |||
| Table 2 continued | ||||||||||
| Quasar | Radio | Continuuma | N | c | Line Fluxd | EQW | e | |||
| Name | Class | Flux | L2-10 | |||||||
| PKS 1614+051 | RL | 1.430.14 | 0.350 | 9.41 | 0.0 | 0.0 | 36.9/41 | |||
| 4C 38.41 | RL | 1.600.19 | 1.69 | 17.0 | 11.3 | 3.5 | 0.0 | 38.8/51 | ||
| PG 1634+706 | RQ | 1.890.04 | 1.55 | 9.64 | 0.0 | 0.0 | 294.9/276 | |||
| PG 1718+481 | RL | 1.940.04 | 2.07 | 7.93 | 0.0 | 0.0 | 269.5/300 | |||
| QSO 1725+503 | RQ | |||||||||
| PDS 456h | RQ | 1.500.05 | 4.19 | 0.53 | 4.11 | 16.1 | 0.0 | 499.1/534 | ||
| Q 1745+624 | RL | 1.570.12 | 0.750 | 27.5 | 1.8 | 0.0 | 74.16/78 | |||
| E 1821+643 | RQ | 1.900.01 | 23.4 | 5.98 | 0.0 | 22.8 | 167 | 30.8 | 1267/1266 | |
| HS 1946+765 | RQ | 1.800.37 | 0.25 | 5.26 | 1.4 | 0.0 | 37/34 | |||
| PKS 2000-330 | RL | 1.780.12 | 0.936 | 36.0 | 26 | 3.4 | 0.0 | 157.8/138 | ||
| 3C 411.0 | RL | 1.640.10 | 1.15 | 0.74 | 0.0 | 0.3 | 80.3/79 | |||
| 4C 74.26 | RL | 2.110.09 | 28.7 | 1.02 | 2.18 | 322.9 | 12.1 | 54 | 5.1 | 1211.0/1175 |
| PKS 2126-158 | RL | 1.580.07 | 7.97 | 253 | 14.8 | 12.5 | 0.0 | 232.3/250 | ||
| PKS 2149-306 | RL | 1.490.04 | 14.05 | 203 | 6.3 | 35.0 | 0.0 | 634.2/621 | ||
| PHL 5200 | RQ | 1.050.30 | 0.43 | 3.45 | 8.6/10 | |||||
| CTA 102 | RL | 1.460.06 | 4.04 | 13.3 | 2.8 | 4.1 | 0.0 | 194.0/206 | ||
| PKS 2251+113 | RL | 0.950.24 | 1.65 | 0.55 | 2.0 | 0.0 | 139.1/106 | |||
| MR 2251-178 | RQ | 1.710.04 | 67.8 | 0.915 | 0.0 | 29.9 | 79 | 5.2 | 824.3/890 | |
The results from the spectral fitting are presented in table 2. The flux is given over the range 0.5 keV to 10 keV (in the observed ASCA frame and extrapolated where necessary), with luminosity quoted from 2-10 keV (corrected for absorption) in the quasar rest-frame. The value quoted for is the measured value of intrinsic absorption in the quasar rest frame, in excess of any Galactic absorption. The equivalent width (EQW) and flux of the iron fluorescence line are given, with the EQW being in the quasar rest frame. The line parameters are those corresponding to a narrow line ( keV); the line energy is included as a free parameter in the model fit unless otherwise stated in the table. Note also that the photon indices are those of the underlying power-law continuum, with spectral features such as low energy absorption (cold or ionised), soft X-ray excess, iron line emission or Compton reflection, taken into account where these features are significant. When the fitted spectrum is particularly complex, the 2-10 keV band index has been used. However in most cases there is little difference between the underlying 0.6-10 keV index and the 2-10 keV index. All errors in the table are quoted at 68% confidence, for the appropriate number of interesting parameters.
For each quasar the best fitting value for reduced chi-squared (/degrees of freedom) is given. The values of quoted in table 2 are for adding an additional spectral feature to the fit, such as an intrinsic absorption column or Fe line. For adding an absorption column, 1 additional parameter is added to the fit and for an iron line, 1 or 2 parameters are added, depending on whether the line energy is fixed at 6.4 keV or not (i.e. the line normalization and line energy). As a rough guide, corresponds to 90% significance for the addition of 1 interesting parameter, with corresponding to 90% significance for 2 additional interesting parameters. Only measurements of and the iron line which are at 90% significance or better have been quoted as best fit values in table 3.2; otherwise upper-limits only are quoted.
F-tests have also been performed (see Bevington & Robinson 1992), both on the intrinsic absorption and the iron line, to test the significance of these features. If the value obtained for F , for the addition of 1 extra interesting parameter, then the result has significance greater than 90%. This is used as a criterion for including line or absorption features in the spectral fitting. Actual spectral features such as an Fe line or an absorption column are only regarded as significant if these F-test criteria are met.
4 The X-ray Continuum Emission from Quasars
4.1 General Properties
The X-ray emission in the sample covers a wide range of photon index, from hard (e.g. PKS 2251+113, ) to soft (e.g. IZWI, ). The distribution of 2-10 photon index for the quasars in the sample is illustrated in figure 2 (plotted against radio-loudness). However the X-ray emission from the majority of quasars lies in the region from . The mean photon index for all 62 quasars is , with a measured sample dispersion (1) of . Compared with typical measurement errors of the order to 0.10, this shows that the dispersion in the X-ray continuum emission of quasars is significant.
Spearman-Rank correlations have therefore been performed on the photon index (), for the 62 quasars. The strongest correlation present is a negative trend between and radio-loudness RL, which is significant at 99.99% confidence (see figure 2), confirming the results found previously (e.g. Wilkes & Elvis 1987). The X-ray photon index is also observed to decrease with X-ray luminosity LX (measured in the 2-10 keV band, QSO rest frame) and the quasar redshift z. However these correlations are of weaker significance (at 99.7% and 95.2% confidence respectively) and probably result from the strong correlation between and RL. Indeed a partial S-R test performed on the data confirms that the trend between and RL is the significant correlation present. In addition RL and LX are strongly correlated (99.99%), in the sense that the most radio-loud objects tend to be more X-ray luminous. These correlations are therefore consistent with the increasing importance of the jet, in the more core-dominated radio-loud quasars, due to Doppler boosting, which may account for the flatter X-ray slopes and enhance the luminosity of the RLQs as a whole.

4.2 The Radio-Quiet sub-sample
We have calculated that the mean photon index for the radio-quiet quasars in this sample is , with a significant dispersion of . This is consistent with the mean 2-10 keV index found from an optically selected sample of PG quasars (George et al. 2000). Given this dispersion, correlations within just the radio-quiet sub-sample have been investigated, excluding all the radio-loud objects. The motivation for this is that it is possible to discount any effects from a relativistic jet, and hence just learn about the properties of the quasar central engine. No significant correlations were found between and either LX or z for the 27 radio-quiet quasars in the sample. Note that the spectral indices were taken over the 2-10 keV band, in the quasar rest-frame.
Thus to extend the range of luminosity present, we next include the Seyfert 1s published in the Nandra et al. (1997) sample; the luminosity range covered then extends from LX 1041 erg/s for the least luminous Seyfert 1 to LX 1047 ergs/s for the most luminous quasars. However it was found that there was still no significant correlation between the X-ray photon index with either luminosity or redshift. This is in contrast to the results of the Reeves et al. (1997) paper, which found a positive correlation between and LX, but which only considered a small sample of 9 radio-quiet quasars. Thus this suggests that there is little evolution in the underlying X-ray emission from radio-quiet quasars with either luminosity or redshift, over a wide range of luminosities and therefore presumably black hole masses. We have also carried out a direct comparison between our sample of radio-quiet quasars and the sample of Seyfert 1s analysed by Nandra et al. (1997). It is found that the mean slope for the radio-quiet quasars () is almost identical to the mean Seyfert 1 slope (i.e. ). This also suggests that there is little difference in the underlying X-ray emission between the Seyfert 1s and the radio-quiet quasars.
4.3 The Radio-Loud sub-sample
The radio-loud quasar sub-sample has a mean index of and dispersion . Thus the difference in spectral slope between the RLQs and RQQs is significant at 99% confidence. We also checked for any correlation involving within just the radio-loud sub-sample. No significant correlations were found for this sub-sample at the 99% confidence level.
4.4 On The Correlation between and H FWHM
What is interesting is that significant dispersion in is present in our sample within the radio-quiet quasar class alone, that cannot be attributed to the properties of the radio-jet and does not seem dependent on the object luminosity (see above). Therefore the radio-quiet sample was split up into broad and narrow line objects (i.e. from the widths of the permitted optical lines, such as H), whereby the narrow line objects are defined to have H FWHM km/s (e.g. Osterbrock & Pogge 1985). This gives a sample of 8 ‘narrow-lined’ QSOs. It is found that the sample of 8 narrow-line QSOs have 2-10 keV spectra that are significantly steeper () than the other normal broad-lined radio-quiet QSOs (). This is analogous to the difference between narrow and broad-line Seyfert 1s found previously in the 2-10 band (e.g. Brandt et al. 1997, Vaughan et al. 1999), and also in soft X-rays (Laor et al. 1997). Additionally most of the narrow line QSOs have strong soft excesses apparent in their spectra (see later).

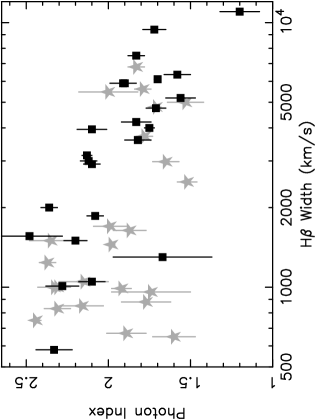
So to investigate this trend further, we performed Spearman-rank correlations between and H FWHM on all the radio-quiet quasars in this sample with known H widths (21 objects). The correlation was performed using the 2-10 keV photon indicies, fitted in the quasar rest-frame. It was found that the photon index for quasars increases with decreasing H width; this yields a correlation coefficient of r=-0.61, significant at the 99.4% confidence level for our 21 radio-quiet quasars. In order to extend the number of objects and also to increase the range of luminosity, we next include both the broad and narrow-lined Seyferts from the samples of Nandra et al. (1997) and Vaughan et al. (1999). The total sample of objects have subsequently been split into 2 bins consisting of (i) low luminosity AGN (24 objects, L erg/s) and (ii) high luminosity quasars (25 objects, L erg/s). The results of the Spearman-Rank analysis is summarised in table 3 and the correlation is plotted in figure 4.
Firstly for all of the 49 radio-quiet objects, we find a strong negative correlation between and H at significance, consistent with the results found in previous samples (e.g. Boller, Brandt & Fink 1996, Brandt et al. 1997, Leighly 1999). Interestingly when the 2 different luminosity sub-samples are used, a significant correlation is not found within the low luminosity bin, but a strong correlation is found for the high luminosity objects (at 99.9% significance). There does not seem an obvious reason to explain the lack of a correlation at low luminosites, this may just be a selection effect. Also note that the flattest radio-quiet quasar in this sample (PHL 909, with ) also has the widest H line profile (FWHM = 11000 km/s) of all the objects considered. However the removal of PHL 909 makes no difference to any of the correlations. The important finding here is that the apparent correlation between and H FWHM, found previously in low luminosity samples of Seyfert galaxies, appears to extend to higher luminosities and hence the quasars in this sample. Thus in this sample the ‘narrow-line’ quasars tend to have steeper underlying (2-10 keV) X-ray spectra than the more common broad-lined quasars.
| Sample | No. of Objects | Coeffa | Probb |
|---|---|---|---|
| This Samplec | 21 | -0.646 | 99.6% |
| Low Luminosityd+e | 24 | -0.332 | 87.8% |
| High Luminosityd+f | 25 | -0.723 | % |
| All Objectsd+g | 49 | -0.522 | % |
So a tempting hypothesis exists that can explain the dispersion in quasar spectral slope, whereby the photon index is negatively correlated with H FWHM. One explanation already postulated is that these softer ‘narrow-line’ objects are accreting at a higher fraction of the Eddington-limit, which leads to greater Compton-cooling of the hard X-ray emitting corona (Pounds, Done & Osborne 1995, Laor et al. 1997). This can naturally account for the steep hard X-ray power-law and strong soft excesses (associated with the disk) generally observed in this class of object. The other interesting finding in the last section was the lack of a correlation between the photon index and the X-ray luminosity, for the radio-quiet quasar sub-sample. The implication here is that the underlying X-ray emission from radio-quiet AGN does not depend on the black hole mass (hence the null correlation between and luminosity). Instead the important factor may be the fractional accretion rate (), i.e. the ratio of the black hole mass accretion rate to the Eddington-limited rate. Thus the underlying X-ray spectra could depend on the fractional accretion rate , whereby the objects with steeper X-ray spectra are accreting at a higher fraction of the Eddington limit.
5 The Soft X-ray Excess
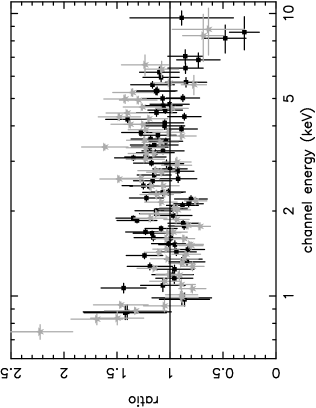
We have searched systematically for a soft excess in the spectra of all the low redshift quasars in this sample. Firstly the spectra were fitted in the harder 2-10 keV band, and then the spectra were extrapolated back to 0.6 keV (or 0.8 keV for the GIS) to see if there was any spectral curvature at lower energies. An excess of counts below 2 keV, above that of the hard power-law continuum, indicates the presence of a ‘soft excess’. In this case we have added a blackbody component (in addition to the power-law and other spectral components - such as an iron line) to parameterize the soft excess emission and have subsequently re-fitted the spectrum. The results of this fitting are shown in table 4. The strength of the soft excess is given by the parameter R, which represents the ratio of the blackbody to power-law component in the 0.6-2 keV range; also given are the temperature of the blackbody kT (units eV) and the improvement () in the spectral fit from adding the blackbody component to the previous best-fit model (2 additional free parameters). Note that we have restricted this fitting procedure to objects of redshift z0.3, as at higher redshifts the soft excess will be shifted out of the ASCA bandpass.
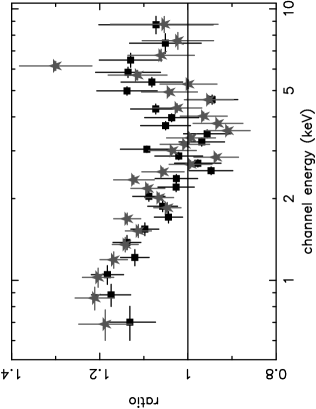
The table shows that some soft excess emission is significant in 9 quasars, approximately half of the low z (z0.3) objects. This soft X-ray emission is illustrated in figure 5, which shows the data-model ratio residuals to power-law fits in 2 objects, the broad-line QSO HE 1029-1401 and the narrow-line object Markarian 478. In one object (HE 1029-1401) there is only a gradual curvature of the spectrum below 2 keV, whereas the soft excess in Mrk 478 rises sharply above the power-law continuum. Interestingly the majority of the soft excess emission occurs in the narrow-line quasars (6 objects: TON S180, NAB 0205+0204, PKS 0558-504, PG 1211+143, PG 1404+226, Mrk 478), with soft excesses only apparent in 3 broad-line quasars. This would indicate that soft excesses are more common in the narrow-line objects, which may be expected if these objects indeed accrete at a higher rate for a given black hole mass (e.g. Ross, Fabian & Mineshinge 1992). Only one of the nine objects is radio-loud (PKS 0558-504).
The interesting question to ask here is what is the origin of the soft X-ray excess emission? The standard explanation is that it results from thermal emission that originates directly from the hot inner accretion disk (Malkan & Sargent 1982) and hence is the high energy tail of the so-called ‘Big Blue Bump’. The temperature of this soft excess component for the objects in this sample varies between 100 and 300 eV. In some cases, such as in the narrow-line objects PG 1404+226 and Markarian 478, the soft excess is quite steep, with temperature eV, perhaps consistent with emission from the disk for such objects. In particular the soft excess of PG 1404 is very strong, energetically dominating the X-ray power-law component; this does seem to suggest that the soft excess in PG 1404+226 is a primary emission component and probably does originate directly as thermal emission from the accretion disk.
However other cases may not be so straightforward. For instance the soft excess in the quasar HE 1029-1401 has a blackbody temperature of 300 eV and it is likely that temperatures of this order are perhaps too hot to result directly from the quasar accretion disk. Note that in a typical quasar, with a central black hole mass of M⊙, temperatures of eV would be expected, implying that the observed soft excesses in many objects are probably too hot to be the direct emission from the putative disk. Furthermore the temperature of the disk component varies as M and hence is expected to be cooler for the more luminous objects with larger black hole masses.
Nevertheless it is plausible that some degree of Comptonisation by electrons in a hot corona could upscatter cooler EUV photons from the disk to soft X-ray energies and account for the observed emission. Another possibility is that in some objects the soft X-ray emission results from reprocessing of the hard X-ray power-law, for instance through reflection and scattering of X-rays off the optically thick disk (e.g. George & Fabian 1991). Reflection will become increasingly important at soft X-ray energies as the accretion rate increases towards the Eddington limit (e.g, Ross & Fabian 1993). As the accretion rate rises, progressively heavier elements become fully ionised and the disk becomes more reflective at soft X-ray energies, which can produce a steepening of the X-ray spectrum. Furthermore ionised emission lines can be produced from abundant elements such as O, Ne and Mg, which could also contribute towards the X-ray flux near to 1 keV. Tentative evidence for this is present in 2 narrow-line objects; in Ark 564 (Vaughan et al. 1999b) an ionised reflection component contributes significantly to the X-ray flux below 2 keV, whilst in the narrow-line QSO TON S180, Turner et al. (1998) report evidence for an emission-like feature at 1 keV. We also note that some of the quasars in this sample (for instance TON S180, HE 1029-1401, PKS 0558-504) may exhibit ionised iron K emission lines (see section 6), which could provide further support of this hypothesis.
| Quasar | LBB/LPLa | kTb | c |
|---|---|---|---|
| PHL 909 | 0.36 | 34050 | 6.4 |
| TON S180 | 0.23 | 1535 | 117.8 |
| NAB 0205+024 | 0.11 | 20025 | 27.5 |
| PKS 0558-504 | 0.12 | 20620 | 37.2 |
| HE 1029-1401 | 0.15 | 31025 | 59.0 |
| PG 1211+143 | 0.09 | 12510 | 54.0 |
| PG 1404+226 | 2.9 | 14410 | 240 |
| PG 1416-129 | 0.19 | 30732 | 9.5 |
| Markarian 478 | 0.27 | 1077 | 58.9 |
6 The Iron K Fluorescence Line
6.1 General Properties
Table 5 shows the list of quasars for which Fe fluorescence line emission was found to be significant (i.e. at the 90% level or better). The spectral fitting of the iron K lines was carried out where possible over the 2-10 keV ASCA energy range. The line parameters are first shown for a narrow line ( keV), with energy fixed at 6.4 keV, and then again for a narrow line but with the line energy as a free parameter in the fit. We have also considered broad line fine fits, where the intrinsic velocity width of the line is a extra free parameter. However the constraints on the line width is poor in most of the objects and so this is not considered further. The line parameters have all been fitted in the quasar rest frame, i.e. corrected for redshift effects.
| Narrow line fixed at 6.4 keV | Narrow lines, line energy free parameter | ||||||||||
| Object | EQWa | Fluxb | c | F-prob | Line Energye | EQWa | Fluxb | c | F-prob | d | F-prob |
| IZwI | 271 | 7.36 | 8.2 | 95.6% | 6.77 | 483 | 12.0 | 11.9 | 99.7% | 3.7 | 94.6% |
| PHL 909 | 158 | 5.25 | 4.5 | 96.2% | 6.40 | ||||||
| TON S180 | 96 | 3.8 | 4.9 | 97.3% | 6.65 | 123 | 5.0 | 8.2 | 98.3% | 4.3 | 96.1% |
| 3C 109.0 | 0.3 | 41.0% | 6.78 | 114 | 6.7 | 7.9 | 98.3% | 7.6 | 99.3% | ||
| PKS 0528+134 | 119 | 2.33 | 4.6 | 95.8% | 6.32 | ||||||
| PKS 0558-504 | 0.0 | 0% | 6.66 | 61 | 7.5 | 4.8 | 91.3% | 4.8 | 97.0% | ||
| HE 1029-1401 | 60 | 10.1 | 6.8 | 99.3% | 6.62 | 97 | 15.7 | 12.7 | 99.7% | 5.9 | 98.7% |
| PG 1114+445 | 125 | 3.5 | 7.2 | 99.3% | 6.43 | 137 | 3.81 | 8.2 | 98.3% | 1.0 | 68.4% |
| PG 1116+215 | 145 | 6.0 | 4.3 | 96.7% | 6.76 | 274 | 10.4 | 9.9 | 99.0% | 5.6 | 98.5% |
| PG 1211+143 | 233 | 7.4 | 9.4 | 99.8% | 6.41 | ||||||
| Mrk 205 | 123 | 9.6 | 5.2 | 97.7% | 6.37 | 157 | 12.2 | 6.5 | 96.1% | 1.3 | 74.6% |
| 3C 273g | 16 | 27.0 | 3.0 | 91.6% | 6.64 | 32 | 54.0 | 8.3 | 98.4% | 5.3 | 97.8% |
| IRAS 1334+243 | 0.4 | 50.1% | 6.76 | 205 | 8.7 | 5.6 | 91.3% | 5.2 | 98.5% | ||
| PG 1404+226 | 604 | 3.11 | 4.6 | 97.5% | 6.2 | ||||||
| PG 1416-129 | 119 | 10.9 | 6.5 | 98.9% | 6.54 | 140 | 12.5 | 8.1 | 98.3% | 1.4 | 76.1% |
| PG 1425+267 | 113 | 2.6 | 5.0 | 96.2% | 6.36 | 124 | 2.8 | 6.1 | 97.0% | 1.1 | 67.1% |
| Mrk 478 | 183 | 5.1 | 5.6 | 97.5% | 6.37 | 191 | 5.4 | 5.9 | 97.0% | 0.3 | 40.0% |
| PKS 1510-089 | 0.4 | 47.0% | 6.92 | 88 | 6.7 | 4.9 | 91.6% | 4.5 | 96.5% | ||
| E 1821+643 | 88 | 11.7 | 12.6 | % | 6.61 | 167 | 22.8 | 30.8 | % | 18.2 | % |
| 4C 74.26 | 54 | 12.1 | 5.1 | 97.4% | 6.4 | ||||||
| MR 2251-178 | 0.0 | 0.0% | 6.57 | 7952 | 37.3 | 5.2 | 90.9% | 5.2 | 98.2% | ||
The F-test and F-distribution (Bevington & Robinson 1992) were used to test the significance level of any line features, the results of which are also shown in the table. The change in for a fit with narrow line fixed at 6.4 keV, compared with a fit with no Fe line, is quoted along with the associated probability from performing an F-test with 1 additional parameter. Then the fit to a narrow line with the line energy free is compared to one with no lines, the values for both and the F-test probability (for 2 additional parameters; the line normalisation and the line energy) are both quoted. Also quoted is the additional probability (and ) for freeing the line energy in the fit; i.e. the fit to a line with free energy is compared with a line fixed at 6.4 keV. This then can be used as a measure of whether the line energy is significantly different to the neutral value of 6.4 keV. Line emission is deemed significant if the F-test probability is 90%; in some cases lines are not significant at 6.4 keV, but are when the line energy is free to vary, indicating that the emitted line energy is different to 6.4 keV.
Iron line emission has been detected in 21 out of the final 62 objects in the sample. There is a large spread in the best-fit value of line equivalent width (EQW), ranging from 32eV for 3C 273 up to 400eV for the radio-quiet objects IZwI and PG 1404+226, although the main peak of quasars with detected emission between 50 and 200eV is apparently consistent with Compton reflection origins (e.g. George & Fabian 1991). In the case of the radio-quiet quasars there is evidence of Fe K line features, with 14 out of 27 objects showing evidence for line emission above the 90% confidence level. At the 99% (or better) confidence level, Fe K emission lines are detected in IZwI, TON S180, HE 1029-1401, PG 1114+445, PG 1116+215, PG 1211+143, Mrk 205 and E 1821+643. Interestingly lines are not detected in the most luminous (L ergs/s) of the radio-quiet quasars at higher redshifts; in particular PG 1634+706 (35eV), HE 1104-285 (53eV), PG 1407+265 (EQW70eV) and PG 1718+481 (88eV).
In contrast to the radio-quiet quasars, significant line emission has been detected in only 7 of the 35 radio-loud quasars. Generally, the line EQW found here is smaller than that for the radio-quiet objects, with EQW100eV in many cases. Where no line emission has been detected, tight upper limits have been placed on the objects in several cases. For example, the blazars 3C 279 and CTA 102 have line EQWs 28eV and 32eV respectively, whilst the distant radio-loud quasars PKS 2126-158 and PKS 2149-306 also have tight limits of 32eV and 22eV respectively. Most of these quasars with low upper-limits on the line EQW are core-dominated quasars.

As a whole we find that the mean line equivalent width (detections only, narrow line fits) in the RQQs is eV, whereas for RLQs the mean is eV. This suggests that the amount of iron line emission is weaker in the radio-loud objects. To investigate this further we performed a Spearman-rank correlation (using survival statistics - see Isobe, Feigelson & Neilson 1986), which showed that the line EQW (for narrow lines) decreases with quasar radio-loudness at 99.99% confidence. This trend is also illustrated in figure 6, the mean iron line EQW (including upper limits) has been plotted against radio-loudness, with the quasars split up into different bins for RL. As a whole Fe lines are detected in the radio-quiet objects, but not in the radio-loud quasars. The simple interpretation of this trend is that the Fe emission diminishes as the jet angle approaches the line of sight. Thus the increased Doppler boosting of the X-ray continuum in relation to the line, weakens the relative strength of the disk reflection component in core-dominated RLQs.
We have also investigated any trends in the line emission for the radio-quiet objects, excluding the radio-loud quasars. This negates the effect that the powerful relativistic jet has on any of the correlations. In order to extend the range in luminosity, we include the 18 Seyfert 1s from the Nandra et al. (1997) sample, as well as our own 27 RQQs. A Spearman-rank analysis shows that the line EQW is negatively correlated with X-ray luminosity at 99.98% confidence, even when only the radio-quiet AGN are considered. This correlation confirms the ‘X-ray Baldwin effect’ that was found previously from Ginga (Iwasawa & Taniguchi 1993), and also ASCA data (Nandra et al. 1997b). Thus the Fe line emission appears to be absent in the most luminous of AGN, regardless of whether they are radio-loud or quiet.
6.2 Iron Line Energy
Overall it is found that in 11 out of 21 of the quasars that show Fe K line emission, the line emission is at rest energies 6.4 keV at 90% confidence or better. Thus in at least half of the quasars in the sample, the line originates from matter that is partly ionised. For the RQQs, 7 objects have partially ionised Fe K line emission; these are IZwI, TON S180, HE 1029-1401, PG 1116+215, IRAS 13349+2438, E 1821+643 and MR 2251-178. For the radio-loud quasars, 3C 109.0, PKS 0558-504, 3C 273 and PKS 1510-089 appear to have Fe lines that originate from partially ionised material.
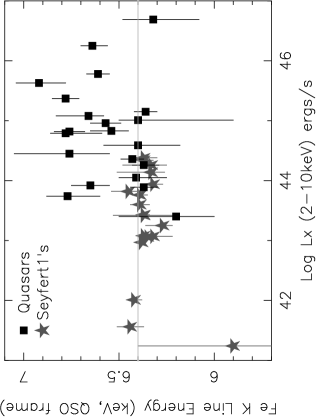
The overall range of line energy, from 6.4 keV to 6.9 keV, represents emission from a variety of ionisation states from neutral iron (Fe i to Fe xvi at 6.4 keV) up to helium or even hydrogen-like iron (Fe xxv at 6.68 keV, Fe xxvi at 6.96 keV). This is in contrast to the line properties of lower luminosity AGN such as Seyfert1 galaxies, where the Fe K emission normally originates from neutral iron, with the line energies closely distributed near to 6.3-6.4 keV (Nandra et al. 1997). For instance the mean line energy of the Nandra et al. (1997) sample of Seyfert 1 galaxies is keV, whereas for our quasar sample the mean line energy is 6.62 keV. A Spearman-rank correlation also shows that the line energy increases with object luminosity at 99.9% significance (also see figure 7), again providing strong confirmation of the Nandra et al. (1997b) result whereby the iron lines in high luminosity sources tend be weaker and shifted bluewards of 6.4 keV.
6.3 The Compton Reflection Hump
Having ascertained that there is substantial iron line emission from several of the quasars in this sample, we next determine the properties of the Compton reflection hump that would be expected to accompany the line, on the assumption that the line results from reflection off optically thick matter. Constraints have therefore been placed on the amount of Compton reflection that occurs in the spectra of quasars in this sample. This is particularly important because if the iron lines that are described above result from the accretion disk, then we would expect to see evidence for a reflection ‘hump’ in the spectra of quasars. To test this, a Compton reflection model has been used (the pexrav code in XSPEC, Magdziarz & Zdziarski 1995) with solar abundances, a disk inclination angle of 30 degrees has been assumed (unless otherwise stated) and an exponential cut-off at keV. The strength of the reflection component (R) is measured in terms of the solid angle subtended by the primary X-ray source to the disk; then R is then given by R . Although R is left as a free parameter in the spectral fitting, normally for a geometrically thin disk a value of R near to 1 would be expected. The model also used assumes that the ‘reflecting’ material (in this case presumably the accretion disk) is of a neutral or low ionisation state.
| Quasar | Type | z | Log LXa | R(=)b | 90% ULc | d |
|---|---|---|---|---|---|---|
| S5 0014+813 | RL | 3.41 | 47.0 | +133.2 | ||
| NRAO 140 | RL | 1.258 | 46.76 | +147.5 | ||
| S5 0836+716 | RL | 2.17 | 47.3 | +162.4 | ||
| HE 1104-1805 | RQ | 2.319 | 46.4 | +21.3 | ||
| 3C 273 | RL | 0.158 | 46.25 | +57.2 | ||
| PG 1247+268 | RQ | 2.041 | 46.0 | – | +3.0 | |
| Q 1508+571 | RL | 4.3 | 46.6 | +16.3 | ||
| PG 1634+706 | RQ | 1.334 | 46.0 | +17.5 | ||
| PG 1718+481 | RQ | 1.084 | 45.9 | +26.0 | ||
| HS 1946+765 | RQ | 3.02 | 45.7 | – | +5.2 | |
| 4C 74.26 | RL | 0.104 | 45.0 | 3.01.4 | – | -39.5 |
| PKS 2126-158 | RL | 3.26 | 47.4 | +68.0 | ||
| PKS 2149-306 | RL | 2.345 | 47.3 | +175.5 |
The Compton reflection component was systematically fitted to the brightest quasars in the sample (both at low and high z), i.e. where the signal-to-noise ratio allows a sufficient constraint of these additional model parameters. The results are now presented here and are shown in table 6 for those quasars in which the reflection component has been constrained; the table either shows the best fitting value of the relative strength, R, of the reflection component or the statistical upper limit to R.
It can be seen that in the low redshift quasars it has generally not been possible to constrain the amount of reflection present in the X-ray spectra. The only low redshift quasars in which the amount of reflection has been constrained are in the radio-loud quasars 3C 273 and 4C 74.26. The 68% upper limit on the strength of the reflection component in 3C 273 is R (or R at 90% confidence). This result is perhaps not surprising as 3C 273 is a core dominated radio-loud quasar, the reflection component should be considerably diluted by the beaming effects of a relativistic jet. An unusually strong reflection component is found in the lobe-dominated radio-quasar 4C 74.26 (also see Brinkmann et al. 1998); however the presence of a strong soft excess (with temperature KT eV for a blackbody) could confuse the detection of this reflection component, given the limited ASCA bandpass. Constraints are not possible on the amount of reflection in the other low z objects.
However, unlike for low z quasars, in the high redshift quasars there is a greater band-pass in hard X-rays, as this ( keV) part of the spectrum is redshifted into the ASCA rest-frame. Therefore in the high redshift quasars, which have sufficient signal to noise, it should be possible to constrain the higher energy Compton reflection component. Firstly for the high redshift radio-loud quasars, it can be seen from the table that the reflection component is very weak or consistent with no reflection, with the relative strength of the component constrained to R . In fact the presence of a reflection component with R=1 (i.e. as would be expected from scattering of X-rays off an accretion disk) is excluded in all the distant radio-loud quasars considered here, at 99.99% confidence. Examples are S5 0014+813, NRAO 140, S5 0836+715, Q 1508+571, PKS 2126-158 and PKS 2149-306. However the lack of a reflection component in these bright radio-loud quasars is perhaps not surprising as many of these objects are believed to be jet-dominated AGN, where the Doppler boosted jet component can dominate over the reflection component from near to the central engine; this is also consistent with the weak iron lines that are observed in this class of object.
It has also been possible to constrain the amount of reflection in some of the high redshift (z ) radio-quiet quasars. In the luminous quasars PG 1634+706, PG 1718+481 and HE 1104-1805, the reflection component is constrained to R . The upper limits (90% confidence) on these 3 quasars are R , R and R respectively; in addition a reflection component in the high z QSO HS 1946+765 is also constrained to R . The presence of a reflection component with R=1 (as expected from an accretion disk), is excluded at 99.9% confidence in PG 1634+706, PG 1718+418 and HE 1104-1805. All 3 of these quasars are particularly luminous (with L erg/s and MV = -28 to -29, using q0=0.5); both PG 1634 and HE 1104 are radio-quiet (R and R respectively), and PG 1718 is radio-intermediate (R). Compton reflection has not been constrained in the other distant radio-quiet quasars (lack of signal-to-noise). However the evidence suggests that the amount of neutral reflection in highly luminous high redshift quasars is much weaker than what is observed in lower luminosity Seyfert 1 galaxies (e.g. Pounds et al. 1990 Nandra & Pounds 1994). As this trend is observed in the radio-quiet as well as the radio-loud quasars, the lack of reflection features in quasars cannot just be interpreted in terms of increased Doppler boosting from a relativistic jet. This, along with the above trends in the iron line emission, will be discussed in the next section.
6.4 The Nature of Iron lines and Disk Reflection in Quasars
The analysis performed in the above section show that properties of iron line emission and the associated reflection hump in quasars seem less straightforward than in the Seyfert 1s. As was explained earlier, the common picture in the Seyfert 1s is for the hard X-rays to scatter off the inner accretion disk, producing a broad iron K line, iron K edge and a Compton reflection hump. The fact that the line is highly broadened and fits the relativistic motions expected in the inner disk around a black hole (e.g. Tanaka et al. 1995), strongly supports the interpretation that these ‘reflection’ features originate from the accretion disk. In the Seyfert 1s, this reprocessing is almost completely from material that is neutral or of a low ionisation state (i.e. Fe i to Fe xvi).
However this is apparently not the case in quasars. It was found that of the 21 quasars in this sample with significant iron K line detections, a large proportion of these (at least 11) have iron line energies ( keV) that are consistent with originating from highly ionised material (e.g. Fe xxiv to Fe xxvi). In the high luminosity end of the quasar distribution (both radio-loud and radio-quiet), the actual strength of the iron K line component decreases considerably (i.e. from EQW eV to EQW eV), providing strong confirmation of the results in Nandra et al. (1997b). Additionally we also find that the strength of the neutral reflection hump is diminished considerably in the high luminosity quasars.
So how can one explain the observations in the quasars, which seem to contrast with the situation in the Seyfert 1 galaxies? Firstly the energy of the line emission in these quasars implies that the ionisation state of the reprocessing material (the surface layers of the putative accretion disk) is clearly much higher than in the Seyfert 1s. As has been pointed out from photoionsation modeling (e.g. see Ross & Fabian 1993; Matt, Fabian & Ross 1993; Ross, Fabian & Young 1999), the surface layers of such disks can become substantially photoionised as the fractional accretion rate () of the central engine increases. Perhaps at the Eddington limit very little if any iron K emission is seen, as the disk becomes fully ionised down to several Thomson depths.
This picture is consistent with the most luminous quasars (either radio-loud or radio-quiet), with very weak iron lines, accreting near the Eddington limit. Additionally, in the radio-loud objects, the relativistic jet can further weaken the line and reflection component. Furthermore this hypothesis can also explain the apparent lack of a reflection hump from neutral material in the high z quasars, found in section 6.3. Indeed it has been postulated (Ross, Fabian & Young 1999), that the disk becomes more reflective in high luminosity quasars (as the photoelectric opacity below Fe K decreases at higher ionisation) which can reproduce the apparently featureless spectra of some high z quasars. The lack of contrast between the continuum and the reprocessed X-rays can then explain the apparent absence of a reflection ‘hump’. Further support for the presence of a highly ionised accretion disk in one object comes from an observation ( with ASCA and RXTE) of the luminous quasar PDS 456. Although the line emission is fairly weak, a deep, highly ionised edge (at 8.7 keV) is present in the spectrum of this quasar. This iron K edge could originate from a high ionisation reflector. The detailed spectral fitting of this quasar, from simultaneous ASCA and RXTE data, is discussed in a separate paper (Reeves et al. 2000).
7 X-ray Absorption in Quasars
7.1 General Properties
The intrinsic neutral column densities for the 62 quasars analyzed are shown in table 2, fitted in the rest frame of the quasar. An additional Galactic absorption component was also fitted in the observers rest frame, as described previously. Unless an intrinsic absorption column is detected at 90% confidence (in addition to the Galactic absorption), an upper limit only has been quoted. Intrinsic absorption (at 90% significance) is present in 20 radio-loud quasars (RLQs) and 10 radio-quiet quasars (RQQs), i.e. 30 out of the 62 quasars.
The strongest absorption is seen in the most distant radio-loud quasars. Out of the 20 RLQs with significant intrinsic absorption, 9 of the 13 RLQs at z show evidence for absorption with in the order of 10. In particular, strong intrinsic absorption is seen in the distant radio-loud quasars S5 0014+813, PKS 0528+134, S5 0836+715, PKS 2126-158 and PKS 2149-306 all at 99.9% significance and columns of about or greater. The largest absorption column is seen in S5 0014+813, at red-shift z = 3.4, with a column density of () in the rest frame of the quasar (although note that the Galactic absorption towards S5 0014+813 is rather high).
Considering radio-loud quasars at intermediate redshifts (), 6 out of nine quasars also have evidence for absorption, but with lower columns than at high z, typically . However low z radio-loud quasars at redshifts z1 generally only show weak absorption (). Significant absorption is only seen in 5 out of 13 low z radio-loud quasars, these are 3C 109.0, 3C 273, 3C 279, PG 1425+267 and 4C 74.26. 3C 109.0 and 4C 74.26 are more lobe dominated than some of the other RLQs, which may imply some dependence on orientation; for these two objects . The columns towards 3C 273 and 3C 279 are both low with .
In comparison, significant absorption is also seen in only 10 radio-quiet quasars out of 27. At high redshifts (z ) there are only 2 radio-quiet quasars with statistically significant intrinsic absorption; HE 1104-285 (at z=2.319) has a column of at 99% significance, whilst RDJ 13434+0001 (at z=2.350) has an intrinsic column of although this is less well constrained. HE 1104-285 is unusual in that it is associated with a gravitational lens system (Wisotski et al. 1993), and RDJ13434+0001 may be a rare example of a type II QSO (Almaini et al. 1995). In the case of the low z RQQs, virtually all the objects are consistent with columns of , i.e. similar to Galactic sized columns.
7.2 The Warm Absorber
However there are some low z quasars which show evidence for absorption from warm (or partially ionised) matter. An example of this is the radio-quiet quasar PG 1114+445, which has a warm absorber with a column of typically to , with the main contribution from the ionised Ovii and Oviii edges. Similar results for PG 1114 were reported by George et al. (1997). Another low z warm absorber quasar similar to PG 1114+445 is MR 2251-178 (Reeves et al. 1997, Pan, Stewart & Pounds 1990). We also detect a significant ionised absorption component in the quasar IRAS 13349+243, this has been reported previously by Brandt et al. (1997b) who suggest that a dusty warm absorber is likely.
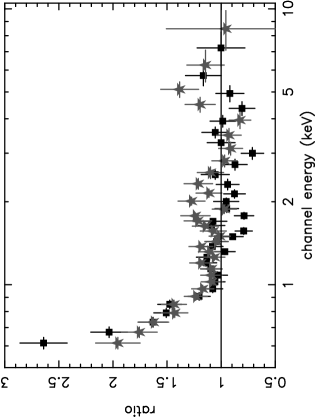
There are only 2 other quasars, not reported in the literature to date, with possible evidence for a warm absorber in this sample. One of these is the radio-loud quasar PG 1425+267 which has a warm absorber of column a few , although the detection is marginal statistically (95% confidence) and the ionisation () is rather poorly constrained. However perhaps the most interesting case is the luminous (M) nearby radio-quiet quasar PDS 456. The complex residuals to a power-law fit for this quasar are shown in figure 8. An iron K edge is present at 8.70.2 keV, and the optical depth of the edge is very large (). The edge is detected at 99.99% confidence (or for 2 interesting parameters). In addition we can also fit a low energy warm absorber component to PDS 456, with a high column of material () and ionisation parameter (). The spectrum of PDS 456 is discussed in detail in a separate paper (Reeves et al. 2000). The main interpretation of the fitting is that there is a warm absorber component at lower energies, but that a high ionisation disk reflector could be responsible for the deep iron K edge. There is no other evidence for the presence of such a strong iron K edge in any of the other quasars, although the constraints in many cases are quite poor.
On the whole in this sample there are only a few examples of warm absorbers in quasars. This is also supported by ROSAT PSPC observations of PG quasars (Laor et al. 1997), in which only about 5% have X-ray spectral features due to a warm absorber. George et al. (2000) also found relatively few warm absorbers in an ASCA sample of PG quasars. In contrast the occurrence of warm absorber features is common in the Seyfert 1s (e.g. Reynolds 1997, George et al. 1998). This may be due to the absorbing material being at a different level of ionisation in the quasars. For instance if such matter was very highly ionised, the material would be essentially transparent at Ovii and Oviii energies. Another possibility is that there is a lack of such material in quasars. However a more straightforward explanation may simply be due to quasar redshift, where the Ovii and Oviii features are red-shifted out of the ASCA bandpass.
7.3 On the correlation between X-ray absorption and redshift
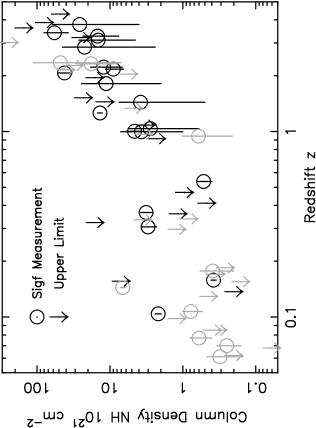
The observations that have been discussed in section 7.1 suggest that the amount of neutral X-ray absorption seems to be higher in the high z objects than in the low z quasars. We have therefore performed Spearman-rank correlations in order to investigate any apparent correlation between neutral and z. As in previous sections, the use of survival statistics has been employed in order to allow upper-limits to be used in the correlations. (Note that all quasars with flux levels erg cm-2 s-1 were excluded from these correlations, as useful constraints cannot be placed on the amount of absorption present.) A simple correlation between (fitted in the quasar frame - corrected from Galactic absorption) and z is significant at 99.99% confidence; thus the amount of absorption intrinsic to the quasar is seen to increase with redshift. This apparent trend has been reported previously, with smaller samples of objects (see Elvis et al. 1994, Cappi et al. 1997, Reeves et al. 1997, Fiore et al. 1998). Typically columns in high redshift (z2) quasars are of the order cm-2 (QSO frame), whereas at low redshift NH is only of the order few 1020cm-2. The positive correlation between and z is illustrated in figure 9.
It as has been reported (e.g. Cappi et al. 1997, Mukai 1998) the average neutral column in the SIS0 and SIS1 detectors tends to be overestimated by , due to uncertainties in the low energy calibration of these instruments. However it is also worth noting that a simultaneous Beppo-Sax and ASCA observation of 3C 273 showed that the SAX LECS and MECS instruments were in agreement with the ASCA SIS (Orr et al. 1998). Nevertheless, in order to take into account any possible calibration effect, an additional column of has been added to the spectral fit, in the local z=0 ASCA rest-frame, and the intrinsic columns have subsequently been refitted. Note that all SIS data below 0.6 keV have also been ignored, where the calibration problems tend to be worse. Despite of this, the correlation between and z was still found to be significant at 99.9% confidence. Excluding all those quasars that lie at low Galactic latitudes (), also has little effect on the significance level of the correlations.
By fitting the absorption in the quasar rest-frame it is possible that the amount of could be overestimated, as the absorbing material could lie anywhere along the line-of-sight to the quasars. Indeed if there was just some local effect that could produce some spurious measurement (such as SIS calibration or uncertainty in the Galactic column) then this would be magnified towards the quasars at higher z. Therefore the above correlations have also been performed by fitting the absorption column in the local z=0 frame (after correcting for the Galactic column). The correlation between and z is still found to be significant at % confidence even in this case. Again the calibration uncertainties of ASCA have been taken into account by adding an additional column of and by removing all quasars at low . However even after these checks were performed, the correlation remained significant. Thus the statistical evidence, even after accounting for calibration and uncertainties in the Galactic absorption, seems to suggest that the correlation between and z is real.
Therefore the most striking observation here is the discovery of moderately large absorption columns in several of the high z quasars. As these high z quasars are predominantly type I radio-loud AGN, obscuration in terms of the molecular torus (as observed in Seyfert 2s) seems unlikely. The physical origins of this absorption can then either be local to the rest frame of the quasars at high z, or it may be associated with matter at intermediate redshifts (i.e. from intervening line of sight material) not physically connected with the quasars. It is possible that the if the absorbing material is intrinsic to these quasars, then it could be similar in origin to the high ionisation absorbers observed in more nearby AGN. The most substantial source of soft X-ray absorption from intervening matter would probably be from damped Lyman- absorption systems, however the number density of these dense systems is reported to be quite low (O’Flaherty & Jakobsen 1997). A more detailed account of the possible origins of this X-ray absorption will not be discussed further in this paper, but can be found in the literature (e.g. Elvis et al. 1998, Cappi et al. 1997, Reeves et al. 1997, Elvis et al. 1994). However observations using the superior low energy throughput provided by XMM and Chandra are needed to confirm this trend, and to provide further clues as to the possible causes.
8 Summary & Conclusions
We now summarize the findings of this paper. In particular, comparison is drawn to our earlier paper (Reeves et al. 1997 or R97), which contained a smaller sample of quasars (24 objects compared with the current sample size of 62).
Firstly we confirm the following main results from the R97 paper:-
-
•
A decrease in the X-ray photon index, with radio-loudness, for all quasars.
-
•
A strong confirmation of the correlation between the neutral X-ray absorption column () and quasar redshift (z), in the sense that intrinsic increases with z. Furthermore in this sample, the correlation does not depend on any calibration effects nor the rest-frame of the absorbing column.
-
•
A decrease of iron K line equivalent width with increasing radio-loudness. The interpretation is that the strength of the reflection disk component (and therefore any contribution from the iron K line) is diminished, due to Doppler boosting of the X-ray continuum by the relativistic jet, in the core-dominated radio-loud quasars.
However we have seen several new effects and correlations in this paper, that were not reported in our previous R97 sample:-
-
•
In the R97 paper, a correlation was found whereby the photon index for the radio-quiet objects increased with X-ray luminosity. No such correlation was found in this paper, over a large range of both redshift and luminosity, for the radio-quiet sources. The difference may be due to the increase in sample size (from 9 radio-quiet quasars in R97 to 27 in the present paper).
-
•
Two correlations were found involving the iron K emission line. Firstly the strength of the iron K emission was observed to decrease with luminosity (i.e. an ‘X-ray Baldwin’ effect), regardless of whether the objects are radio-loud or radio-quiet. In addition the energy (or ionisation) of the iron line was found to increase with luminosity. Both of these trends confirm the result found in the Nandra et al. (1997b) paper, whereby the composite line profiles for AGN tend to be weaker at higher luminosities as well as narrower and shifted bluewards of 6.4 keV. The ‘X-ray Baldwin effect’ was first proposed for AGN on the basis of Ginga data by Iwasawa & Taniguichi (1993).
-
•
A new effect is found whereby the strength of the Compton reflection ‘hump’ is weaker in the most luminous quasars at high redshifts (z1). The effect is observed not only in the jet-dominated radio-loud sources, but also in the radio-quiet quasars. This finding is consistent with the ‘X-ray Baldwin effect’ discussed above, and suggests that as a whole the neutral disk reflection component in the high luminosity quasars is generally weaker than in the lower luminosity sources such as the Seyfert 1s.
-
•
A trend has also been found for the radio-quiet quasars in this sample, whereby the X-ray (2-10 keV) photon index increases with decreasing optical H width. Thus the quasars with the steepest X-ray spectra tend to have the narrowest H FWHM. This trend has previously been found in the lower luminosity Seyfert 1s (e.g. Brandt et al. 1997), but has not been reported before for the more luminous quasars.
-
•
Soft X-ray excesses are also found a significant proportion (9) of the low z quasars in this sample. Interestingly the majority of the quasars with strong soft excesses are those with the narrowest optical H widths (where H FWHM km/s).
-
•
The temperatures of the soft X-ray excesses in this paper vary in the range between kT = 100 - 300 eV, for simple blackbody fits. In a majority of the cases the temperatures are probably too hot to result by direct thermal emission from the putative quasar accretion disk. Instead, one possibility is that the soft excess originates via thermal Comptonisation of UV photons from the disk in a hot corona. Another possibility is that the ‘soft excess’ results from reprocessing. In particular emission and/or reflection from the surface of a highly ionised inner accretion disk could reproduce the observed excess in soft X-ray flux.
-
•
A systematic search has been carried out for the presence of warm or ionised absorbers in this quasar sample. Only a smaller number were found. We confirm the presence of a warm absorber in three previously reported cases (PG 1114+445, IRAS 13349+243 and MR 2251-178). The only new warm absorbers reported here are in the radio-quiet quasar PDS 456 and a marginal detection in the radio-loud quasar PG 1425+267. Overall the apparent rarity of warm absorbers in quasars may be due to different (higher) ionisation, a smaller covering fraction, or is perhaps just due to the redshift effect.
So how can we place all these observations facts into a general scheme for quasars. Firstly the differences between radio-loud and radio-quiet quasars seem relatively straightforward. In the radio-loud quasars, a strong Doppler boosted emission component from the relativistic jet can account for the higher luminosities, the generally flatter X-ray spectra as well as the diminished iron K line and reflection component in these objects. One question of real interest for future study is whether the central engine is the same in the radio-loud quasars as it is in the radio-quiet quasars. For instance the structure of the accretion disk may be different in the radio-loud quasars; sensitive studies of the reflection component and iron line in the RLQs (i.e. with XMM) may help to determine this.
The properties of the radio-quiet quasars on the whole seem more complex. As has been seen in this paper, there is little or no dependence on the X-ray continua of quasars on luminosity and therefore presumably the black hole mass. However perhaps the one driving factor responsible for the individual properties of quasars may be the fractional accretion rate of the central engine (i.e. the ratio of mass accretion to the Eddington rate - or the Eddington ratio). A high fractional accretion rate can result in the surface layers of the disk becoming highly photoionised, which subsequently can have several effects on the X-ray spectra. Depending on the degree of ionisation, ionised rather than neutral iron K emission lines can dominate the disk reflection spectrum, as observed. Furthermore at even higher ionisations, the neutral reflection component (and iron line emission) can appear to be weaker, particularly if the disk is fully ionised to several Thomson depths (e.g. Nayakshin et al. 1999, Ross et al. 1999), also in agreement with the apparent properties of the more luminous radio-quiet quasars. A further effect is that, for high Eddington ratios, stronger soft X-ray emission can be produced. This may partly arise as the intrinsic thermal emission from the disk can become stronger (Ross, Fabian & Mineshinge 1992). Another possibility is that as the disk is more highly ionised, it can become more reflective at soft X-ray energies, producing a steepening of the X-ray spectrum at low energies (i.e. as a result of the ionised disk reflection component). Thus a high accretion rate (relative to Eddington) may explain the strong soft excesses in some of the objects considered earlier.
It is also interesting to return to the question of the dichotomy between the broad and narrow line quasars that was considered earlier. It has been postulated in the literature that the narrow optical H lines may be an indicator of a high accretion rate (Pounds et al. 1995, Laor et al. 1997). If this is correct this could indeed account for the differences between the 2 types of objects. A high accretion rate may explain the strong soft excesses observed both in the narrow-line quasars (6 out of 8 objects in this sample) and also the lower luminosity narrow-line Seyfert 1s (NLS1s) in other samples (Vaughan et al. 1999, Leighly 1999). As explained this can be caused by increased intrinsic disk emission or an increase in the reflectiveness of the disk in the soft X-ray band. Also if the intrinsic disk emission is stronger, this can also account for the steeper 2-10 X-ray slopes, via increased Compton cooling (Pounds et al. 1995). Additionally some of the narrow-line quasars also show evidence for ionised iron K emission, also indicative of a high ionisation disk and thus a high accretion rate, although the evidence is tentative so far (also see Vaughan et al. 1999). So the narrow-line quasars (as well as the NLS1s) may radiate at a relatively high fraction of the Eddington rate, whereas in general the broad-lined quasars may be sub-Eddington, perhaps similar to the normal Seyfert 1s, but with more massive central black holes. An important question to ask is whether there are any narrow-line quasars at higher redshifts (z).
Finally the amount of soft X-ray absorption towards quasars was found to increase with redshift (also see Fiore et al. 1998 for a similar analysis of ROSAT quasars). This correlation is apparently robust, even when calibration effects and uncertainties in the amount of local absorption are taken into account. The main question that has arisen from this, is whether this absorption is intrinsic to the quasars or whether it originates from line-of-sight matter. Given the low-number density of high column systems (such as damped Ly- systems) that could cause appreciable X-ray absorption (O’Flaherty & Jakobsen 1997), the most likely scenario is that the bulk of this absorbing material is local to the quasars or the host galaxy environment. As there seems to be a comparative lack of absorption in some radio-quiet quasars (see Fiore et al. 1998), this excess may be associated with radio-loud quasars (also see Sambruna et al. 1999). However further data (with XMM and Chandra) is required to determine the exact location and cause of this absorption.
Acknowledgments
We thank the ASCA support teams, at GSFC and ISAS, for their help. In particular, thanks to Ken Pounds and Simon Vaughan for proof reading the paper and providing useful discussions. We also thank the anonymous referee for providing suggestions to improve the paper. This research made use of data obtained from the Leicester Database and Archive Service (LEDAS) at the Department of Physics and Astronomy, Leicester University, UK, and the High Energy Astrophysics Science Archive Research Center (HEASARC), provided by NASA’s Goddard Space Flight Center.
References
- [1] Almaini O., Boyle B.T., Griffiths R.E., Shanks A.A., Stewart G.C., Georgantopoulos I., 1995, MNRAS, 277, L31
- [2] Bevington P.R., Robinson D.K., 1992, Data Reduction and Error Analysis for the Physical Sciences, McGraw-Hill, New York
- [3] Boller T., Brandt W.N., Fink H., 1996, A&A, 305, 53
- [4] Brandt W.N., Mathur S., Elvis M., 1997, MNRAS, 285, L25
- [5] Brandt W.N., Mathur S., Reynolds C. S., Elvis M., 1997b, MNRAS, 292, 407
- [6] Brinkmann W., Otani C., Wagner S.J., Siebert J., 1998, A&A, 330, 67
- [7] Cappi M., Matsuoka M., Comastri A., Brinkmann W., Elvis M., Palumbo G. G. C., Vignali C., 1997, ApJ, 478, 492
- [8] Elvis M., Fiore F., Giommi P., Padovani P., 1998, ApJ, 492, 91
- [9] Elvis M., Fiore F., Wilkes B.J., McDowell J., Bechtold J., 1994, ApJ, 422, 60
- [10] Elvis M., Lockman F.J., Wilkes B.T., 1989, ApJ, 97, 777
- [11] Fabian A.C., Crawford C.S., 1995, MNRAS, 274, 63
- [12] Fiore F., Elvis M., Giommi P., Padovani P., 1998, ApJ, 492, 79
- [13] George I.M., et al. , 2000, ApJ, in press
- [14] George I.M., Turner T.J., Netzer H., Nandra K., Mushotzky R.F., Yaqoob T., 1998, ApJS, 114, 73
- [15] George I.M., Nandra K., Laor A., Turner T.J., Fiore F., Netzer H., Mushotzky R.F., 1997, ApJ, 491, 508
- [16] George I.M., Fabian A C., 1991, MNRAS, 249, 352
- [17] Haardt F., Maraschi L., 1993, ApJ, 413, 507
- [18] Isobe T., Feigelson E. D., Nelson P. I., 1986, ApJ, 306, 490
- [19] Iwasawa K., Taniguchi Y., 1993, ApJ, 413, L15
- [20] Laor A., Fiore F., Elvis M., Wilkes B., McDowell J. C., 1997, ApJ, 477, 93
- [21] Lawson A. J., Turner M. J. L., 1997, MNRAS, 288, 920
- [22] Lawson A. J., Turner M. J. L., Williams O. R., Stewart G.C., Saxton R.D., 1992, MNRAS, 259, 743
- [23] Leighly K., 1999, ApJS, 125, 317
- [24] Magdziarz P., Zdziarski A.A., 1995, MNRAS, 273, 837
- [25] Malkan M., Sargent W., 1982, ApJ, 254, 22
- [26] Matt G., Fabian A. C., Ross R. R., 1993, MNRAS, 262, 179
- [27] Morrison R., McCammon D., 1983, ApJ, 270, 119
- [28] Mukai K., 1998, Private communication
- [29] Murphy E.M., Lockman F.T., Laor A., Elvis M., 1996, ApJS, 105, 369
- [30] Nandra K., George I.M., Mushotzky R.F., Turner T.J., Yaqoob T., 1997, ApJ, 477, 602
- [31] Nandra K., George I.M., Mushotzky R.F., Turner T.J., Yaqoob T., 1997b, ApJL, 488, L91
- [32] Nandra K., Pounds K. A., 1994, MNRAS, 268, 405
- [33] Nayakshin S., Kazanas D., Kallman T.R., 2000, ApJ, in press
- [34] Neumann D.M., Bohringer H., 1997, MNRAS, 289, 123
- [35] O’Flaherty K.S., Jakobsen P., 1997, ApJ, 479, 673
- [36] Orr A., Yaqoob T., Parmar A.N., Piro L., White N.E., Grandi P., 1998, A&A, 337, 685
- [37] Osterbrock, D.E., Pogge, R., 1985, ApJ, 297, 166
- [38] Pan H. C., Stewart G. C., Pounds K. A., 1990, MNRAS, 242, 177
- [39] Pounds K.A., Done C., Osborne J.P., 1995, MNRAS, 277, L5
- [40] Pounds K.A., Nandra K., Stewart G.C., George I.M., Fabian A.C., 1990, Nature, 344, 132
- [41] Reeves J.N., O’Brien P.T., Vaughan S., Law-Green D., Ward M.J., Simpson C., Pounds K.A., Edelson R., 2000, MNRAS, 312, L17
- [42] Reeves J.N., Turner M.J.L., Kii T., Ohashi, 1997, MNRAS, 292, 468
- [43] Reynolds C. S., 1997, MNRAS, 286, 513
- [44] Ross R.R, Fabian A.C., Young A., 1999, MNRAS, 306, 461
- [45] Ross R.R., Fabian A.C., 1993, MNRAS, 261, 74
- [46] Ross R.R., Fabian A.C., Mineshinge, S., 1992, MNRAS, 258, 189
- [47] Sambruna R.M., Eracleous M., Mushotzky R.F., 1999, ApJ, 526, 60
- [48] Schmidt M., 1963, Nature, 197, 1040
- [49] Stark A.A., Gammie C. I., Wilson R. W., Bally J., Linke R. A., Heiles C., Hurwitz M., 1992, ApJS, 78, 77
- [50] Tanaka Y., et al., 1995, Nature, 275, 659
- [51] Turner T.J., George I.M., Nandra K., 1998, ApJ, 508, 648
- [52] Vaughan S., Reeves J., Warwick R., Edelson R., 1999, MNRAS, 309, 113
- [53] Vaughan S., Pounds K.A., Reeves J., Warwick R.S., Edelson R., 1999b, MNRAS, 308, L34
- [54] Wilkes B.J., Elvis M., 1987, ApJ, 323, 243
- [55] Wisotski L., Kohler T., Kayser R., Reimers, D., 1993, A&A, 278, 15L