The massive stellar content in NGC 604 and its evolutionary state.
Abstract
This paper analyzes the integrated ultraviolet spectra taken with the International Ultraviolet Explorer (IUE) and optical ground-based spectra taken with the William Herschel Telescope (WHT) of the giant H ii region NGC 604. These data are complemented with ultraviolet (WFPC2 through F170W) and H (WFPC2 through F656N) images retrieved from the Hubble Space Telescope (HST) archive.
The ultraviolet resonance wind stellar lines, the nebular optical emission lines and the higher order terms of the Balmer series and HeI absorption lines detected in the spectra of NGC 604 are interpreted using evolutionary models optimized for young star forming regions. The evolutionary state and the massive stellar content of the region is derived in a self-consistent way.
The three techniques applied suggest that the central ionizing cluster in NGC 604 is very young, Myr old, and that the stars in the cluster were formed in an instantaneous burst following a Salpeter (=2.35) or flatter (=1.5) initial mass function (IMF), having stars more massive that 80 M. The stellar cluster is able to provide most of the ionizing photons needed to photoionize the whole nebula, and the wind power to form the central shell structure where the cluster core is located. The stellar cluster is affected by an extinction similar to the average extinction that affects the ionized gas. The estimated number of massive stars in the cluster is also in agreement with that derived from previous studies based on the detection of individual stars. The results that we present here support the use of these techniques for the interpretation of the integrated light of more distant star forming regions.
keywords:
techniques: spectroscopic - galaxies: stellar clusters - ultraviolet: stars - ISM: H ii regions - ISM: individual: NGC 604.1 Introduction
Giant extragalactic H ii regions (RH iis) are amongst the brightest objects in galaxies. RH iis have been studied extensively because they are the best indicators of the conditions that lead to massive star formation, and they show the cloud properties immediately after the moment when stars form. Equally important, they are favourable places where to measure the chemical abundances and star formation rates in galaxies, and hence can be used to trace the chemical and star formation history of the universe, when observed in galaxies at different redshift (Madau et al. 1996; Kobulnicky & Zaritsky 1999).
RH iis are characterized to have a size larger than 100 pc and H luminosity brighter than 1039 erg s-1 (Kennicutt 1984). Therefore, the nebula requires an ionizing photon luminosity larger than 1051 s-1; this is provided by a stellar cluster that contains more than 100 young massive stars. These characteristics are very similar to those of starburst galaxies. However, they are less luminous than prototypical starbursts, and thus they are referred to as mini-starbursts (Walborn 1991). Like starbursts, RH iis show a nebular emission-line spectrum at optical wavelengths, and an absorption-line spectrum at wavelengths shorter than the Balmer jump (Leitherer 1997; Rosa, Joubert & Benvenuti 1984). This spectral morphology reflects the fact that RH iis are powered by massive stars. These stars emit photons with energies of tens of eV which are absorbed and re-emitted in their stellar winds, producing ultraviolet resonance transitions. However, the stellar wind is optically thin to most of the ultraviolet photons, that can travel tens of parsec from the star before they are absorbed and photoionize the surrounding interstellar medium. Subsequently, this ionized gas cools down via an emission spectrum. This spectral dichotomy picture allows to derive the stellar content and the evolutionary state of the cluster, through the analysis of the ultraviolet (e.g. Vacca et al. 1995; Leitherer et al. 1996), or the optical light (e.g. Cid Fernandes et al. 1992; García-Vargas & Díaz 1994; Stasińska & Leitherer 1996) using evolutionary synthesis and photoionization models. The two techniques have been applied to the prototypical starburst nucleus NGC 7714, giving similar results (González Delgado et al. 1999a).
However, around the Balmer jump the spectra of starbursts (González Delgado et al. 1998) and some H ii regions (Terlevich et al. 1996) show the higher order terms of the Balmer series and He i lines in absorption, formed in the photospheres of massive stars. These stellar lines can be detected in absorption because the strength of the gaseous Balmer lines in emission decreases rapidly with decreasing wavelength, whereas the equivalent width of the stellar absorption lines is almost constant with wavelength (González Delgado, Leitherer & Heckman 1999b). Evolutionary synthesis models that predict the profiles of the higher order terms of the Balmer series and He i lines in absorption can also be used to estimate the evolutionary state of the stellar cluster in H ii regions.
The second more luminous and brightest H ii region in the Local Group of galaxies, after 30 Dor in the LMC, is NGC 604 in M 33. Its distance, 840 kpc (Freedman et al. 1991), allows detailed studies of the individual stars, and also to obtain integrated properties. Thus, NGC 604 is an excellent laboratory in which to explore questions about the effect of star formation, the slope and upper mass limit of the IMF, and to test the consistency between the three techniques described above, that allow to determine the stellar content and the evolutionary state of the ionizing stellar cluster from the spatially integrated ultraviolet and optical spectra of the H ii region.
NGC 604 has been intensively studied in the past (e.g. Peimbert 1970; Israel & van der Kruit 1974; Smith 1975; Hawley & Grandi 1977; Kwitter & Aller 1981; Conti & Massey 1981; Rosa & D’Odorico 1982; Viallefond & Goss 1986). A precise determination of the chemical composition of the gas was made by Díaz et al. (1987); they give an oxygen abundance 12+log(O/H)=8.5. VLA observations indicate that the gas is very tenuous (average electron density, , between a few and cm-3), and not very dusty, with a mean visual extinction mag (Churchwell & Goss 1999). The morphology of the ionized gas is very complex, showing many filaments and shell structures that are expanding (e.g. Hippelein & Fried 1984; Rosa & Solf 1984; Clayton 1988; Sabalisck et al. 1995; Muñoz-Tuñón et al. 1995; Yang et al. 1995; Medina Tanco et al. 1997). This morphology is a consequence of the violent star formation activity in NGC 604. HST imaging photometry has revealed that the stellar cluster is resolved into 200 massive stars in an area of 10000 pc2 (Drissen, Moffat & Shara 1993; Hunter et al. 1996). Evidences that the stellar cluster is evolved come from the detection of Wolf-Rayet stars (Conti & Massey 1981; D’Odorico & Rosa 1981; Drissen, Moffat & Shara 1990, 1993), one supernova remnant (D’Odorico et al. 1980), and one candidate to red supergiant (Terlevich et al. 1996). The existence of these stars as members of the stellar cluster of NGC 604 suggests that the age of the region is in the range 3-5 Myr.
This paper presents spatially integrated ultraviolet and optical spectra of NGC 604. The goal is to derive the massive stellar content and the evolutionary state of the ionizing cluster, by means of evolutionary synthesis and photoionization models applied to the ultraviolet resonance wind stellar lines, to the nebular emission lines and to the higher-order terms of the Balmer series and He i lines in absorption. The consistency between the results obtained with the three techniques, and the similarity with the results obtained from studies based on the detection of individual stars, strengthens the reliability and power of these techniques when they are applied to determine the stellar content of more distant star-forming regions. Section 2 presents the observations. Section 3 describes the photoionization models that fit the emission-line spectrum of the nebula. In section 4, the higher-order terms of the Balmer and He i lines in absorption are analyzed. Evolutionary synthesis models of the ultraviolet resonance wind stellar lines are in section 5. In section 6, the massive stellar content is derived. The summary and conclusions are in section 7.
2 Observations
2.1 HST images
NGC 604 has been intensively observed with the WFPC2 camera onboard the HST. For the purpose of this work, we have retrieved HST archive images at the ultraviolet (F170W filter) and optical H (filter F656N) wavelengths. Two F170W exposures of 350 s each and two F656N exposures of 1000 s each were combined to produce one final ultraviolet (Fig. 1) and one H image (Fig. 2). The nebula was centred in the PC camera, therefore the ionizing cluster is sampled at 0.046 arcsec pixel-1, corresponding to 0.19 pc pixel-1 (at a distance of 840 kpc, 1 arcsec corresponds to 4.1 pc). The ultraviolet emission is spread in the inner 2020 arcsec. The stellar density looks much lower than that observed in super star clusters. Surface brightness photometry indicates that 75 percent of the ultraviolet flux is produced by the core of the stellar cluster, that is contained within a central nebular hole of diameter arcsec; we shall refer to this as the centre of the nebula. The H image shows many filaments and shell structures that extend out to pc from the centre of the nebula. However, the brightest parts of the nebula trace almost a ring structure at a distance of 40 pc from the centre.
The total ultraviolet flux per unit wavelength in the F170W image is erg s-1 cm-2 Å-1. The H flux is erg s-1 cm-2, in good agreement with the value measured by Churchwell & Goss (1999).
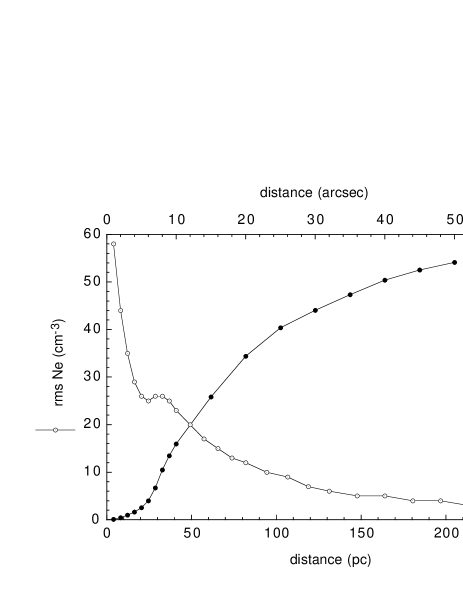
We perform surface brightness photometry in the H image using a circular aperture around the central cluster nebular hole. The cumulative flux is plotted in Fig. 3. This plot shows that 50, 75 and 90 percent of the total flux is contained in the inner 60, 100 and 140 pc radii111Unless otherwise specified, distances refer to radial distances from the adopted centre of symmetry, as shown in Figs. 1 and 2., respectively. The H flux distribution of NGC 604 has the characteristic features of a core-halo distribution, where the core can be quantitative and qualitatively explained by a thick shell structure. A detailed modelling of the geometry of NGC 604 will be presented elsewhere. The surface brightness weighted core radius of the region (following the method described in García-Vargas et al. 1997) is 80 pc.
The electron density is also estimated from the H image as , where is the ionizing photon luminosity, the total recombination coefficient of H, and the volume of the ionized region. Fig. 3 also shows the as a function of distance, that ranges from values between less than 100 cm-3 to a few cm-3, with cm-3 at 100 pc from the center of the nebula.
2.2 Ultraviolet spectroscopy
NGC 604 has been observed with the IUE through the large aperture (9.522 arcsec)222The precise form and size of the IUE large aperture is not known; we take a size of arcsec. The actual form is somewhat intermediate between the rectangle shown here and an enclosed ellipse. in low-dispersion mode, with either the SWP (1100–1900 Å) or the LWR (1900–3200 Å) cameras. The spectra were taken with the large aperture located at several different positions across the region. We have retrieved from the IUE Newly Extracted Spectra (INES, Rodríguez-Pascual et al. 1999; Cassatella et al. 2000) archive the spectra taken at the positions shown in Fig. 1 (see also Table 1). Several of the spectra were also retrieved in February 1997 from the IUE ULDA archive. When comparing the two different extractions of the same aperture spectrum, we noticed that the slope of the spectra were slightly steeper in the ULDA archive; both extractions have the same flux at 1500 Å but the ULDA extraction is 10 percent brighter at 1280 Å than the INES extraction. ULDA used a different extraction algorithm (IUESIPS) than INES, and their discrepancies are well documented (González-Riestra et al. 2000). INES represents the state of the art in the extraction of IUE spectra; so this is the data set that we use.
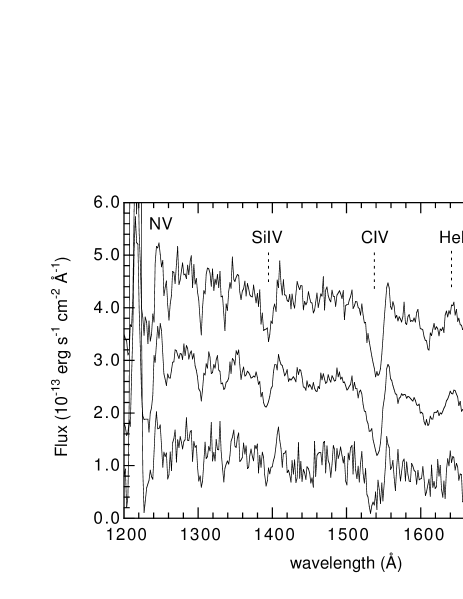
The flux at 1750 Å measured in the spectra SWP5688 (PA=149) and SWP6638 (PA=110) is erg s-1 cm-2 Å-1 and erg s-1 cm-2 Å-1, respectively. The sum total flux in these two apertures represents approximately the total ultraviolet flux emitted by the stellar cluster in NGC 604, and it amounts to erg s-1 cm-2 Å-1. This value is 45 percent larger than the total monochromatic flux measured in the F170W HST image (). Fig. 4 shows the IUE spectra at PA=110 and at PA=32, together with the average spectrum of those at PA=149, 136 and 159.
| Telescope | Instrument | Filter or Grating | wavelength | P.A. | t | Image Name |
| HST | WFPC2 | F170W | =1750 Å, =545 Å | – | 2350 | U2C60B01T, U2C60B02T |
| HST | WFPC2 | F656N | =6564 Å, =21 Å | – | 2200 | U2LX0301A |
| IUE | SWP | 1100–1900 Å | 32 | 12000 | SWP19449 | |
| IUE | SWP | 1100–1900 Å | 136 | 15300 | SWP19181 | |
| IUE | SWP | 1100–1900 Å | 159 | 6330 | SWP7349 | |
| IUE | SWP | 1100–1900 Å | 149 | 6000 | SWP5682 | |
| IUE | SWP | 1100–1900 Å | 110 | 4800 | SWP6638 | |
| WHT | ISIS | G300B | 3700-5500 Å | 131 | 23600 | |
| WHT | ISIS | G300B | 3700-5500 Å | 60 | 3600 | |
| WHT | ISIS | G300B | 3700-5500 Å | 120 | 1800 | |
| WHT | ISIS | G316R | 7900-9700 Å | 60 | 3600 | |
| WHT | ISIS | G316R | 7900-9700 Å | 120 | 1800 |
2.3 Optical spectroscopy
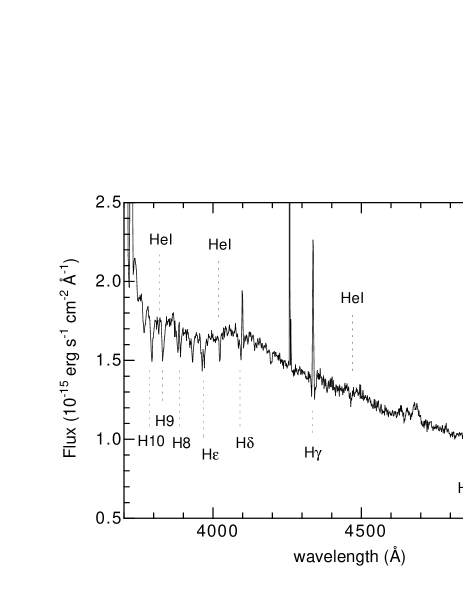
Optical spectra were obtained with the 4.2m William Herschel Telescope at the Observatorio del Roque de los Muchachos (La Palma), as part of the GEFE333Grupo de Estudios de Formación Estelar, is an international collaboration formed to take advantage of the international time granted by the Comité Científico Internacional at the Observatories in the Canary Islands. collaboration. The details of the observations and data reduction are in Terlevich et al. (1996). For the purpose of this work, we use the scanned spectra at PA=60 and at PA=120, and the single long-slit spectrum at PA=131. The scanned spectra were centred at R.A.=1h 31m 43s and Dec=30 31′ 52″, and they cover the core of the region by displacing a 1 arcsec wide longslit in steps of 1 arcsec and taking at each position a 1 minute exposure. The process is repeated until an area of 1.75′0.18′ (for the scan at PA=120) and 1.75′0.23′ (for the scan at PA=60) are covered (see Fig. 2). A one dimensional spectrum representative of the inner region of the nebula was obtained by merging the extractions that cover 11″60″ (at PA=120) and 14″60″ (at PA=60). At PA=131, a one-dimensional spectrum was extracted of length 4.6 arcsec, and centered at the position where the continuum is maximum (see fig. 3b in Terlevich et al. 1996). At this position the fraction of the stellar continuum with respect to the nebular emission lines is maximum, because it corresponds to the zone of the nebular hole. As previously noted by Terlevich et al. (1996), the spectrum shows the higher-order terms of the Balmer series and He i lines in absorption, and the continuum represents well the stellar light of the ionizing stellar cluster in NGC 604 (Fig. 5).
3 Modelling the nebular emission-lines
The emission-line spectrum of an RH ii depends on the radiation field from the ionizing stellar cluster, and on the density distribution and chemical composition of the gas. A photoionization code takes as input the spectral energy distribution of the cluster, and it solves the ionization-recombination and heating-cooling balances, to predict the ionization structure of the nebula, the electron density and the intensity of the emission lines. By comparing these output with observations, it is possible to obtain information about the ionizing stars and their evolutionary state.
The star formation law, age and massive stellar content of the stellar clusters can be constrained by comparing the observed emission line strengths with the predictions from the photoionization models, when the code uses as input the spectral energy distribution (SED) generated by a stellar evolutionary synthesis code. This technique has been used successfully to study the stellar content in starbursts and RH iis (e.g. García-Vargas, Bressan & Díaz 1995a,b; García-Vargas et al. 1997; González Delgado et al. 1999a; Luridiana, Peimbert & Leitherer 1999; Stasińska & Schaerer 1999). Here, we fit the emission-line spectrum of NGC 604 using the photoionization code CLOUDY (version 90.04, Ferland 1997).
3.1 Input parameters
In order to predict the intensities of the emission lines, we fix the geometry of the nebula, the electron density and the chemical composition of the gas. We assume that the constant density gas is ionization bounded and spherically distributed around the ionizing cluster. The inner radius is 20 pc (as seen in the H image), and the outer radius is determined by the ionization front. The results do not depend strongly on the inner radius if this changes by a factor 2 (e.g. Luridiana, Peimbert & Leitherer 1999). We assume that the gas occupies only a fraction of the sphere. Thus the filling factor, , is a free parameter with values of 10-1, , 10-2, 10-3 and 10-4. The change of filling factor is equivalent to changing the ionization parameter , defined as ); where is the ionizing photon luminosity, the electron density, the speed of light and the distance of the gas to the ionizing source. For a spherical geometry, the average is proportional to .
The chemical abundances are fixed to those derived by Díaz et al. (1987). We scale the chemical composition of the gas to the value of the oxygen abundance, 12+log(O/H)=8.5, except the abundance of N, Ne, S and He, for which we take the values derived by Díaz et al. (1987; see Table 2). The electron density derived by Díaz et al. (1987) is of the order of 100 cm-3. Our measurements of the [S ii]6717/6731 ratio indicate the low-density limit, with values below 100 cm-3 444Notice, however, that the atomic parameters for the sulfur have changed in the intervening time. We have computed constant density models at two values of the electron density, 100 cm-3 and 30 cm-3. The latter value comes from the filling factor and an electron density of 10 cm-3, derived from the H image. Also, an electron density of 30 cm-3 predicts a [S ii]6717/6731 ratio which is in better agreement with the observed value.
| 12+log(O/H) | 8.51 |
|---|---|
| log (He/H) | -1.08 |
| log (N/H) | -4.65 |
| log (Ne/H) | -4.27 |
| log (S/H) | -5.05 |
| log Q | 51.54 (s-1) |
| Inner Radius | 20 pc |
| Ne | 30, 100 cm-3 |
3.2 The radiation field
The radiation field used as input to CLOUDY is the spectral energy distribution generated by the evolutionary synthesis code developed by Leitherer and colaborators (Leitherer et al. 1999). The code includes the new set of stellar evolutionary models of the Geneva group (Schaller et al. 1992; Schaerer et al. 1993a,b; Charbonnel et al. 1993; Meynet et al. 1994), and the stellar atmospheres grid compiled by Lejeune et al. (1997), supplemented by the expanding spherical non-LTE models of Schmutz, Leitherer & Gruenwald (1992). The latter stellar atmosphere models are applied to stars with very strong stellar winds. The spectral energy distribution was generated using the Z=0.008 (Z/2.5) metallicity tracks, assuming that stars and gas have the same metallicity. We assume two different star formation scenarios: instantaneous burst and continuous star formation at a constant rate. Different models are also computed with different assumptions about the IMF. The slope is Salpeter (= 2.35), flatter (= 1.5), or steeper (= 3.3). The upper mass limit cut-off is set to 30, 60, 80 or 120 M. The lower mass limit is fixed to 1 M. However, photoionization models are not influenced by the lower limit mass cut-off if it is below 10 M. The spectral energy distribution is normalized to an ionizing photon luminosity of s-1. This value is derived from the total H flux measured in the image, after correcting by the mean extinction, mag, derived by Churchwell & Goss (1999). We will check below the compatibility of this normalization with the mass of the stellar cluster derived from the ultraviolet continuum luminosity.
3.3 The observational constraints
The emission lines were measured in our scanned spectrum of the nebula. The observed ratios have been corrected by the mean extinction, c(H)=0.22, derived by Churchwell & Goss (1999). This value is in agreement with the reddening derived from the H/H ratio measured in the scanned spectrum, when this ratio is corrected by the underlying stellar absorption. This extinction is lower than the values derived by Díaz et al. (1987), c(H)=0.3-0.4; however, the extinction changes across NGC 604 (Maíz-Apellániz 1999). The de-reddened emission line ratios to be fitted by the photoionization models are included in Table 3. This table also includes the emission line ratios derived by Díaz et al. (1987) in several parts of the nebula, and those from an integrated spectrum in Maíz-Apellániz (1999). The range of values for each of these emission line ratios defines the tolerance that we accept for the difference between the observed and the predicted values from the models.
Following Stasińska & Schaerer (1999), we try to fit the strength of the emission lines, and also emission-line ratios indicative of the electron temperature ([O iii]4363/5007), electron density ([S ii]6717/6732) and ionization structure ([O iii]5007/[O ii]3727, [S iii]9069/[S ii]6716+6732). Another important observational constraint is the radius of the nebula. The H image shows that the flux extends out to 200 pc of the center of the region; however, more than 90, 75 and 50 percent of the total flux is within the inner 140 pc, 100 pc and 60 pc radii, respectively (Fig. 3). Our determination of the core radius of the region is 80 pc.
3.4 Model results
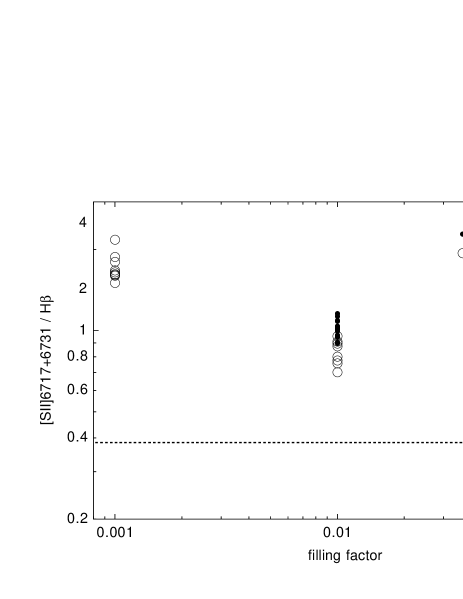
We start by fixing the filling factor and the electron density by means of fitting the line ratios [S ii]6717+6731/H and [S ii]6717/6731, and the radius of the nebula. [S ii]6717+6731/H is a good calibrator of the ionization parameter, because this ratio does not depend much on the IMF assumptions, on the star formation law or on the evolutionary state of the cluster (González Delgado et al. 1999a). Instead, this ratio depends on the filling factor, and for fixed geometry, ionizing photon luminosity and electron density, it depends on the ionization parameter555Nonetheless, we should always be cautious when using sulfur dependent diagnostics, given the uncertainties about the atomic parameters and its not so well known ionization; also this calibration relies on the assumption of an ionization bounded nebula.. The observed ratio, [S ii]6717+6731/H, indicates a filling factor (Fig. 6). Therefore, a large fraction of the volume of the region is filled with ionized gas; however, this gas is very tenuous because the electron density measured in the H image is cm-3, and the electron density in the S+ zone, derived from the definition of filling factor (), is cm-3. The observed ratio [S ii]6717/6731=1.4, indicates that the electron density is cm-3. Models with a filling factor of 0.1 and cm-3 predict well the observed [S ii]6717/6731 ratio. If the electron density were as high as cm-3, then the filling factor would have to be lower, =0.01, and in this case the values of [S ii]6717+6731/H and [S ii]6717/6731 predicted by the models are 0.9 and 1.3, respectively. These predictions are larger and smaller than the observed values, respectively. Furthermore, models with and cm-3 predict a Strömgren radius 110 pc, in agreement with the radius derived from the H surface brightness photometry. Models with cm-3 predict a radius a factor two smaller than models with cm-3. Therefore, we conclude that a filling factor and a density cm-3 fit well the ratios [S ii]6717+6731/H and [S ii]6717/6731, and the size of the region.
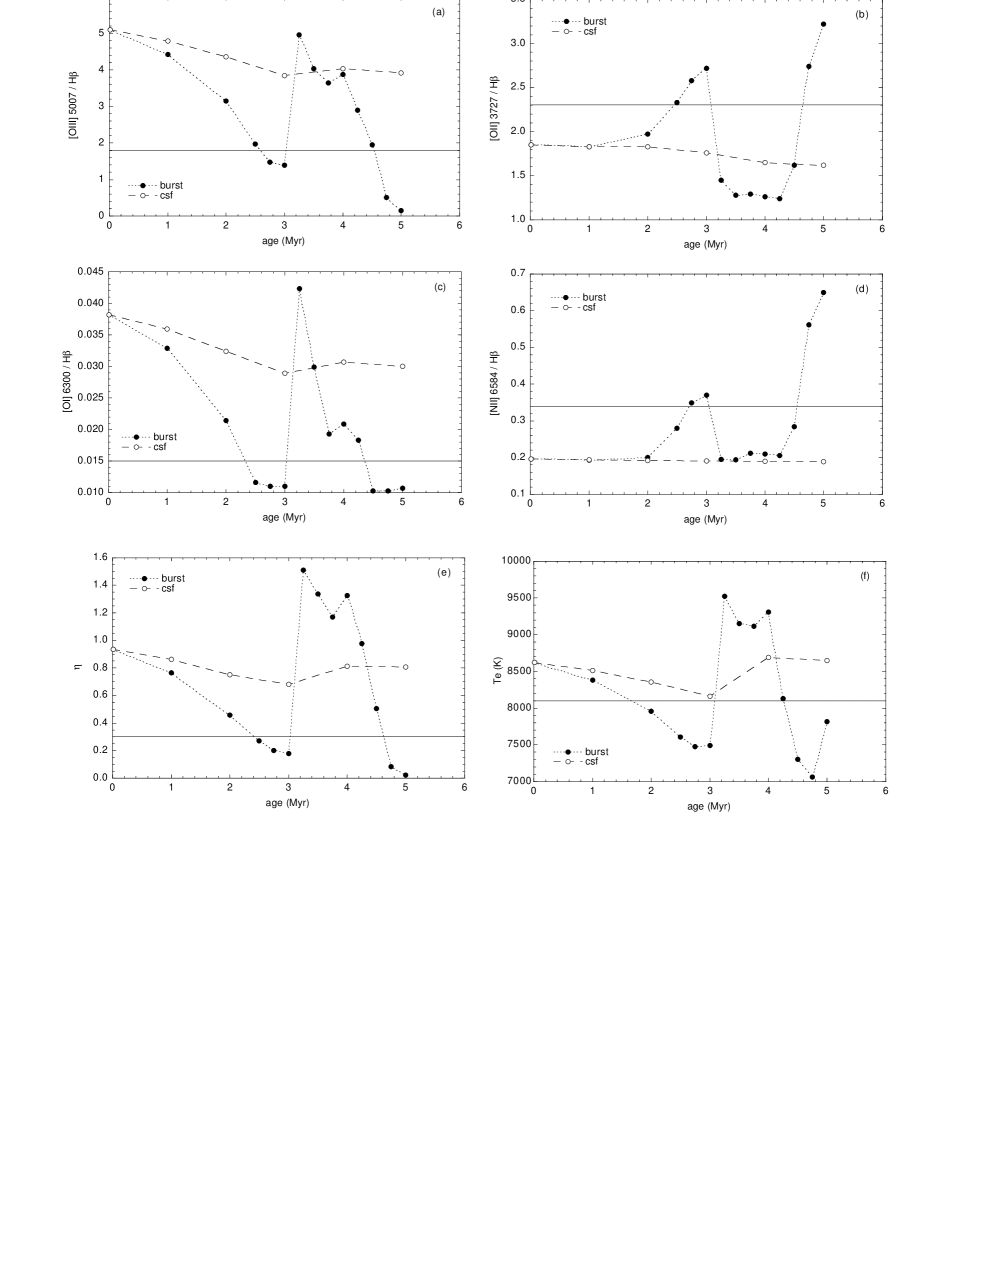
The emission-line ratios [O iii]5007/H, [O ii]3727/H, [O i]6300/H, and [N ii]6584/H have been plotted as a function of the cluster age, using a filling factor = 0.1 and an electron density cm-3. To check whether the models also fit line ratios indicative of the structure of the region, we have plotted the parameter, defined as ([O iii]5007+4959/[O ii]3727)/([S iii]9069+9532]/[S ii]6717+6731), and the electron temperature predicted by the models as a function of the age. The parameter is a measure of the softness of the radiation field (Vílchez & Pagel 1988). The models assume two different star formation laws, an instantaneous burst or continuous star formation at a constant rate, and different assumptions about the slope (=2.35, 1.50, 3.0) and upper mass limit cut-off of the IMF (120, 80, 60, 30 M).
Fig. 7 compares the observed emission line ratios with the prediction of continuous and instantaneous burst, for a Salperter IMF and upper mass limit cut-off of 80 M. The observed ratios are in better agreement with burst than with continuous star formation models (that predict high excitation lines and [O i]6300/H larger than observed). The continuous star formation scenario can be made compatible with the observed emission-line ratios if stars more massive than 50 M are not formed in the cluster; however, these models predict significantly fewer numbers of Wolf-Rayet stars in the cluster. Thus, continuous star formation models cannot fit the emission-line ratios and predict the existence of Wolf-Rayet stars simultaneously.
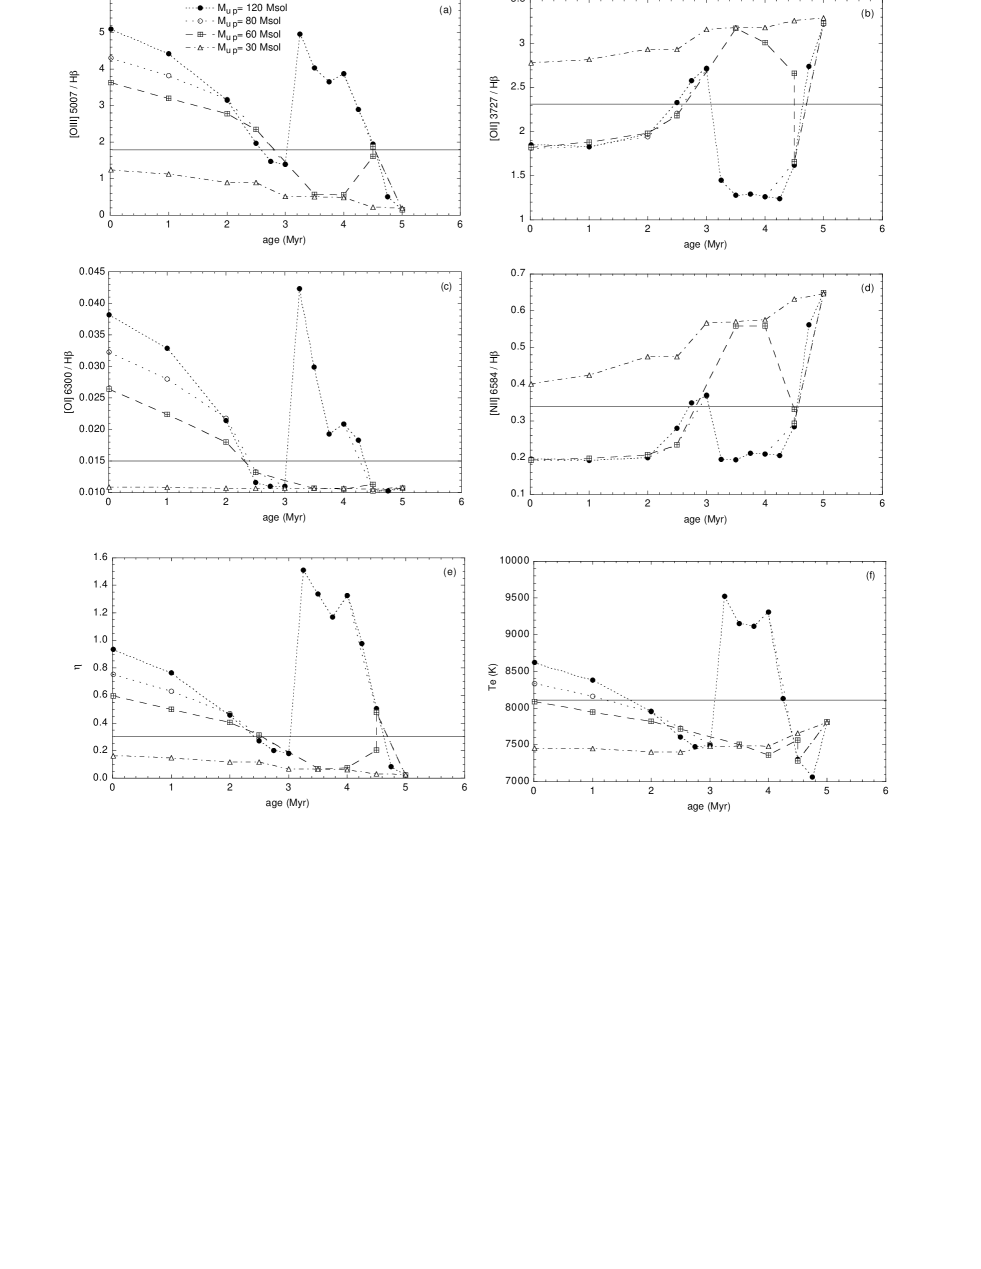
Fig. 8 compares the observed emission line ratios with the prediction of an instantaneous burst, for different assumptions of the IMF upper mass limit cut-off. Models with M predict high excitation lines (low excitation lines) ratios which are much lower (higher) than the observed values. Thus, similar results are obtained if M. Burst models with M fit the emission-line ratios if the age of the cluster is 2.5–3 Myr or 4.5–4.8 Myr. However, if M, Wolf-Rayet stars only appear in the cluster if it is 4–5 Myr old. Models with M and 80 M give similar results after the first 2 Myr, and the same behaviour with age. The electron temperature, and the emission-line ratios, all indicate that massive stars ( M) have to be present in the cluster, and that the cluster is Myr or Myr old. Further constraints on the upper mass limit cut-off will be imposed by the relavite number of Wolf-Rayet with respect to O stars in the cluster.
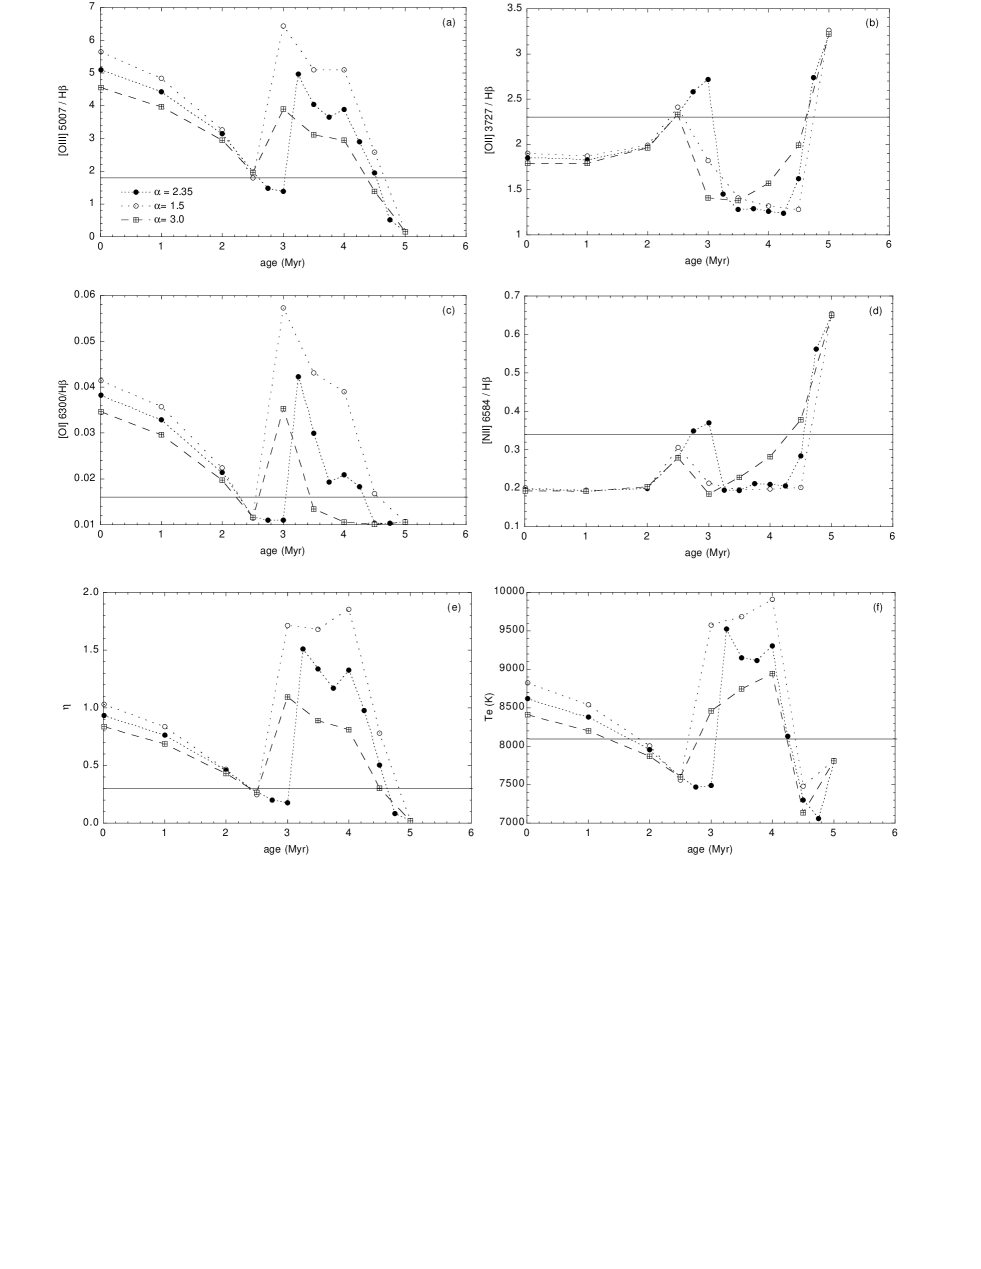
Burst models have been computed also for different values of the IMF slope (=2.35, 3.0 and 1.5). The behaviour of the emission line ratios with the age is very similar for these three values of the IMF slope (Fig. 9). The observed ratios indicate an age Myr or 4.5 Myr, and cannot discriminate between the different values of the slope. Further constraints on the IMF slope will come from the WR/O ratio. This point will be discussed further in section 6.
| Line | Observations | Models | ||||||
|---|---|---|---|---|---|---|---|---|
| (1) | A | C | D | B | 2.5 Myr | 3.0 Myr | 3.5 Myr | |
| [O ii] 3727 | 2.3 | 2.08 | 2.49 | 1.61 | 2.00 | 2.3 | 2.7 | 1.3 |
| [Ne iii] 3869 | 0.11 | 0.15 | 0.26 | 0.13 | 0.07 | 0.08 | 0.034 | 0.29 |
| [O iii] 4363 | 0.0054 | 0.0062 | 0.087 | 0.0063 | 0.0052 | 0.0033 | 0.024 | |
| [O iii] 5007 | 1.8 | 2.69 | 0.97 | 2.55 | 1.8 | 2.0 | 1.4 | 4.0 |
| [O i] 6300 | – | 0.015 | – | 0.01 | 0.02 | 0.012 | 0.011 | 0.03 |
| [N ii] 6584 | 0.34 | 0.30 | 0.51 | 0.27 | 0.31 | 0.28 | 0.37 | 0.19 |
| [S ii] 6716 | 0.23 | 0.14 | 0.31 | 0.16 | 0.16 | 0.19 | 0.21 | 0.22 |
| [S ii] 6732 | 0.16 | 0.11 | 0.23 | 0.11 | 0.13 | 0.14 | 0.15 | 0.16 |
| [S iii] 9069 | 0.40 | 0.33 | 0.25 | 0.51 | 0.40 | 0.40 | 0.40 | 0.34 |
| [O iii] 4363/5007 | 0.0030 | 0.0023 | 0.0041 | 0.034 | 0.0035 | 0.0026 | 0.0024 | 0.006 |
| [S ii] 6717/6732 | 1.4 | – | – | – | – | 1.4 | 1.4 | 1.4 |
| 0.3 | – | – | – | – | 0.27 | 0.18 | 1.3 | |
(1): line ratio measured in our scaned spectrum or the integrated spectrum
of Maíz-Apellániz (1999).
A, B, C and D are the line ratios in different parts of the nebula,
from Díaz et al. (1987)
4 Modeling the H Balmer and He i absorption lines
The optical continuum of an RH ii is dominated by early-type stars. The spectra of O and B stars are characterized by strong H Balmer and He i absorption lines, with very weak metallic lines formed in the photosphere of these stars (Walborn & Fitzpatrick 1990). The H Balmer and He i recombination nebular emission lines are superposed on the corresponding photospheric lines. However, the higher order terms of the Balmer series and some of the He i lines can be detected in absorption and the lower terms of the Balmer series can show absorption wings. The detection of these absorption features depends on the spectral and spatial resolution of the observations, on the spatial distribution of the stellar cluster with respect to the nebular emission, and on the evolutionary state of the stellar cluster. These photospheric features have been detected in a spectrum of NGC 604 (Fig. 5) because it corresponds to the zone of the nebular hole where the core of the central cluster is located, so it maximizes the contrast of the stellar with respect to the nebular contributions (see Fig. 2). In this section we will constrain the evolutionary state of NGC 604 and the IMF using the profile of the higher-order terms of the H Balmer series and the strength of some of the He i lines in absorption.
4.1 Description of the models
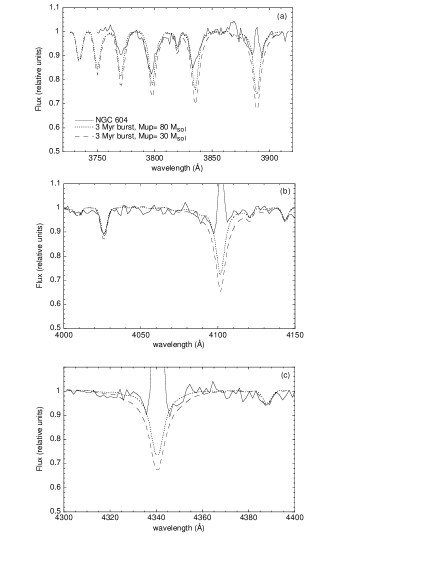
González Delgado et al. (1999b) have computed evolutionary stellar population synthesis models that predict the photospheric absorption H Balmer and He i lines, between 3700 and 5000 Å, for a single-metallicity stellar population. The models, which are optimized for galaxies with active star formation, synthesize the profiles of the H Balmer series (H, H, H, H8, H9, H10, H11, H12 and H13) and the He i absorption lines (He i 4922, He i 4471, He i 4388, He i 4144, He i 4121, He i 4026, He i 4009 and He i 3819), with a spectral sampling of 0.3 Å pixel-1, for a burst and for continuous star formation at a constant rate. They use a stellar library that includes NLTE absorption profiles for stars hotter than 25000 K, and LTE profiles for lower temperatures. The temperature and gravity coverage is K, and , respectively (González Delgado & Leitherer 1999). The models assume that stars evolve from the main sequence following the evolutionary tracks of the Geneva group (Schaller et al. 1992; Schaerer et al. 1993a,b; Charbonnel et al. 1993; Meynet et al. 1994). The strength of the Balmer and He i lines is sensitive to the age after the first 3 Myr of evolution, and sensitive to the IMF if the age is younger than 3–4 Myr. Models assume that stars have a metallicity , and make different assumptions about the IMF slope (=1.5, 2.35 and 3.0), and upper mass limit cut-off ( M and 30 M). For the purpose of this paper, the range of ages computed spans from 0 to 10 Myr.
4.2 Model Results
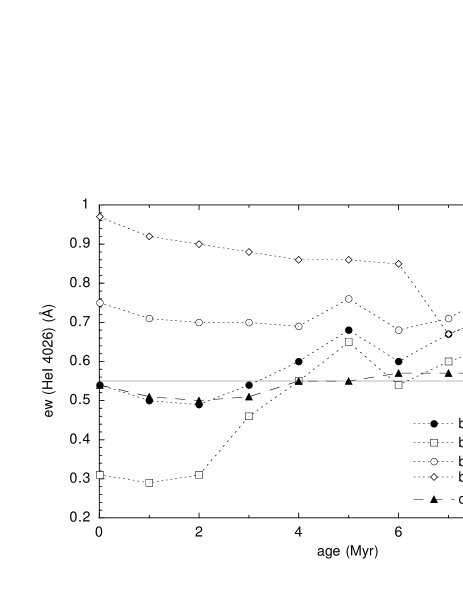
We use the equivalent width of He i 4388, 4026, and 3819, and the wing absorption profiles of H, H, H, H8, H9 and H10 to constrain the age, IMF and star formation law. He i 4388, 4026, and 3819 are detected in absorption, because the corresponding nebular emission lines have equivalent widths that are at least a factor 3 weaker than the nebular emission in He i 4471 (González Delgado et al. 1999b). Note that He i 4471 is only partially filled with the nebular emission; therefore, the nebular emission of the lines He i 4388, He i 4026 and He i 3819 is 0, and the equivalent widths of these absorption features represent well the strength of the stellar continuum radiation of the cluster. The equivalent widths of these lines, He i 4388, He i 4026 and He i 3819, measured in the spectrum of Fig. 5 are 0.32, 0.55 and 0.26 Å, respectively. Their strength is compatible with continuous star formation and with burst models 3 Myr old (Fig. 10). However, He i lines can constrain the IMF. Models with an IMF steeper than Salpeter or with M predict He i lines stronger than observed. The strengths of the lines are compatible with a 3 to 4 Myr old burst formed following a Salpeter or slightly flatter IMF (= 1.5, Fig. 10). The absorption wings of the Balmer lines are also compatible with burst models 3 Myr old, with Salpeter or slightly flatter IMF (= 1.5, Fig. 11).
5 Modelling the ultraviolet stellar lines
The ultraviolet light from an RH ii is dominated by O stars. These hot stars develop strong wind stellar lines due to the radiation pressure in ultraviolet resonance lines (Morton 1967). As a result, all the strong ultraviolet lines (e.g. O vi 1034, N v 1240, Si iv 1400, C iv 1550 and N iv 1720) show a blueshifted absorption (about 2000–3000 km s-1) or a PCygni profile. The shape of the profile reflects the stellar mass-loss rate, which is related to the stellar luminosity, and thus to the stellar mass. Most of the ultraviolet spectra of RH ii are dominated by absorption features (Rosa et al. 1984; Vacca et al. 1995; Mas-Hesse & Kunth 1999), without any nebular emission, which is very similar to those of starburst galaxies666One important exception is knot A in the RH ii NGC 2363 (Drissen et al. 2000), so young that the effect of winds is not yet reflected in its uv spectrum.. Most of these lines are formed in the stellar winds of the massive stars that belong to the starburst. The profile of these lines reflects the stellar massive content in the starburst; therefore, they depend on the IMF and star formation law (Leitherer, Robert & Heckman 1995). In this section, we constrain the evolutionary state and the IMF of NGC 604 by means of fitting the profiles of the ultraviolet stellar lines Si iv and C iv.
5.1 Description of the models
Evolutionary stellar population models have been computed with the code Starburst 99 (Leitherer et al. 1999). The code uses a stellar library of IUE ultraviolet spectra of O, B and Wolf-Rayet stars (Robert, Leitherer & Heckman 1993). The spectral resolution of the O and Wolf-Rayet stars observed is 0.75 Å. These stars are located in the solar neighborhood. However, the evolutionary models computed here assume that the stars evolve from the main sequence following the evolutionary track at . Models are computed for instantaneous bursts between 0 and 10 Myr, and for continuous star formation lasting 10 Myr, and different assumptions about the slope (=2.35, 3.0 and 1.5) and upper mass limit cut-off (120, 80, 60 and 40 M) of the IMF. The model spectra are smoothed to the IUE spectral resolution of the observations of NGC 604, which is 6 Å.
5.2 Model results
The strongest wind stellar features in the spectra of NGC 604 are N v 1240, Si iv 1400, C iv 1550, He ii 1640, and N iv 1720. These features are present in all the spectra of NGC 604; however, for this analysis we use the average spectrum of those at PA=149, 136 and 159, and the spectrum at PA=32, because they have the best signal to noise ratio. The evolutionary state, the star formation law and the IMF in NGC 604 is constrained with the profiles of these lines.
He ii shows a broad emission profile in Wolf-Rayet and O3–O5 supergiant stars; N iv shows a PCygni profile in Wolf-Rayet stars; N v and C iv show strong PCygni profiles in all O stars, and Si iv only in O supergiants. Thus, the profile of these lines in the integrated spectrum of a starburst depends strongly on the stellar content and age of the stellar cluster. In particular, Si iv shows a strong PCygni profile if the cluster formed in an instantaneous burst and its age is between 3 and 5 Myr, because within this age interval the ultraviolet light is dominated by O blue supergiants. On the other hand, the profile of C iv depends strongly on the IMF. It shows a strong PCygni profile if stars more massive that 60 M are formed in the cluster, and if the slope of the IMF is flatter than =3.0.
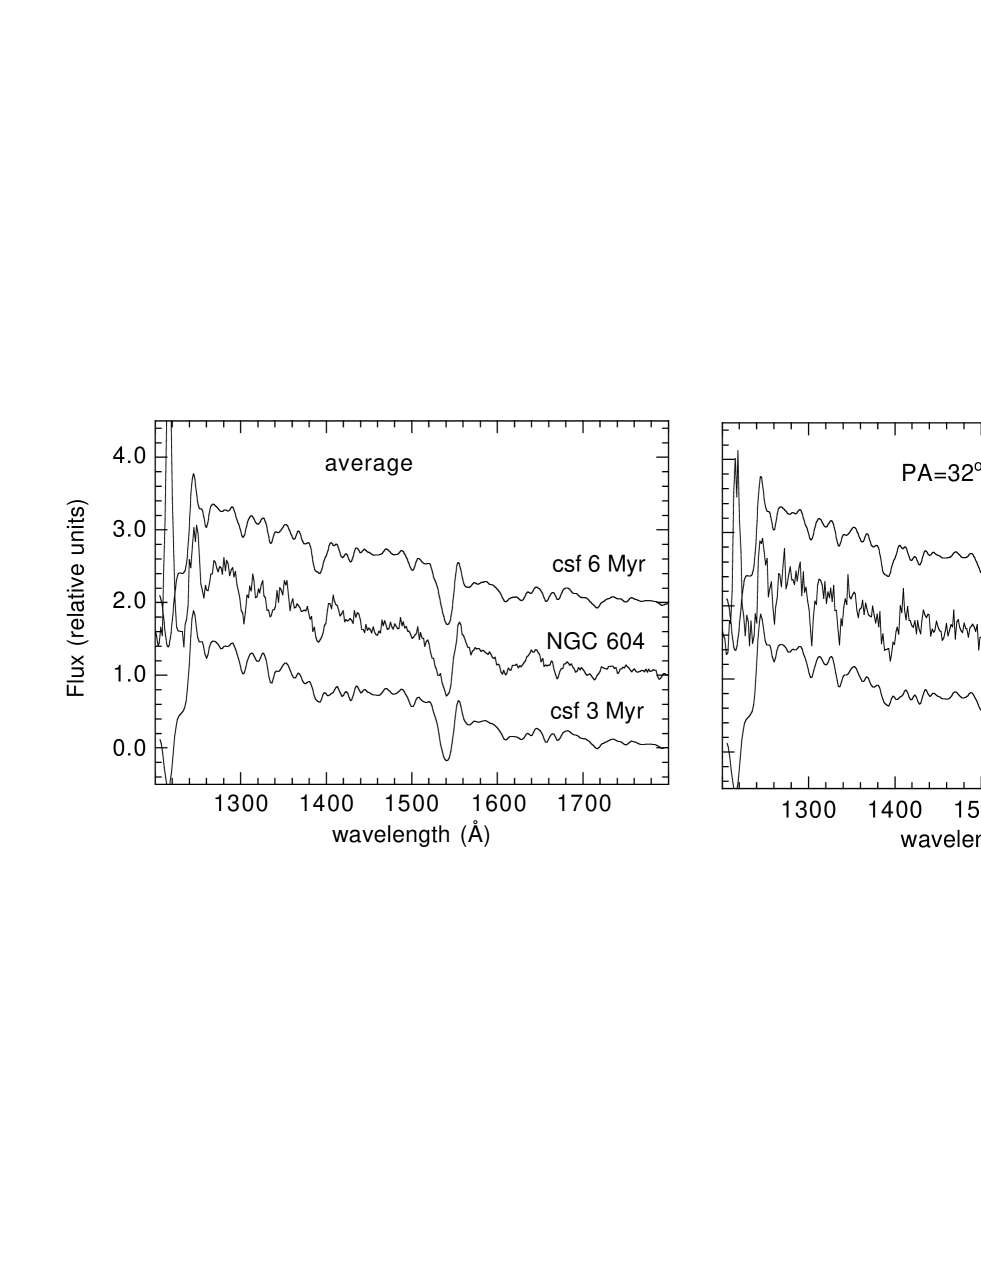
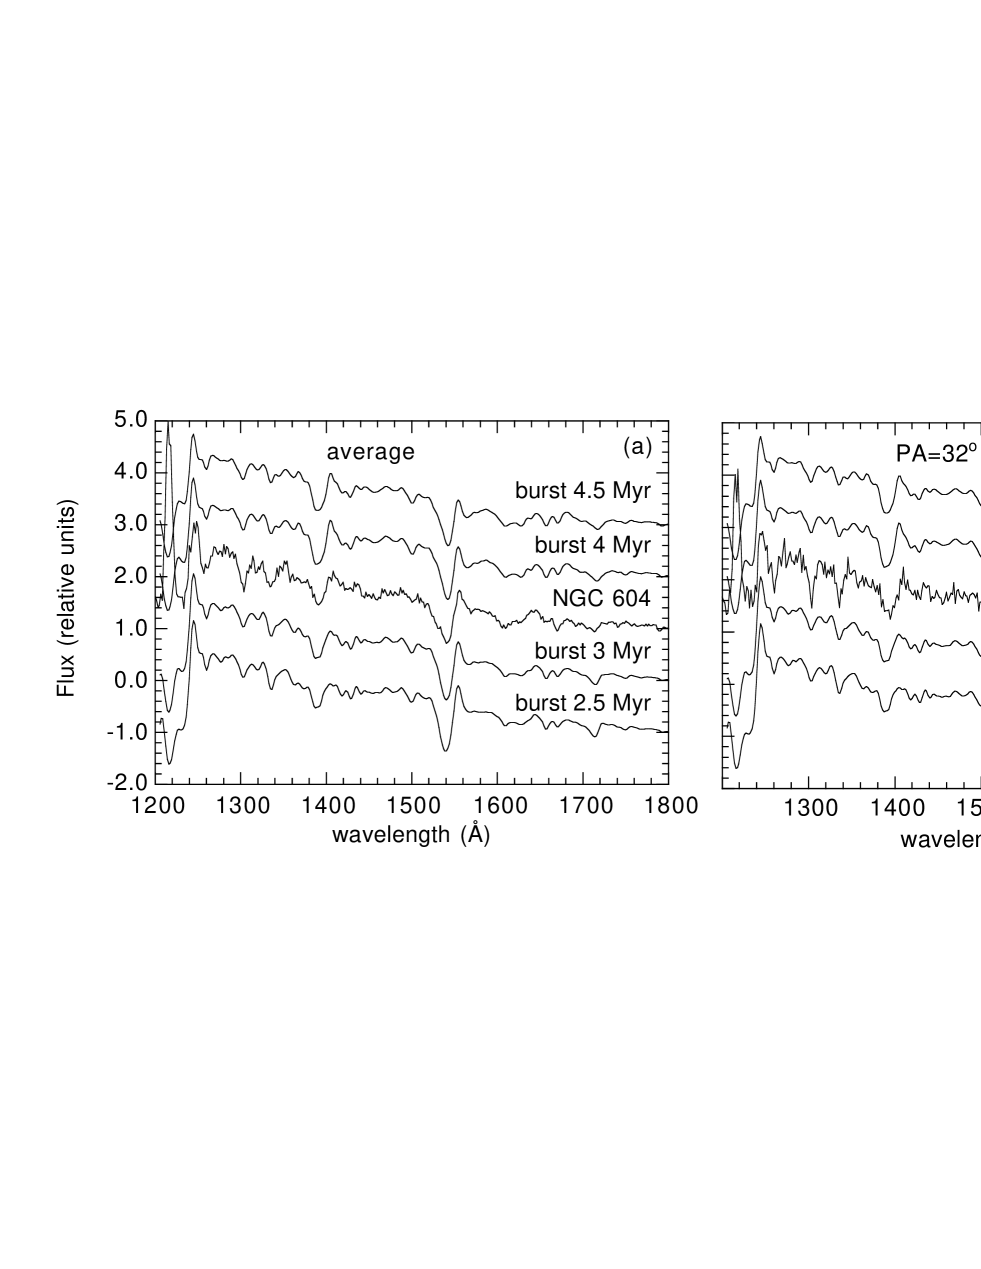
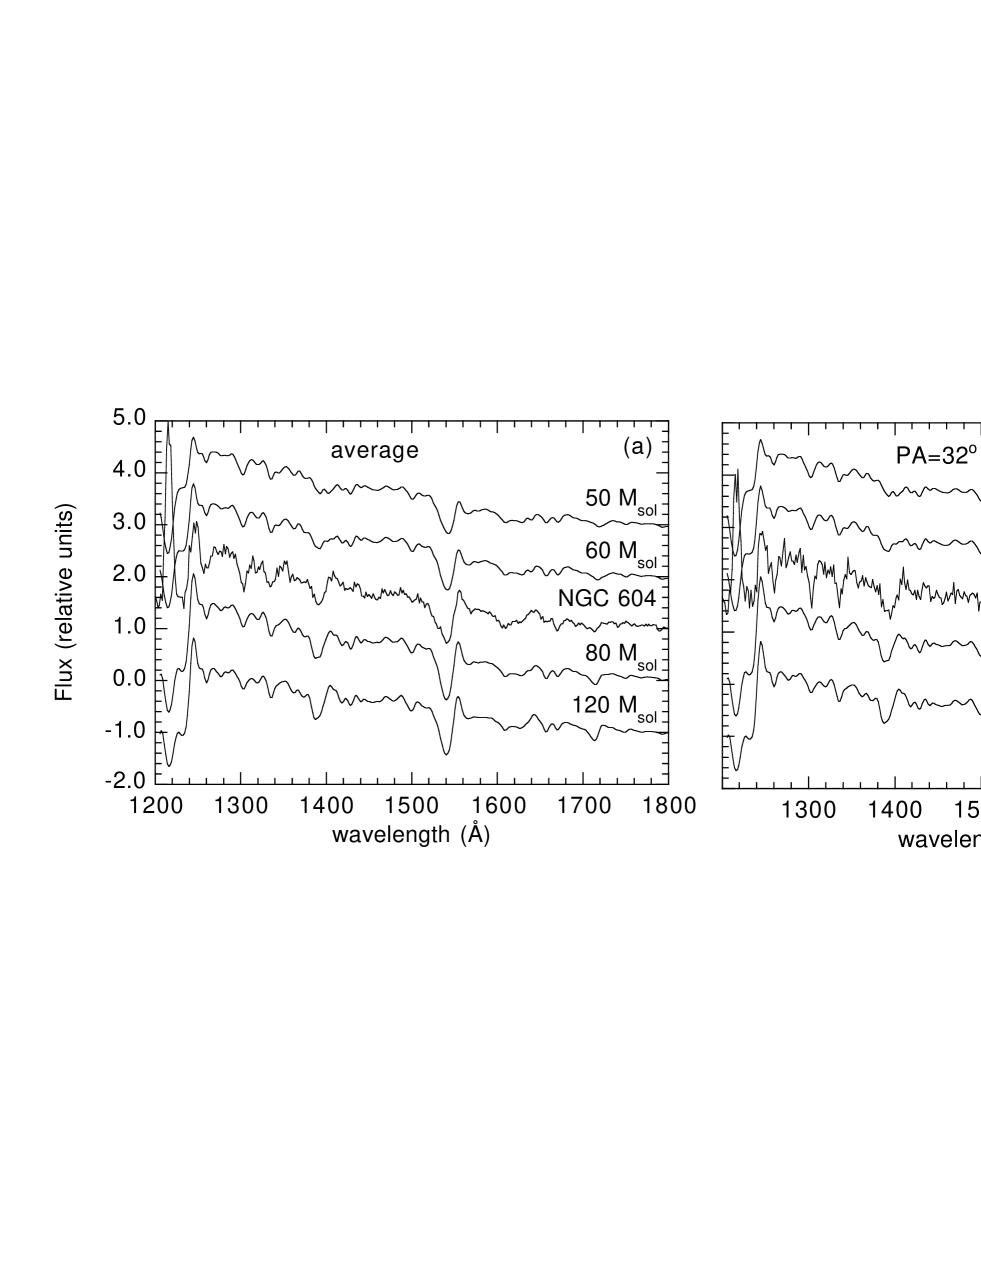
The spectrum of NGC 604 indicates that its stellar population must be dominated by massive, young O stars; thus, the stellar cluster must be young and of short duration. Continuous star formation models can be ruled out because they show Si iv weaker than observed (Fig. 12). In these models the line is diluted because the fraction of O supergiants with respect to the total number of O stars is lower in the continuous star formation than in the instantaneous burst models. The strength of Si iv in NGC 604 indicates that it is an instantaneous burst. The age of the burst has to be between 3 to 5 Myr, because bursts younger than 3 Myr or older than 5 Myr have very few O supergiants, and thus very weak Si iv (Fig. 13). On the other hand, from the strength of C iv we can exclude instantaneous bursts with M (Fig. 14), and IMF steeper than =3.0 (Fig. 15). Therefore, we conclude that continuous star formation and instantaneous burst models with few very massive stars can be ruled out. The wind lines are compatible with an instantaneous burst, formed following a Salpeter or slightly flatter IMF, with upper mass limit cut-off higher than 60 M. A 3 Myr instantaneous burst with Salpeter and M fits well the profile of the wind stellar lines.

6 The massive stellar content of NGC 604
We derive the massive stellar population in NGC 604 from the ultraviolet continuum luminosity, comparing the observations with the predictions of synthetic models. The number of Wolf-Rayet stars are derived from the luminosity of the He ii 1640 line. The stellar content derived in this way is compared with that derived from HST photometry of stars in NGC 604. However, we need first to estimate the extinction.
6.1 Extinction estimates
Leitherer & Heckman (1995) have shown that the ultraviolet continuum arising from a young starburst () has a spectral index, (F), which is independent of the IMF, star formation law and metallicity. Thus, any deviation from the predicted value, for a 3 Myr instantaneous burst, could be attributed to reddening.
The ultraviolet continuum flux distribution of the IUE spectra of NGC 604 shows evidence of reddening, because after correcting by Galactic extinction, (McClure & Racine 1969), the spectra are flatter than the spectral energy distribution predicted by the evolutionary synthesis models. Massey & Hutchings (1983), analysing IUE spectra of H ii regions in M33, conclude that the M33 extinction curve is significantly different from that of the Galaxy, because the spectra of the H ii regions show very weak 2200 Å interstellar absorption dip, resembling those of the LMC and SMC. Therefore, we use the LMC curve to match the observed spectra with the spectral energy distribution of a 3 Myr old instantaneous burst. The derived is 0.1 for the spectrum at PA=32, and 0.12 for the average spectrum of those at PA=136, 159 and 149. These values are in agreement with those derived by Massey & Hutchings (1983). However, the extinction can be 0.03 higher than the values above if it is derived comparing the observed spectra with the spectral energy distribution predicted including only the stellar contribution. This is due to the nebular contribution being dominated by the two-photon continuum emission that peaks at 1500 Å. If the nebular continuum is not included, the spectral energy distribution is steeper and a higher extinction is required to match the observed and predicted ultraviolet flux distribution. The reason to do this new estimation is because the nebula is more extended than the IUE aperture; thus, only a fraction of the nebular continuum contributes to the IUE aperture.
We have estimated also the extinction using the Calzetti, Kinney & Storchi-Bergmann (1994) extinction law. This is an empirical extinction curve derived for starbursts, which is very similar to the MW extinction law but it does not show the 2200 Å bump. Using this curve, we estimate to match the observed spectra and the spectral energy distribution predicted by the models.
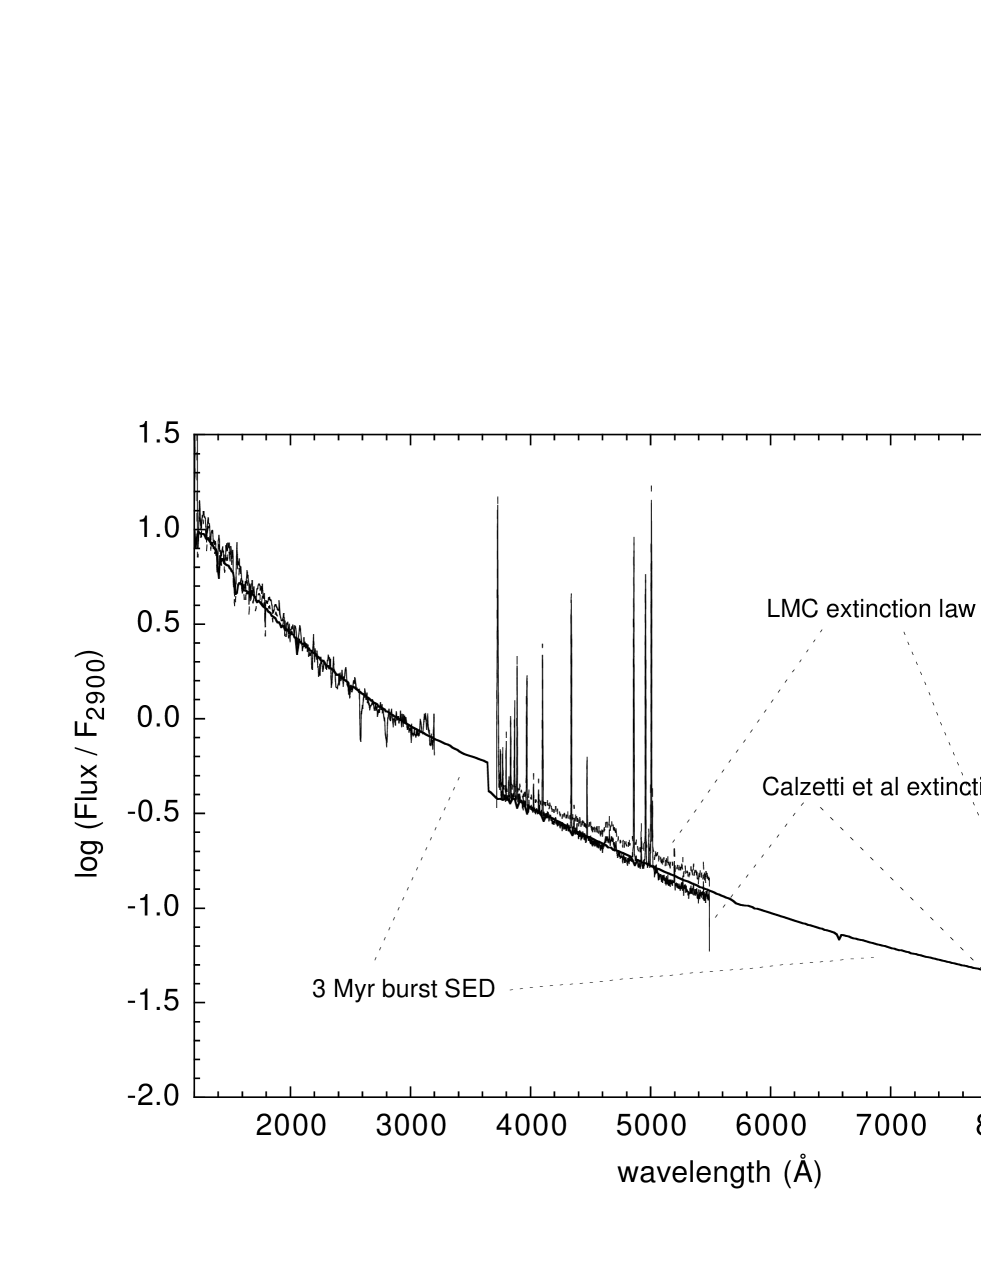
To distinguish between these two results, we compare the spectral energy distribution predicted by the evolutionary models with that of NGC 604. We build the spectral energy distribution of NGC 604 from the ultraviolet to near-infrared using the SWP+LWR IUE spectrum at PA=110 plus that at PA=149, and the average optical spectra scanning the inner 1160 arcsec (at PA=120), and 1460 arcsec (at PA=60). We use the (F439W) and (F814W) HST+WFPC2 images to flux calibrate the optical spectra, because the mode in which the scanning was performed precludes an accurate absolute flux calibration based only on the ground-based observations. The resulting optical and ultraviolet spectra are normalized dividing by the flux at 2900 Å. Then, the spectra are dereddened by using the LMC extinction law, and by using the Calzetti et al. (1994) extinction law. Even though apparently the spectra dereddened with Calzetti’s law seem to match better the spectral energy distribution, a change in the scaling calibration factor of only 10 percent (larger than that used) gives a better match with the spectrum dereddened by the LMC law. Thus, given the uncertainties in the flux calibration of the ground-based optical spectra, we cannot really distinguish between these two extinction laws.
6.2 The number of O stars and W/O ratio
We assume that the total ultraviolet flux of the region is approximately the sum of the fluxes at PA=110 and at PA=149. After correcting by Galactic extinction, the flux at 1500 Å is erg s-1 cm-2 Å-1. The intrinsic luminosity777Note that this luminosity and the quantities derived in Table 4 should be almost a factor two lower if the total ultraviolet flux is equal to the flux of only one of the IUE apertures, or to that measured in the F170W HST image, erg s-1 Å-1. is 1038.16 erg s-1 Å-1 (1038.32 erg s-1 Å-1) if the flux is corrected by (0.2) using the LMC (Calzetti et al. 1994) extinction law.
The mass of the cluster, the ionizing photon luminosity and the number of O stars predicted by the evolutionary synthesis models are given in Table 4. These quantities indicate that very massive stars must be present in the cluster and that it is very young. In fact, instantaneous bursts older than 3.5 Myr predict an ionizing photon luminosity which is at least a factor 3 lower than the value derived from the H flux, which is (s-1). In contrast, a 3 Myr instantaneous burst (with ) reproduces well the ionizing photon luminosity888However the values of predicted are still a factor 1.5 lower than the photon luminosity derived from the H flux, suggesting that other sources in addition to the central cluster contribute to the ionization of the gas, and/or that the extinction is higher than . Note that if log ergs-1 Å-1, then all the quantities derived in Table 4 should be a factor larger.). These models predict a mass of the stellar cluster that ranges between 0.1 and M, depending on the assumption about the upper mass limit cut-off and slope of the IMF. The number of O stars ranges between 150 and 215 (if ), which is in agreement with the number of O stars (186) reported by Hunter et al.(1996).
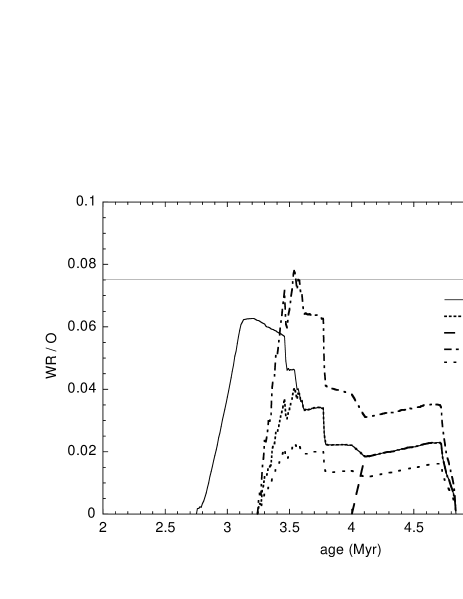
The slope and upper mass limit cut-off of the IMF can also be constrained with the observed Wolf-Rayet over O ratio, WR/O. HST images of the NGC 604 cluster have detected 14 Wolf-Rayet or Of candidates (Drissen et al. 1993). Thus, WR/O0.075. This ratio is very high, suggesting that the cluster is young (3–3.5 Myr), and that it must contain very massive stars. Instantaneous burst models with the IMF slope steeper than Salpeter or M predict a ratio much lower than 0.075 (Fig. 17). Models with IMF flatter than Salpeter or with upper mass limit cut-off as high as 120 M reproduce well the observed value.
6.3 Deposition of kinetic energy in the interstellar medium
Massive stars not only interact with the interstellar medium via their radiation, but also depositing kinetic energy via their stellar winds. The energy released during their lifetime is comparable to that deposited by a supernova event (Leitherer, Robert & Drissen 1992). The evolutionary state and the stellar content derived above for NGC 604 suggests that the massive stars in NGC 604 can release enough kinetic energy to form many of the filaments and expanding shell structures observed in the region.
Yang et al. (1996) have reported the properties of five shells; these have expansion velocities that range between 40 and 125 km s-1, and sizes between 35 and 125 pc (see also Sabalisck et al. 1995). The wind power required to form these bubbles ranges between 2 erg s-1 and 9 erg s-1, with a sum total of erg s-1.
We estimate the wind power produced by the stellar cluster in NGC 604 using Starburst99 (Table 4). For an instantaneous burst, the wind power ranges between 3 erg s-1 and 4 erg s-1, depending on the assumptions about the slope and massive cut-off of the IMF. Thus, the energy relased by winds in NGC 604 is not enough to explain the formation of the five shells; however, it can explain the formation of the central hole (shell number 3) and shell number 4 (see fig. 2 in Yang et al. 1996), that encircles the core of NGC 604 cluster (cf. Fig. 2). The wind power required by these two bubbles is 5 erg s-1 and 2 erg s-1, respectively.
| age | Mass | No.O | log Pw | |||
| (Myr) | (M) | (ph s-1) | (105 M) | (erg s-1) | ||
| erg s-1 Å-1 | ||||||
| 3.0 | 2.35 | 80 | 51.28 | 0.47 | 209 | 37.98 |
| 3.5 | 2.35 | 80 | 51.20 | 0.43 | 189 | 38.59 |
| 4.0 | 2.35 | 80 | 51.10 | 0.51 | 218 | 38.38 |
| 4.5 | 2.35 | 80 | 51.02 | 0.62 | 244 | 38.50 |
| 5.0 | 2.35 | 80 | 50.86 | 0.72 | 262 | 37.36 |
| 3.0 | 2.35 | 120 | 51.40 | 0.36 | 164 | 38.60 |
| 3.5 | 2.35 | 120 | 51.21 | 0.44 | 186 | 38.99 |
| 4.0 | 2.35 | 120 | 51.10 | 0.54 | 220 | 38.39 |
| 4.5 | 2.35 | 120 | 51.02 | 0.65 | 247 | 38.51 |
| 5.0 | 2.35 | 120 | 50.86 | 0.74 | 258 | 37.36 |
| 3.0 | 1.50 | 80 | 51.28 | 0.13 | 180 | 38.05 |
| 3.5 | 1.50 | 80 | 51.23 | 0.12 | 152 | 38.76 |
| 4.0 | 1.50 | 80 | 51.11 | 0.17 | 199 | 38.55 |
| 4.5 | 1.50 | 80 | 51.06 | 0.24 | 239 | 38.67 |
| 5.0 | 1.50 | 80 | 50.85 | 0.31 | 267 | 37.41 |
| 3.0 | 3.00 | 80 | 51.24 | 2.00 | 215 | 37.45 |
| 3.5 | 3.00 | 80 | 51.14 | 1.90 | 198 | 37.96 |
| 4.0 | 3.00 | 80 | 51.05 | 2.00 | 210 | 37.78 |
| 4.5 | 3.00 | 80 | 50.97 | 2.20 | 228 | 37.92 |
| 5.0 | 3.00 | 80 | 50.74 | 1.90 | 187 | 36.84 |
Summary and conclusions
The main goal of this work is to constrain the evolutionary state of the giant H ii region NGC 604. For this purpose, we have analyzed the integrated ultraviolet spectra taken by IUE, and optical ground-based spectra of the region. The data are interpreted using evolutionary synthesis models optimized for star forming regions. These data are complemented with ultraviolet and H images taken by HST with the WFPC2.
The ultraviolet image shows that the ionizing cluster is spatially spread in the inner 2020 arcsec, with the core of the cluster within a central nebular hole shell structure. The optical spectrum, as it is well known, is dominated by nebular emission lines from the surrounding photoionized medium. In contrast, the ultraviolet spectrum of the region is dominated by absorption lines formed in the stellar winds of massive stars. However, other photospheric stellar lines (the high order terms of the Balmer series and He i lines) are detected at optical wavelengths near the Balmer jump. The spatial distribution of the stellar cluster with respect to the nebular emission, allows to detect these lines in absorption in a spectrum corresponding to the inner 4 arcsec of the region, where the stellar light is maximized with respect to the nebular contribution.
The evolutionary state and the massive stellar content of the region is derived in a self-consistent way using evolutionary synthesis and photoionization models, applied to the ultraviolet resonance wind stellar lines, to the nebular emission-lines and to the higher-order terms of the Balmer series and He i lines in absorption. The three techniques applied suggest that the central ionizing cluster of NGC 604 is very young, 3 Myr old, with no evidence for an age spread. The overall properties suggest that the massive stars in the cluster were formed following a Salpeter or flatter IMF, with presence of stars more massive than 80 M.
Particular results from the modelling of the nebular emission lines include:
- The nebula is well described by a sphere of inner radius 20 pc and outer radius 110 pc (determined by the ionization front). This value is in agreement with the value derived from the surface brightness photometry of the H emission.
- The sphere is partially filled (filling factor 0.1) with ionized gas that is very tenuous, having electron density of 30 cm-3.
- [O i]6300 and [O iii]4363 emissions are well accounted for by photoionization.
Particular results from the modelling of the ultraviolet continuum are:
- The extinction affecting the stellar cluster is little, , if the LMC extinction law is used to derive the value, or if the Calzetti et al. (1994) extinction law is used. The 3 Myr instantaneous burst spectral energy distribution is well matched by the spectrum of NGC 604 corrected with any of these two extinction laws. The value of the extinction is similar to the average extinction, , derived for the gas by Churchwell & Goss (1999).
- The massive cluster provides a number of high energy photons that is enough to photoionize the whole nebula. Thus, within the limits of the integrated models that we develop for a uniform geometry, our results are compatible with most of the ionizing radiation being reprocessed in the nebula, with no significant escape of ionizing photons.
- The wind power provided by the massive stars of the cluster is enough to form the central hole structure where the core stellar cluster is located. However, it cannot provide all the wind power required for the formation of the (at least) five shell structures seen in the H image.
- The number of massive stars estimated is in agreement with that derived from photometric studies based on the detection of individual stars.
Acknowledgments
It is a pleasure to thank Gary Ferland and Claus Leitherer for kindly making their codes available, and Jaime Perea for the use of SIPL. Claus suggested that something should be done with those IUE spectra. We have benefited from estimulating and helpful discussions with members of the GEFE collaboration, in particular with Angeles Díaz, Jesús Maíz-Apellániz, Divakara Mayya, Guillermo Tenorio-Tagle, Elena Terlevich, Roberto Terlevich and José M. Vílchez. We are also indebted to Grazyna Stasińska for his detailed comments from a thorough reading of the paper. The IUE helpdesk have always been solicituous with our queries, in particular we acknowledge Pedro Rodríguez Pascual and Rosario González Riestra for support with the IUE spectra. HST images were retrieved from the ST-ECF HST archive.
References
- [] Calzetti D., Kinney A.L., Storchi-Bergmann T., 1994, ApJ, 429, 582
- [] Cassatella A., Altamore A., González-Riestra R., Ponz J.D., Barbero J., Talavera A., Wamsteker W., 2000, A&AS, 141, 331
- [] Charbonnel C., Meynet G., Maeder A., Schaller G., Schaerer D., 1993, A&AS, 101, 415.
- [] Churchwell E., Goss W.M., 1999, ApJ, 514, 188
- [] Cid Fernandes R., Dottori H.A., Gruenwald R.B., Viegas S.M. 1992, MNRAS, 255, 165
- [] Conti P.S., Massey P., 1981, ApJ, 249, 471
- [] Clayton C.A., 1988, MNRAS, 231, 191
- [] D’Odorico S., Dopita M.A., Benvenuti P., 1980, A&AS, 40, 67
- [] D’Odorico S., Rosa M., 1981, ApJ, 248, 1015
- [] Díaz A.I., Terlevich E., Pagel B.E.J., Vílchez J.M., Edmunds M.G., 1987, MNRAS, 226, 19
- [] Drissen L., Moffat A.F.J., Shara M.M., 1990, ApJ, 364, 496
- [] — , 1993, AJ, 105, 1400
- [] — , Roy J-R., Robert C., Devost D., Doyon R. 2000, AJ, 119, 688
- [] Ferland G.J., 1997, Hazy, a Brief Introduction to CLOUDY, University of Kentucky, Deparment of Physics and Astronomy Internal Report
- [] Freedman W.L., Wilson C.D., Madore B.F., 1991, ApJ, 372, 455
- [] García-Vargas M.L., Díaz A.I., 1994, ApJS, 91, 553
- [] — , Bressan A., Díaz A.I., 1995a, A&AS, 112, 13
- [] — , Bressan A., Díaz A.I., 1995b, A&AS, 112, 35
- [] — , González-Delgado R.M., Pérez E., Alloin D., Díaz A.I., Terlevich E., 1997, ApJ, 478, 112
- [] González Delgado R.M., Heckman T., Leitherer C., Meurer G., Krolik J., Wilson A.S., Kinney A.L., Koratkar A., 1998, ApJ, 505, 174
- [] — , García-Vargas M.L., Goldader J., Leitherer C, Pasquali A., 1999a, ApJ, 513, 707
- [] — , Leitherer C., 1999, ApJS, 125, 479
- [] — , Leitherer C., Heckman T., 1999b, ApJS, 125, 489
- [] González-Riestra R., Cassatella A., Solano E., Altamore A., Wamsteker W. 2000, A&AS, 141, 343
- [] Hawley S.A., Grandi S.A., 1977, ApJ, 217, 420
- [] Hippelein H., Fried J.W., 1984, A&A, 141, 49
- [] Hunter D.A., Baum W.A., O’Neil E.J., Lynds R., 1996, ApJ, 456, 174
- [] Israel F.P., van der Kruit P.C., 1974, A&A, 32, 363
- [] Kennicutt R.C., 1984, ApJ, 287, 116
- [] Kobulnicky H.A., Zaritsky D., 1999, ApJ, 511, 120
- [] Kwitter K.B., Aller L.H., 1981, MNRAS, 195, 939
- [] Leitherer C., 1997, in Waller W.H., Fanelli M.N., Hollis J.E., Danks A.C., eds., AIP Conf. Procs. 408, American Institute of Physics, New York, p. 119
- [] Leitherer C., Heckman T.M., 1995, ApJS, 96, 9
- [] — , Robert C., Drissen L. 1992, ApJ, 401, 596
- [] — , Robert C., Heckman T.M., 1995, ApJS, 99, 173
- [] — , Schaerer D., Goldader J.D., González Delgado R.M., Robert C., Foo Kune D., de Mello D.F., Devost D., Heckman T.M., 1999, ApJS, 123, 3
- [] — , Vacca W.D., Conti P.S., Filippenko A.V., Robert C., Sargent W.L.W., 1996, ApJ, 465, 717
- [] Lejeune T., Buser R., Cuisinier F., 1997, A&AS, 125, 229
- [] Luridiana V., Peimbert M., Leitherer C., 1999, ApJ, 527, 110
- [] Madau P., Ferguson H.C., Dickinson M.E., Giavalisco M., Steidel C.C., Fruchter A., 1996, MNRAS, 283, 1388
- [] Maíz-Apellániz, J., 1999, PhD Thesis, Univ. Complutense de Madrid
- [] Mas-Hesse J.M., Kunth D., 1999, A&A, 349, 765
- [] Massey P., Hutchings J.B., 1983, 275, 578
- [] McClure R.D., Racine R., 1969, AJ, 74, 1000
- [] Medina Tanco G.A., Sabalisck N., Jatenco-Pereira V., Opher R., 1997, ApJ, 487, 163
- [] Meynet G., Maeder A., Schaller G., Schaerer D., Charbonnel C., 1994, A&AS, 103, 97
- [] Morton D.C., 1967, ApJ, 147, 1017
- [] Muñoz-Tuñón C., Tenorio Tagle G., Castañeda H.O., Terlevich R., 1996, AJ, 112, 1636
- [] Peimbert M., 1970, PASP, 82, 636
- [] Robert C., Leitherer C., Heckman T.M., 1993, ApJ, 418, 749
- [] Rodríguez-Pascual P.M., González-Riestra R., Schartel N., Wamsteker W. 1999, A&AS, 139, 183
- [] Rosa M., D’Odorico S., 1982, A&A, 108, 339
- [] Rosa M., Joubert M., Benvenuti P., 1984, A&AS, 57, 361
- [] Rosa M., Solf J., 1984, A&A, 130, 29
- [] Sabalisck N.S.P., Tenorio-Tagle G., Castañeda H.O., Muñoz-Tuñón C., 1995, ApJ, 444, 200
- [] Schaerer D., Charbonnel C., Meynet G., Maeder A., Schaller G., 1993a, A&AS, 102, 339
- [] Schaerer D., Meynet G., Maeder A., Schaller G., 1993b, A&AS, 98, 523
- [] Schaller G., Schaerer D., Meynet G., Maeder A., 1992, A&AS, 96, 269
- [] Schmutz W., Leitherer C., Gruenwald R.B., 1992, PASP, 104, 1164
- [] Smith H.E., 1975, ApJ, 199, 591
- [] Stasińska G., Leitherer C., 1996, ApJS, 107, 661
- [] Stasińska G., Schaerer D., 1999, A&A, 351, 72
- [] Terlevich E., Díaz A.I., Terlevich R., González Delgado R.M., Pérez E., García-Vargas M.L., 1996, MNRAS, 279, 1219
- [] Vacca W.D., Robert C., Leitherer C., Conti P.S., 1995, ApJ, 444, 647
- [] Viallefond F., Goss W.M., 1986, A&A, 154, 357
- [] Vílchez J.M., Pagel B.E.J., 1988, MNRAS, 231, 257
- [] Walborn N.R., 1991, in Leitherer C., Walborn N., Heckman T., Norman C., eds, Massive Stars in Starbursts. Cambridge Univ. Press, Cambridge, p. 145
- [] Walborn N.R., Fitzpatrick E. L., 1990, PASP, 102, 379
- [] Yang H., Chu Y-H., Skillman E.D., Terlevich R., 1996, AJ, 112, 146