Deep X-Ray Observations of Supernova Remnants
G 359.10.5 and G 359.00.9 with ASCA
1. Introduction
Hard X-rays have opened a new window to see the Galactic center (GC) region. One of the remarkable discoveries is that a high-temperature ( 10 keV) thin-thermal plasma is prevailing over an 100 pc-radius region around the GC (Koyama et al. 1986, 1989, 1996; Yamauchi et al. 1990). The presence of the large-scale hot plasma suggests violent activities in the GC region in the past, although the origin is not yet clear. One of the relevant processes to produce such a high-temperature diffuse plasma would be multiple supernova explosions. In this context, X-ray observations of individual supernova remnants (SNRs) near to the GC may provide useful information not only on the SNR physics, but also on the origin of the GC plasma.
Since X-rays from SNRs are usually dominated in the low-energy band ( keV), and are easily absorbed by interstellar gas, an X-ray study of the SNRs near to the GC region is rather limited. High sensitivity and imaging capability in the hard X-ray band are required to detect SNRs behind a large absorbing medium, and to separate individual SNRs from the GC X-ray emissions, a complex diffuse plasma, binary sources, and the other stellar objects.
X-ray imaging spectroscopy also provides direct information on the nuclear synthesis, the total explosion energy and the age of SNRs, physical parameters of the surrounding interstellar environment, such as the density, its chemical compositions, and other related subjects: the star forming rate, the structure and the evolution in the central region of the Galaxy.
The ASCA satellite, having high sensitivity in the hard X-ray band ( keV) and high energy resolution, enables us to study more elaborate imaging spectroscopy than was possible with previous detectors. We conducted survey and pointing observations near to the GC region with the ASCA satellite, and found X-rays from radio SNRs, including new candidates. Among them, this paper reports on the first detailed X-ray information and analyses of two radio SNRs, G 359.10.5 and G 359.00.9.
G 359.10.5 was first identified as an SNR by a 4.9 GHz observation (Downes et al. 1979) and by a 10.55 GHz observation (Sofue et al. 1984). Uchida et al. (1992b) found a shell-like structure at 1.4 GHz surrounded by a 12CO ring. Comparing the 21 cm absorption feature of the 12CO ring with the Galactic rotation curve, they concluded the location of this SNR to be near to the GC. Although and Egger, Sun (1998) discovered X-rays from G 359.10.5 with ROSAT, the spectral parameters, such as the temperature and the chemical composition, are not well constrained, due to the poor statistics and limited energy resolution. Preliminary results of the ASCA observation on G 359.10.5 are found in Yokogawa et al. (1999).
G 359.00.9 was first identified as an SNR by a 10.55 GHz observation (Sofue et al. 1984) and by a 2.7 GHz observation (Reich et al. 1990), and was later found to have an incomplete shell at the 843 MHz (Gray 1994). Leahy (1989) first detected a partial shell of soft X-rays from G 359.00.9 with the Einstein satellite, but no spectral information was reported.
This paper presents more comprehensive ASCA results and analyses of these two SNRs. Particular care concerning the background subtraction was made to exclude any possible contamination of near-by bright X-ray sources and the GC plasma’s contribution, of which the X-ray flux differs from position to position.
We describe the observations and the method of data reduction in section 2, and the analyses in subsection 3.1 and subsection 3.2, for G 359.10.5 and G 359.00.9, respectively. Section 4 is devoted to results and discussions on the distances, chemical compositions and morphology of these SNRs, and also on a relevant subject, the origin of the GC plasma.
2. Observations and Data Reduction
The GC region was observed with the X-ray astronomy satellite ASCA (Tanaka et al. 1994). X-ray photons were collected with four XRTs (X-ray Telescopes; Serlemitsos et al. 1995) and simultaneously detected with four detectors on the foci, which are two GISs (Gas Imaging Spectrometers; Ohashi et al. 1996) and two SIS (Solid-state Imaging Spectrometers; Burke et al. 1991) cameras.
During observation of the most prominent radio filament (the Snake) made on 1997 March 20–22, G 359.10.5 was located in the GIS field (see figure 1). However, it was only partially covered with the SIS field (see figure 3), in which 2-CCD chips for each SIS were operated with the faint or bright modes, depending on the high or medium bit rates. Since the 2-CCD data were significantly degraded by the Residual Dark Distribution (RDD) noise (T.Dotani et al. 1997, ASCA News 5, 14), we applied the RDD correction technique, which is only possible for faint-mode data.
G 359.00.9 was in the GIS field when the ASCA was pointing at the region of an unusual radio source the “Mouse” (Yusef-Zadeh, Bally 1987) and X-ray bursters SLX 1744299/300 on September 12–14 in 1998 (see figure 4). In this observation, because SIS was operated in the 1-CCD mode, G 359.00.9 was totally out of the SIS field.
In both observations, the GISs were always operated in the normal PH mode. We excluded high-background data and non-X-ray events with the standard method according to the user guide by NASA Goddard Space Flight Center (GSFC). In total, the available exposures are 80 ks of the GIS, and 35 ks of the SIS for G 359.10.5, and 57 ks of GIS for G 359.00.9.
3. Analyses
3.1. G 359.10.5
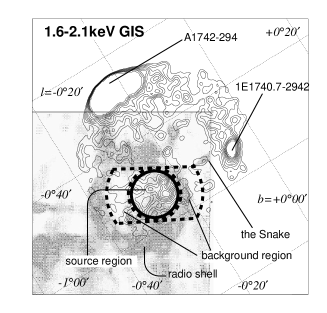
We found X-rays from the position of the radio SNR G 359.10.5 only in soft X-ray bands below about 3–4 keV. Figure 1 shows the GIS contour map in the energy of 1.6–2.1 keV, in which band diffuse X-ray excess inside the radio shell is most clearly seen. In the hard X-ray band above 3 keV, on the other hand, we found no significant X-rays, neither along the radio shell nor in the center of the radio SNR. We also note that no significant X-rays were found from the Snake, the most prominent radio non-thermal filament (Uchida et al. 1992b).

Since we found soft X-rays only from the center region surrounded by the radio shell, we made the GIS spectrum of the SNR center, accumulating X-ray photons from GIS 2 and 3 in the X-ray bright region of a 6′-radius circle, as shown by the solid line in figure 1.
As the background, we used the dotted line region in figure 1. This background region was carefully selected so that (1) possible contamination from the two nearby bright sources, A 1742294 and 1E 1740.72942, would be precisely subtracted and (2) the contribution of the Galactic center plasma, distributed symmetrically around the GC, could be properly subtracted. For the two requirements, the angular distances of the background region from the GC and the other two bright sources were taken to be nearly the same as those of the source region. The background-subtracted spectrum of GIS 2+3 is given in figure 2. We have checked the GIS energy scale by using the 1.86 keV Si line in the Galactic diffuse spectrum, since a long-term variation of a few percent level has been reported by Miyata (1996) and Yamauchi et al. (1999). In this observation, we found that the GIS energy scale was very accurate with errors of less than 1%.
In the spectrum of G 359.10.5 (figure 2), we can notice two prominent emission lines at about 1.9 and 2.6 keV. To determine the accurate energy of the lines, we first fitted the spectrum to a thermal bremsstrahlung (for continuum) and two Gaussian lines with an interstellar absorption. The abundance for the interstellar gas was assumed to be solar, and the absorption cross sections were taken from Morrison and McCammon (1983) (hereafter, we refer to these absorption cross sections unless otherwise mentioned).
The best-fit center energies for the two lines were determined to be 1.86 keV and 2.61 keV (here and after, the errors are 90% confidence, unless otherwise mentioned). These line-center energies are consistent with those of K emission from helium-like silicon (He-like Si; 1.86 keV) and hydrogen-like sulfur (H-like S; 2.63 keV); hence, the observed line structures are attributable to these highly ionized atoms. The best-fit line energies, on the other hand, are different from those of H-like Si (2.00 keV) and He-like S (2.45 keV).
Although the presence of K-shell lines of He-like Si and H-like S supports that the SNR X-rays are due to a thin thermal plasma, these two lines can hardly coexist in a single-temperature plasma, because ionization of sulfur atoms requires a higher temperature than that to ionize silicon atoms. In fact, we can reject any single-temperature plasma model, even though allowance is made for a non-ionization equilibrium or a non-solar abundance plasma. Therefore, we applied a two-temperature model (MEKAL: the plasma code established by Mewe et al. (1985) and Kaastra (1992)) with a common interstellar absorption. The abundances of Si and S in each plasma were treated to be free parameters, whereas those of the other elements were fixed to the solar values (Anders, Grevesse 1989).
This model is statistically accepted within the 90% confidence level. The best-fit model and parameters are given in figure 2 and table 1, respectively. A remarkable result is that the sulfur abundance in the higher temperature plasma (here component 2) is larger than 40 of solar.
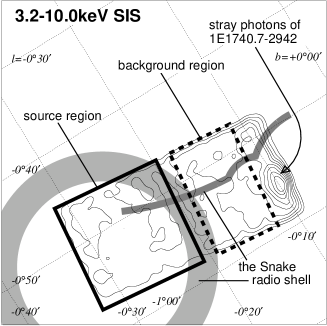
Since SIS has a better energy resolution than GIS, a high-quality spectrum should be provided with SIS. However, as shown in figure 3, the SIS contour map in the 3.2–10.0 keV band, the relevant SIS field (2-CCD mode) covers only limited parts of the SNR. Furthermore, most of the SIS field is occupied by either G 359.10.5 or 1E 1740.72942. Therefore, a proper background region, which is free from contamination of the bright source 1E 1740.72942 and contains the same diffuse GC emission as that in the source region, is not available in the present SIS field. Consequently, we concentrate on analyses of the emission-line structure, which is less sensitive to the background flux. Fortunately, we found that the contamination source, 1E 1740.72942, exhibits no significant emission line (Sakano et al. 1999a). We then selected the source and the background regions as indicated by the solid and dotted lines in figure 3. As already noted, the surface brightness of the Galactic center diffuse X-rays decreases as the distance from the GC increases; hence, the simple background subtraction in the present case may cause an over-subtraction of the diffuse background. We therefore derived the iron-line fluxes from both the source and the background regions. The spectrum of the background region was subtracted from that in the source region, after normalizing the effective exposure by the iron-line flux ratio. These procedures are justified, because strong iron lines with a nearly constant equivalent width have been reported from the GC plasma (Koyama et al. 1989; Maeda 1998).
To the background-subtracted spectrum, we fitted a model of 4 Gaussians and a power-law spectra with an absorption, of which the latter is simply a phenomenological model to represent the continuous spectrum. The center energies of the Gaussian profiles were fixed to the theoretical values of He-like Si, H-like Si, He-like S, and H-like S. The absorption column density was fixed to the best-fit value of the GIS analyses (see table 1). The best-fit fluxes, the ratios and most probable plasma temperatures under the assumption of ionization equilibrium are listed in table 2 (Mewe et al. 1985).
From this table, we can see that the plasma temperatures determined with Si and S are different from each other, and are consistent with those found in the GIS spectrum.
To examine whether these two temperature plasmas have different spatial structures or not, we made the GIS and SIS images in the 1.6–2.1 keV and 2.1–3.2 keV bands; the former may represent the image of component 1, and the latter is for component 2. However, no significant difference between these two energy band images was found.
3.2. G 359.00.9
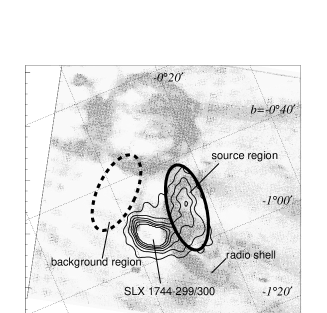
We made the X-ray images in several energy bands and found that X-rays from G 359.00.9 were detected only below 3 keV. The GIS contour map of G 359.00.9 in the soft X-ray band (0.7–1.5 keV) is shown in figure 4. Diffuse X-rays were clearly detected from the radio incomplete shell, although the X-ray shape is distorted by the bright X-ray sources SLX 1744299/300. For a spectral study, we selected the source and background regions as given in figure 4. The selection criteria of the background region are the same as those of G 359.10.5; the angular distances of the background region from the GC and from SLX 1744299/300 are the same as those of the source region.
We also examined any possible error of the GIS energy scale, as was done in the G 359.10.5 analyses, and found that the GIS energy is smaller than the proper value by about 2%, and hence made a fine tuning of the energy scale to the spectrum. The background-subtracted (and energy-scale tuned) spectrum is shown in figure 5. As expected from the multi-band X-ray images, most of the X-rays fall below 3 keV. Because the spectrum exhibits two clear lines, we applied a model of a thermal bremsstrahlung and two Gaussian profiles with an absorption, and determined the center energies to be 1.36 keV and 1.86 keV. Since these best-fit center energies are consistent with those of the K lines from He-like Mg at 1.35 keV and He-like Si at 1.86 keV, the origin of the X-rays is a thin thermal plasma. We therefore applied a thin thermal plasma model, MEKAL, with an absorption, and fixing the abundances of all elements to be solar [“model (a)”]. The best-fit model spectrum and parameters are shown in figure 5 and table 3, respectively.

This model is, however, rejected with a reduced chi-square of 49.8/38, leaving bump-like and dip-like residuals around 1.3 keV and 1.0 keV, respectively (figure 5). Since these energies correspond to the emission lines of a He-like Mg and Fe-L line complex, we separately treated the abundances of Mg and Fe to be free and fitted the spectrum again [“model (b)” and “(c)”]. The best-fit spectra and parameters are given in figure 6, figure 7, and table 3 for models (b) and (c), respectively.


Although both the models (b) and (c) are acceptable, we further tried to fit the spectrum by treating the abundances of both Mg and Fe to be independent free parameters. However, the best-fit abundances have large errors, due to the limited statistics and the coupling of the He-like Mg line and Fe-L lines within the energy resolution of GIS. Therefore, we conclude that the plasma of G 359.00.9 is non-solar abundance, meaning that either Mg is over-abundant or Fe is under-abundant.
4. Results and Discussions
4.1. G 359.10.5
G 359.10.5 is found to exhibit a large absorption column of H cm-2. Since G 359.10.5 is reported to be surrounded by the 12CO ring for a total mass of about (Uchida et al. 1992b), local absorption due to the 12CO ring may not be ignored. Assuming that the 12CO ring is a homogeneous shell with nearly the same shape of the G 359.10.5 radio shell, the absorption column due to the 12CO ring is estimated to be H cm-2. Therefore, we infer that the column density of the foreground interstellar matter is about H cm-2. This value is equal to that of other X-ray sources near to the GC with the same Galactic coordinate of this SNR (Sakano et al 1999b); hence, this SNR would really be located near to the GC region with a distance of about 8.5 kpc. Thus, the diameter of the radio shell is estimated to be 57 pc, while that of the X-ray emitting central sphere is 28 pc.
We found that G 359.10.5 has at least two temperature plasmas; the cooler plasma (component 1) is abundant in Si, whereas the hotter one (component 2) is extremely over abundant in S. The center-filled thermal X-rays imply that these plasmas originated from the ejecta. Assuming a 28 pc-dimameter of spherical plasma of uniform density with a filing factor of 0.1, we estimate the total mass of Si and S to be about and , respectively. However, no current theory of nucleosynthesis in supernova explosions predicts such a large mass of S compared to Si (see e.g. Thielemann et al. 1996). This problem can be solved by assuming a smaller filling factor of S than that of Si; a smaller filling factor of S, less than 0.1, reduces the total mass of S to be acceptable for the model of Thielemann et al. (1996).
The context of the very small filling factor and the extreme richness of S lead us to suspect that the S-rich plasma is a “shrapnel” ejected from the massive progenitor of G 359.10.5, in analogy of the Vela SNR (Aschenbach et al. 1995). However, the narrow band image including only the S-line (2.1–3.2 keV) shows no spatial structure like a “shrapnel”, mainly due to a lack of photon statistics.
Uchida et al. (1992a) argued that the 12CO ring surrounding the SNR shell was created by stellar winds and/or multiple supernovae of O-type stars, and that several radio sources clustered at the center of the SNR are possibly O-type stars. The X-ray spectrum of G 359.10.5 contains no clear emission line of Fe (see figure 2), and is thus consistent with the proposed O-star origin. However, we could not quantitatively predict on the mass of the progenitor because of a lack of photon statistics.
We found no shell-like X-ray from G 359.10.5, although the radio morphology shows an almost complete shell. Shell-like X-rays may originate either by (1) a synchrotron mechanism in a shell, or (2) a thermal plasma made by the shock wave.
The lifetime of X-ray emission in case (1) depends on the magnetic field. Generally, the GC region is known to have a stronger magnetic field than the other regions of our Galaxy. In particular, Robinson et al. (1996) observed Zeeman effects of three OH masers near to the shell of G 359.10.5, then directly estimated the magnetic field to be 0.4–0.6 mG, which is more than one order of magnitude larger than that in usual shell-likes SNRs (G). High-energy electrons to emit synchrotron X-rays have a lifetime of yr in an G field (e.g. Reynolds 1996); hence, those in the shell of G 359.10.5 should be much shorter than yr. From the large diameter of the G 359.10.5 shell of 60 pc, this SNR would be middle age, or typically yr. Thus, no synchrotron X-ray from the shell would be expected from this SNR.
The evolved age of G 359.10.5 makes a shock-heated shell rather cool, with a typical temperature of less than a few 100 eV. Furthermore, if the shell interacts with the dense 12CO ring, the X-ray emitting shell density becomes larger, and hence the cooling time is much shorter. Therefore, X-rays should be very soft, and should be entirely absorbed by the large interstellar gas column. Thus, the apparent lack of an X-ray shell of G 359.10.5 would be reasonable.
Rho and Petre (1998) proposed that SNRs with center-filled X-rays and a shell-like radio structure should be called “mixed morphology” (MM) supernova remnants. They show that the scale height of the MM SNRs’ distribution from the Galactic plane is smaller than that of shell-like SNRs in both radio and X-ray bands, and that many MM SNRs are located near to molecular clouds or H I clouds. G 359.10.5 is located near to the Galactic plane, and is surrounded by the 12CO ring (Uchida et al. 1992b). Thus, G 359.10.5 shares the common features of MM SNRs.
4.2. G 359.00.9
The best-fit column density of H cm-12 is smaller than that of the GC region (Sakano et al. 1999b). In fact, using the Galactic interstellar mass model by Olling and Merrifield (1998), and by Dame et al. (1987), we can estimate the distance to be 6 kpc. Hence, G 359.00.9 would not be in the GC region, but would be a foreground SNR.
The shell-like morphology and a thin-thermal spectrum in X-rays suggest that the shell is a shock-heated plasma. The plasma, however, shows a partial shell extending only 1/4 of a full circle. With the reasonable assumption that the supernova explosion was spherically symmetric, the apparent partial shell is attributable to an inhomogeneity of the interstellar medium; the direction to the X-ray emitting shell would have a higher density than the other directions, and would hence have a larger surface brightness than the others. For simplicity, we assume that the dense region covers str toward the partial shell; thus, 1/8 of the total explosion energy would be given in this direction. Using the 6-kpc distance, the diameter and X-ray luminosity of the partial shell are estimated to be 38 pc and erg s-1, respectively. Together with the observational temperature of 0.4 keV, we could solve the Sedov equation, and found that the total explosion energy (), density () of the interstellar medium (dense region) and the age () are erg, 0.5 cm-3, and 1.8 yr, respectively. Because the total mass of the X-ray emitting shell is about 40, most of them are attributable to the swept-up interstellar matter. Therefore, the result of the spectral fitting (in table 3) implies that the interstellar matter near to the G 359.00.9 is either over-abundant in Mg, or under-abundant in Fe.
4.3. Comments on the Galactic Diffuse Plasma
The GC region is surrounded by the large scale hot plasma, which emits fairly strong X-rays with many emission lines from He-like and H-like Si, S, Ar, Ca and Fe. The co-existence of highly ionized light elements (such as Si and S) and heavier elements (such as Ca and Fe) implies that the plasma is not a single temperature. Kaneda (1996) and Kaneda et al. (1997) confirmed the two-temperature structure of the Galactic ridge plasma, which shows a very similar spectrum to that of the GC region. In fact, Maeda(1998) found that the GC plasma has two-temperature components.
The low-temperature component ( 1 keV) would be the same as that found with ROSAT (Snowden et al. 1997). The plasma has a large-scale height of 1.9 kpc and a temperature of 0.30.4 keV. Kaneda et al. (1997) suggested that the soft components of the Galactic ridge originated from a multiple supernova explosion. From the spectral similarity, this scenario may be applied to the GC soft component. Then, can we find many individual SNRs which have a similar spectral shape? Because G 359.00.9 has a 0.4 keV temperature and strong emission line of Mg and Si, it is a possible candidate. The GIS flux at 0.5–10.0 keV of G 359.00.9 is erg s-1cm-2, while that of the GC plasma in a 25′ diameter field is erg s-1cm-2 (Kaneda 1996). We thus require about four G 359.00.9-like SNRs in this field. However, at this moment, the number density of the resolved X-ray SNRs or its candidates is far less than the requirement.
A more difficult issue is the origin of the high-temperature component. The temperature of 10 keV and the size of about 100-pc diameter are inferred by the observation of Ginga and ASCA GC surveys (Koyama et al. 1989; 1996). As far as we know, no SNR exhibits such a high temperature. In this sense, the high-temperature sulfur-rich plasma of G 359.10.5 is suggestive. If there are many G 359.10.5-like SNRs, with an enriched abundance of not only S, but also other elements in high-temperature plasmas, the integrated emission may contribute, at least, some fractions of the GC hot plasma. At present, we are still lacking any quantitative information of individual X-ray sources, like SNRs, near to the GC region. Thus, further systematic study is highly encouraged.
We would like to thank Dr.Y. Maeda for useful comments and discussion about G 359.10.5. We also thank the members of the ASCA team. This work was supported by the Research Fellowship of the Japan Society for the Promotion of Science for Young Scientists.
References
Anders E., Grevesse N. 1989, Geochim. Cosmochim. Acta 53, 197
Aschenbach B., Egger R., Trümper J. 1995, Nature 373, 587
Burke B.E., Mountain R.W., Harrison D.C., Bautz M.W., Doty J.P., Ricker G.R., Daniels P.J. 1991, IEEE Trans. ED-38, 1069
Dame T.M., Ungerechts H., Cohen R.S., de Geus E.J., Griener I.A., May J., Murphy D.C., Nyman L.-Å., Thaddeus P. 1987, ApJ 322, 706
Dotani T., Yamashita A., Ezuka H., Takahashi K., Crew G., Mukai K., the SIS team 1997, ASCA news 5, 14
Downes D., Goss W.M., Schwarz U.J., Wouterloot J.G.A. 1979, A&AS 35, 1
Egger R., Sun X. 1998, The Local Bubble and Beyond, Lyman-Spitzer Colloquium, Proceedings of the IAU Colloquium No.166, (Springer-Verlag, Berlin), ed D. Breitschwerdt, M.J. Freyberg, J. Trümper Lecture Notes in Physics, 506, 417
Gray A.D. 1994, MNRAS 270, 835
Kaastra J.S., 1992, An X-Ray Spectral Code for Optically Thin Plasmas version 2.0 (SRON, Leiden)
Kaneda H. 1996, PhD Thesis, The University of Tokyo
Kaneda H., Makishima K., Yamauchi S., Koyama K., Matsuzaki K., Yamasaki N.Y. 1997, ApJ 491, 638
Koyama K., Awaki H., Kunieda H., Takano S., Tawara Y. 1989, Nature 339, 603
Koyama K., Ikeuchi S., Tomisaka K. 1986, PASJ 38, 503
Koyama K., Maeda Y., Sonobe T., Takeshima T., Tanaka Y., Yamauchi S. 1996, PASJ 48, 249
Leahy D.A. 1989, A&A 216, 193
Maeda Y. 1998, PhD Thesis, Kyoto University
Miyata E. 1996, PhD Thesis, Osaka University
Mewe R., Gronenschild E.H.B.M., van den Oord G.H.J. 1985, A&AS 62, 197
Morrison R., McCammon D. 1983, ApJ 270, 119
Ohashi T., Ebisawa K., Fukazawa Y., Hiyoshi K., Horii M., Ikebe Y., Ikeda H., Inoue H. et al. 1996, PASJ 48, 157
Olling R.P., Merrifield M.R. 1998, MNRAS 297, 943
Reich W., Fürst E., Reich P., Reif K. 1990, A&AS 85, 633
Reynolds S.P. 1996, ApJ 459, L13
Rho J., Petre R. 1998, ApJ 503, L167
Robinson B., Yusef-Zadeh F., Roberts D. 1996, BAAS 28, 948
Sakano M., Imanishi K., Tsujimoto M., Koyama K., Maeda Y. 1999a, ApJ 520, 316
Sakano M., Koyama K., Nishiuchi M., Yokogawa J., Maeda Y. 1999b, Adv. Space Res. 23, 969
Serlemitsos P.J., Jalota L., Soong Y., Kunieda H., Tawara Y., Tsusaka Y., Suzuki H., Sakima Y. et al. 1995, PASJ 47, 105
Snowden S.L., Egger R., Freyberg M.J., McCammon D., Plucinsky P.P., Sanders W.T., Schmitt J.H.M.M., Trümper J., Voges W. 1997, ApJ 485, 125
Sofue Y., Handa T., Nakai N., Hirabayashi H., Inoue M., Akabane K. 1984, NRO report 33
Tanaka Y., Inoue H., Holt S.S. 1994, PASJ 46, L37
Thielemann F.-K., Nomoto K., Hashimoto M. 1996, ApJ 460, 408
Uchida K.I., Morris M., Bally J., Pound M., Yusef-Zadeh F. 1992a, ApJ 398, 128
Uchida K.I., Morris M., Yusef-Zadeh F. 1992b, AJ 104, 1533
Yamauchi S., Kawada M., Koyama K., Kunieda H., Tawara Y., Hatsukade I. 1990, ApJ 365, 532
Yamauchi S., Koyama K., Tomida H., Yokogawa J., Tamura K. 1999, PASJ 51, 13
Yokogawa J., Sakano M., Koyama K., Yamauchi S. 2000, Adv. Space Res. 25, 571
Yusef-Zadeh F., Bally J. 1987, Nature 330, 455
Table. 1 Best-fit parameters for G 359.10.5 for the model of two thin thermal plasmas with an absorption.∗
| Si/H† | S/H† | Flux (0.7–10.0 keV) | /d.o.f.‡ | |||
|---|---|---|---|---|---|---|
| Component | (keV) | (1022H cm-2) | (10-13erg s-1cm-2) | |||
| 1 | 0.6 (0.4–0.9) | 2.5 (1.2–8.4) | 0.9 | 5.9 (4.1–8.4) | 7.8 | 17.18/17 |
| 2 | 4.4 (2.2–13.2) | not determined | 38 | 5.9§ | 6.1 |
∗ Parentheses indicate 90% confidence regions for one relevant parameter.
† Abundance ratio relative to the solar value.
‡ d.o.f. degree of freedom.
§ Common with component 1.
Table 2. Best-fit Si and S line fluxes and most probable plasma temperature for G 359.10.5, using the SIS data.∗
| He-like | H-like | H-like/He-like‡ | ||
|---|---|---|---|---|
| (photons s-1cm-2) | (photons s-1cm-2) | (keV) | ||
| Si† | (–) | (–) | 0.16 (0.07 – 0.25) | 0.5 (0.4 – 0.5) |
| S† | () | (–) | 3.4 ( 0.29) | 1.7 ( 0.8) |
∗ Parentheses indicate 90% confidence regions for one relevant parameter.
† Best-fit values and relevant parameters determined with silicon or sulfur.
‡ Flux ratio between H-like and He-like K-shell lines.
§ Plasma temperature determined with the line flux ratio under the assumption of ionization equilibrium.
Table 3. Best-fit parameters for G 359.00.9 for thin thermal models.∗
| Mg/H† | Fe/H† | Flux (0.7–10.0 keV) | /d.o.f.‡ | |||
|---|---|---|---|---|---|---|
| Model | (keV) | (1022H cm-2) | (10-12erg s-1cm | |||
| (a) | 0.3 (0.3–0.4) | 2.0 (1.9–2.2) | 2.3 | 49.84/38 | ||
| (b) | 0.4 (0.3–0.5) | 1.7 (1.3–2.2) | 1.8 (1.5–2.0) | 2.4 | 40.92/37 | |
| (c) | 0.4 (0.3–0.5) | 0.1 ( 0.5) | 1.5 (1.1–1.8) | 2.4 | 41.18/37 |
∗ Parentheses indicate 90% confidence regions for one relevant parameter.
† Abundance ratio relative to the solar value.
‡ d.o.f. degree of freedom.