Abstract
Sun: irradiance, luminosity radius, sunspots, magnetic fields
keywords:
1 Introduction
When a sunspot group appears on the surface of the Sun, it reduce the brightness locally. Does this lead to an actual reduction of the Sun’s brightness as measured on earth (the so-called irradiance)? Or is the ‘missing flux’ re-emitted elsewhere on the solar surface? Faculae are bright areas, visible especially near the limb of the Sun. Do they contribute to the irradiance? Does the irradiance vary only because of spots and faculae, or are there other effects as well, and can these be large enough to influence climate on earth?
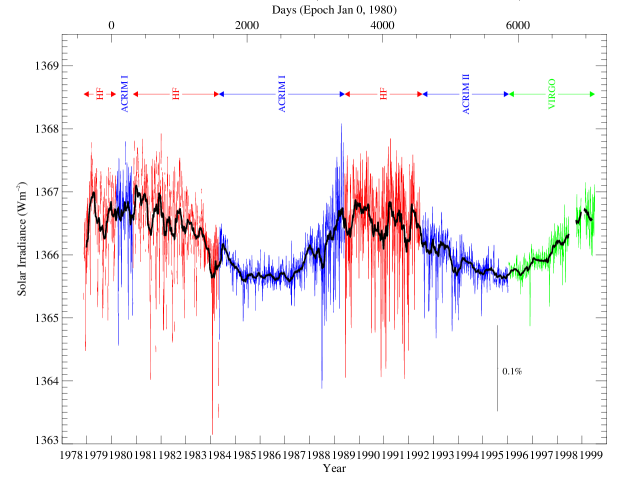
Some of these questions have been answered by actual measurements with space-base radiometers over the past 20 years (figure 1). The data show a clear variation, obviously correlated with the solar cycle: the solar magnetic field does indeed cause the Sun’s brightness to vary a bit, by about 0.1% between minimum and maximum of the cycle. The record shows prominent sharp dips; these are associated with the passage of individual sunspot groups across the disk. When a large group appears, the Sun actually does become dimmer by a tiny bit. The smoothed data (thick line in the figure) shows, however, that the average trend is the opposite: at maximum activity, the Sun is brighter.
The level of variation seen in figure 1 is not large, and by general opinion in the climate modeling community, insufficient to cause variations in the earth’s climate, by a factor of 10 or so (see the contributions in Nesme-Ribes et al., 1994, Friis-Christensen et al. 2000). Even if the Sun were to settle into a state of activity as seen during the minima in figure 1, the average reduction of irradiance by 0.05% would have negligible effects, and probably would not explain events like the so-called ‘little ace age’111A period during the 17th century when the climate in Europe was colder by a degree C or so. This cold spell appears to have been limited mostly to Western Europe, however..
For climate modeling, the record of figure 1 is too short. One would like to know what the irradiance has been in the past, during the last 10000 years, for example, so comparisons can be made with climate records such as have been obtained from ice cores in Greenland and the Antarctic (see the contributions Friis-Christensen et al. 2000). Is it conceivable, for example, that figure 1 shows only a fraction of what the solar magnetic field is capable of doing, and that variations of, say, 10 time larger amplitude could have been caused by the solar magnetic field, or something else that has not yet been discovered on the Sun? These are questions that can excite the imagination, including that of funding agencies.
In the absence of reliable independent indicators of the past brightness of the Sun, it is of some importance to understand how the variation seen in figure 1 come about. If theoretical understanding is sufficient, and accepted by the community, it may be possible to assess with more certainty whether irradiance variations larger than those seen so far are likely to have occurred in the past, and perhaps influence the climate.
Until the advent of helioseismology (see Dziembowski, elsewhere in this volume), our knowledge of the internal structure of the Sun was based on the theory of stellar structure and evolution. Since this theory is reasonably simple, confidence in the models was high even before helioseismological tests became possible. The main uncertainty had to do with the exact values of the opacity of stellar plasma. Increasingly accurate values for this were computed from first principles (atomic physics) by extensive numerical work. The basic correctness of the theory was then confirmed by helioseismology, to such an extent even that one is now confident that the ‘solar neutrino problem’ has its cause in neutrino physics, not inaccuracies in the solar models (e.g. Bahcall 1996, Richard et al. 1996, Brun et al. 1998).
Though these solar models are spherical and only slowly evolving in time, the theory behind them also apply to time dependent and non-spherical disturbances. In this form, the theory makes definite predictions about the thermal behavior of the Sun, that is, the evolution in time and position in the star of perturbations that might be related to the observed irradiance variations. In the following I present my view how this theory can be used to locate the most plausible source of irradiance variations. After this, I discuss how the new heliosmological measurements currently being made can be used to test the predictions of proposed mechanisms of irradiance variation.
Conceptually, one can separate the thermal effects of magnetic fields into three types:
1. ‘Sources and sinks’. The generation of a magnetic field involves the conversion of energy of motion into magnetic energy. Since the motions in the solar envelope are thermally driven, this ultimately means conversion of thermal into magnetic energy: building up a magnetic field produces a thermal sink somewhere. The opposite happens when the field decays: magnetic energy is converted into heat. These thermal effects exist only during changes in the magnetic energy content of the envelope.
2. ‘Shadows’, or changes in the heat transport coefficient. Magnetic fields interfere with convection, causing a reduction in the efficiency of heat transport in the envelope. In contrast to (1), these changes last as long as the magnetic field itself is present.
Both these sources and sinks, and changes in the transport coefficient cause thermal perturbations, varying with magnetic activity, which propagate through the envelope and cause variations in surface energy flux. Related to the second class of perturbations are:
3. The effects of magnetic fields at the surface of the star. Sunspots, being dark, radiate less than the surrounding photosphere, while the small elements that make up plages and the network have an excess emission. In addition, it is conceivable that the magnetic elements have an indirect effect surface by modifying the convective flow in their surroundings slightly (for which there is some observational evidence, see section 3.6).
2 Time scales
The response of the Solar envelope to thermal perturbations is not governed by a single time scale, but by a wide range of time scales. The longest of these is the thermal time scale of the Sun as a whole, called the Kelvin-Helmholtz time scale. It is about years, namely the thermal energy content of the Sun, of the order Joule, divided by its luminosity of W. Hence, on time scales of human interest, the Sun has an extremely large thermal inertia. If the central heat source of the Sun were switched off, the internal structure and the luminosity would start to change only on this long time scale.
The Kelvin-Helmhotz time scale is a global time scale for the Sun as a whole; more generally, we can define the thermal time scale as a function of depth:
| (1) |
where is the luminosity at depth , the thermal energy of the envelope down to a depth , and the thermal energy per unit volume, approximately (for an ideal gas of constant ) given by . This is the time scale on which the structure of the envelope, and the observed luminosity, would start changing when the heat flux in the star were interrupted, by some magical means, at depth . Some rough values for this quantity are yr at km (depth of the convection zone), 10 yr at km (the size of a supergranule), 10 hrs at km (size of a granule). This shows that the thermal time scale depends rather strongly on depth in the Sun. As a result, the thermal response of the Sun also depends critically on the location of the disturbance. Near-surface disturbances have much larger effects than ones orginating near the base of the convection zone.
A second kind of time scale involved in thermal readjustments is the diffusive time scale. This is the time scale on which differences in entropy between different parts of the convection zone are ironed out by the convective flows. This is easily computed in a ‘mean field’ or diffusion model for convection, in which the local convective heat flux is assumed to be a function of only the local conditions (thermodynamic state of the gas and the temperature gradient). The validity of this model is questionable, since it is now known that stellar envelope convection is in fact extremely non-local, with almost all flows generated by cooling at the stellar surface (e.g. Nordlund 1986, Stein and Nordlund 1989, for reviews see Nordlund and Stein 1996, Spruit 1997). The diffusion model has the advantage, however, that it is simple to apply, and is (unfortunately) still almost universally accepted. For these historical and practical reasons, I still use it for the estimates in this section. Estimates in the context of the new nonlocal view of envelope convection have not yet been developed to the same level of detail. I return to this in section 4, where the examples of heat flux blocking by sunspots and ‘thermal shadows’ are considered in the nonlocal convection picture. I argue there that the new nonlocal view only strengthens the conclusions based on the diffusion model.
For small perturbations, the heat flux in the local model is proportional to the entropy gradient, and time dependent perturbations are governed by a diffusion equation. The ‘turbulent’ diffusion coefficient in this equation is where and are the convective length scale and velocity. In mixing length models of the solar convective envelope, this quantity varies only weakly, at a value of the order cm2/s. In this model thermal inhomogeneities (more precisely: entropy inhomogeneities) of length scale are smoothed by turbulent diffusion on a time scale
| (2) |
For km this is about 1 yr, for km about 1 hr. Comparing and , we see that they are of similar magnitude close to the surface (to be precise: in the surface boundary layer where convection is not efficient enough to keep the stratification close to adiabatic). In deeper layers, the thermal time scale is much longer than the diffusive time scale, by a factor of up to .
The two time scales measure different types of thermal adjustment process. These same processes appear in the thermal behavior of, say, a chunk of metal, aluminum for example, heated from the inside and suspended in space. The thermal time scale is the time scale on which its temperature adjusts to a change in the heat input, such that the heat radiated from the surface into space balances the heat input again. It is determined by the heat capacity [ in eq. (1)] and the power level (). The time scale on which different parts of the chunk equilibrate to the same temperature is governed by a different process, namely thermal conduction (the equivalent of the turbulent diffusion in the Sun). The diffusion (conduction) time scale is much shorter than the thermal time scale, because of the large heat conductivity of Al. In the Sun, it is the very large turbulent diffusivity in the bulk of the convection zone that causes the very short diffusive time scale compared with the thermal time scale.
How do these different time scales come into play when the convection zone is thermally perturbed by, say, the storage of energy in a growing magnetic field? Such perturbations can be computed in detail, either by numerical methods (Endal et al. 1985) or more analytically. We can, for example, consider the initial value problem in which a perturbation is allowed to evolve in time by heat transport in the convection zone. In general this evolution has components on all the time scales of the problem, including the very long thermal time scale. Detailed calculations of this problem are discussed briefly in the next subsection (for a more complete analysis, see Spruit, 1982ab, 1991, Arendt, 1992).
2.1 Modes of thermal relaxation
In the mixing length approximation for convective energy transport the heat flux is given by:
| (3) |
where is the heat flux, the turbulent diffusivity, the density, the temperature and the entropy. The energy equation, in the absence of sources, is given in terms of the entropy by
| (4) |
As an example, consider the one dimensional problem in which all quantities depend on depth only. In this case, combining (3) and (4), and neglecting flows we get
| (5) |
where is the pressure scale height. For perturbations in which the left hand side is balanced by the first term on the right, the time scale is of the order , which is just a thermal time scale (cf. 1). For modes in which the left hand side is balanced by the second term, we evidently have an ordinary diffusion problem, hence these modes evolve on diffusive time scales. The first term has appeared as a consequence of the stratification of pressure, ie. the inhomogeneity of the convection zone. In a homogeneous medium (as in a chunk of Al), the thermal time scale comes in only through the radiating surface boundary condition (which one could also consider as a form of inhomogeneity). If is the surface temperature, this condition is
| (6) |
Since the perturbations in entropy outside spots and the magnetic elements making up the small scale field are small, the reponse of the convection zone can be computed by linearizing eqs. (3),(4),(6). An arbitrary initial perturbation may then be decomposed in the standard way in terms of the eigenmodes of the problem. These are found by setting , and solving for with the decay rate as eigenvalue (the problem thus defined has only decaying solutions). Specializing to the one dimensional case () one finds a series of modes ordered by the number of nodes of . The fundamental () has a decay rate of the order that is, this mode decays on the thermal time scale. The higher modes decay with rates of the order , they decay on diffusive time scales.
The extreme separation of time scales, yr for the thermal time scale and 1yr for the longest diffusive time scale (with ) leads to a simple picture. The high heat conductivity tends to keep the convection zone entropy uniform, so that sources and sinks of energy are shared by a large part of the convection zone. This large part of the convection zone has a large heat capacity, however, so that sources and sinks tend to spend their efforts in slow heatings and coolings of large amounts of mass, rather than propagating to the surface.
How do these different time scales come into play when the convection zone is thermally perturbed by, say, the storage of energy in a growing magnetic field? The evolution of such perturbations can be computed in detail, either by numerical methods (Endal et al. 1985, Gilliland, 1988) or more analytically. We can, for example, consider the initial value problem in which a perturbation is allowed to evolve in time by thermal transport in the convection zone. In general this evolution has components on all the time scales of the problem, including the very long thermal time scale. Formal aspects of this problem have been discussed elsewhere (Spruit 1982ab, 1991, Arendt 1992). In the following, the basic conclusions of these analyses are summarized.
3 Expected level of luminosity variations
For quantitative estimates, the strength of the field and its filling factor in the convection zone have to be specified. Assume that we have a layer of field with strength of the order of G (equipartition with the convective flows as estimated by a mixing length model), one scale height deep, near the base of the convection zone (where most of the magnetic flux is probably located). I summarize here some results, discussed in greater detail elsewhere (Spruit 1991).
3.1 sources-and-sinks
If the energy needed to build up the solar magnetic field during one half of the solar cycle is taken out of the thermal energy near the base of the convection zone, the calculations show that a surface luminosity variation of only results. This is due to the very large heat capacity of the lower convection zone. The effect is stronger if the source of the magnetic field is assumed to be closer to the surface, but is still much smaller than the observed effect. Recent models for the emergence of magnetic flux from the base of the convection zone (D’Silva and Choudhuri 1993, D’Silva and Howard 1993, Caligari et al. 1998) indicate that the actual field strength at the base of the convection zone is probably about 10 times higher than the equipartition estimate, of the order G. The magnetic energy per unit of magnetic flux is then also 10 times higher, but this still does not lead to a significant luminosity effect.
3.2 shadows
If magnetic fields interfere with convection, a thermal perturbation develops as well. If at some depth below the surface there is an area where magnetic fields reduce the convective flows, the surroundings will be affected thermally, and one might hope to see a ‘thermal shadow’ at the surface. This can again be computed in the diffusion assumption for convection (Spruit, 1977). The amplitude of the effect depends crucially on the ‘covering factor’. If a reduction of convective efficiency is assumed that uniformly covers a horizontal surface at some depth , magnetic fields comparable to equipartition with convective flows can have stronger effects than the source-and-sink perturbations (Gilliland, 1988). A measurable effect, however, is predicted only if the field is located close below the surface. At face value, this would make changes in convective efficiency a reasonable candidate for irradiance variations.
In practice, the effect is very strongly reduced, however, if the change in convective efficiency does not extend over an entire horizontal surface. If there are ‘holes’ in this cover, the effect is much smaller. This is because the turbulent heat conductivity in the convection zone is so high that the heat flux is easily ‘shunted’ past blocking objects below the surface (Spruit, 1977). Compare this with efforts to thermally insulate homes. To be effective, it is not enough that most of the building’s outer surface is very well insulated. A more modest insulation but without any leaks is more effective. For this reason, thermal shadows of subsurface fields are probably not very important (see also section 4.3).
3.3 surface effects
By far the most effective way in which a magnetic field influences the irradiance is by its effect on the net surface emissivity. The reduced emission from a sunspot area shows up directly in the irradiance records as a dip tracking the passage of the area across the disk. The only complication is that one might expect, depending on one’s prejudices, that part of this reduction could be compensated by a brightening elsewhere. For example in the form of a ‘bright ring’ surrounding the spot. Evidence of such bright rings is absent for most spots that have been studied for this effect, and where observation of a ring is reported, it compensates for only a small fraction of the spot blocking (e.g. Rast et al., 1999). Brightening of the photosphere around a spot is hard to measure because it is usually masked by facular emission, which is a different effect. Such faculae are part of all active regions. Though their excess emission is rougly of the same order as the spot deficit, this is a coincidence that does not hold any more on closer inspection. For example, they are present in the same amount in active regions with or without sunspots, and their contribution to the irradiance variation does not correlate very well with spot areas (Foukal and Lean 1986, Lean et al. 1998).
The absence of bright rings is understood in terms of a turbulent diffusion model for the heat flux in the convection zone (Spruit 1977, 1982b, Foukal et al. 1983, Chiang et al. 1984). The ‘blocked heat flux’, for the most part, does not reappear elsewhere on the surface, but stays inside the convection zone, being stored/released on the very long thermal time scale of the convective envelope. This conclusion holds, in the diffusion model, as long as the blocking effect of the spot extends to a depth of at least 1000 km, a mild requirement given that the observed Wilson depression of the umbra of a spot is already of the order of 500km.
3.4 spot blocking: stove top analogy
The absence of bright rings in the diffusion model can be understood by a kitchen analogy (for an improved, but more qualitative, model based on the new nonlocal view of convection, see section 4.1). Imagine a stove top with an electric heater plate. Assume this plate to be made of a massive block of a metal with a high thermal conductivity, Aluminum or Copper, say. Such a block, like the solar convection zone, has two time scales, the thermal time scale, given by the heat content divided by the heating rate, and the thermal conduction time scale given by the thermal diffusion time across the block. These are different physical quantities and their values can be quite different. If the thermal conductivity is large, the diffusion time scale can be much shorter than the thermal time scale. In the solar convection zone this is the same except that the ratio of time scales () is much more extreme.
Suppose the heater plate has been on and has reached a steady temperature, so that heat input balances the conduction/convection losses at the top. Suppose also that the ratio of time scales is sufficiently large. Then put a piece of thermally insulating material on top, covering part of the surface of the plate (as a model for the effect of a spot). Where does the blocked heat flux go? The answer is of course that it does not go anywhere, the blocked heat stays in the block, heating it up slowly, instead of being radiated at some other part of the surface. On account of the large thermal conductivity, the temperature in the block stays uniform, and almost no ‘bright ring’ appears around the spot. When the insulating spot is removed after a while, the heat flux returns to its old value instantaneously. The temperature has increased only slightly during the blocking phase, and this slight increase disappears again on a thermal time scale.
3.5 excess emission by small scale magnetic fields
Apart from the highly visible sunspots, the Sun has a small scale magnetic field consisting of a very large number of tiny magnetic elements. They are called faculae if their density is high, and ‘network’ at lower density, and collectively contain much more magnetic flux than sunspots. They are visible especially near the solar limb, showing that they radiate more isotropically than the limb-darkened normal solar atmosphere.
This excess emission has two components, one originating in somewhat higher atmospheric layers, in the form of line- and UV-continuum emission. This component probably is due to dissipation of mechanical (wave) energy carried by the magnetic field. In addition, there is a component seen in white light, originating in the surface layers of the magnetic structures. This second component is understood theoretically as a radiative transfer effect (Spruit 1977): the radiating surface in a magnetic element is a little ‘dimple’ in the surface. The large number of small magnetic elements effectively corrugates the surface, and makes it radiate both more effectively and more isotropically, just like a rough surface has a higher emissivity than a polished surface. This effect increases the radiative flux from any part of the surface where small scale magnetic fields are present. It is a net effect (predicted before observation, Spruit 1977) that is not balanced by a deficit somewhere else on the surface. Since the magnetic elements are so small, they are hardly resolved in the observations. Recent high-resolution observations (Topka et al. 1997), however, verify the picture predicted by flux tube models (Spruit 1976 figure 11, Steiner et al. 1997) for the appearance of small magnetic elements.
Since the effect of small scale fields is an increased emissivity, it increases the cooling rate at the surface.
3.6 changes in granulation in active regions
The changes of surface emissivity by magnetic fields discussed above are due to the different radiative properties of small magnetic elements (‘flux tubes’). More indirect effects may play a role as well. The shape of granules appears to be different in magnetic regions (Macris and Roesch 1983, Muller and Roudier 1984, Muller 1986, Title et al. 1992). They are smaller, more irregular, and the measured flow speeds are lower. These effects are present in addition to the magnetic elements themselves, which also change the appearance of granulation by filling in the intergranular lanes, especially when seen at low spatial resolution. The changes may be the result of the geometric constraints the magnetic tubes put on the convective flow outside them.
Since the flow appears to be different, it would seem possible that the heat flux it carries is also different. This might contribute to the observed solar cycle variations of irradiance (Muller 1986, Kuhn et al. 1988). Limits on this contribution can be put by observations of the colors of the solar cycle variation signal. Solanki and Unruh (1998) find that the wavelength dependence of the irradiance signal argues against a dominant contribution from small changes of surface temperature over a larger areas, but do not quote quantitative limits. In order to contribute in the right sense to the solar cycle variation, the constraints imposed on the flow by the magnetic flux elements would have to lead to an increase in the heat flux carried by granulation. Direct (spatially resolved) measurements of a heat flux change in granulation in magnetic regions are probably difficult, since the effect would be small and hard to separate from the enhanced emission from the magnetic elements.
Changes in surface heat flux by modified granulation, if they exist, will affect the convective envelope in the same way as the excess emission from the small scale magnetic field. They can also be represented by an effective change of the emissivity of the solar surface. In particular, one does not expect these changes to be ‘compensated’ by opposite changes elsewhere on the surface (except, as before, on the yr thermal time scale of the envelope).
4 Improving on the turbulent diffusion picture
In the results quoted a diffusion model for convection was used. It assumes that convection can be modeled by a turbulent viscosity for momentum and a turbulent diffusivity for the transport of heat. While this was a simple and somewhat justifiable model of convection in the absence of detailed knowledge of the convective flows in a stellar envelope, we now know that it does not represent stellar convective envelopes well. Numerical simulations (Nordlund 1982, 1985ab, 1986, 1990, Nordlund and Dravins 1990, Nordlund and Stein 1990, 1991, 1996, Stein and Nordlund 1989, 1991, 1998, Steffen et al. 1989, Steffen 1993, Ludwig et al. 1999) show an extremely nonlocal picture. The convective flows are driven almost exclusively by cooling at the surface, with narrow fast moving downdrafts between slow almost isentropic upflows (for a discussion see Spruit, 1997). In the present context, the most important property is that the convective flow at all depths is driven by cooling at the surface rather than by a local overturning process. The material in the cool downdrafts survives to large depths below the surface with little mixing into the upflows.
Given this extremely nonlocal picture, it is appropriate to ask how the thermal behavior of perturbations in the convection zone can be estimated without appealing to a turbulent diffusion model. I do this below for three of the effects discussed, the spot blocking, the facular emission, and the ‘thermal shadow’ problems. In all three cases, the conclusion is that thermal perturbations of the normal solar surface are even smaller than in the diffusion picture. This has to with the fact that the flows in the new non-local picture are caused by cooling at the surface, and that most of the changes are one-way (downward, away from the visible surface). The diffusion picture on the other hand communicates perturbations equally well in all directions.
4.1 spot blocking
Below the spot (modeled as a region of reduced heat transport efficiency extending to some depth below the surface) the upflows have exactly the same temperature as upflows in the unspotted surroundings at the same level, namely that given by the entropy at the base of the upflows. In this sense, there is no ‘pile up of heat below the spot’. Because of the reduced heat loss at the surface, however, the downflows below the spot will be less vigorous. The unspotted surface notices nothing of the spot’s presence (except for an extremely narrow ring where lateral radiative exchange takes place, and except for the presence of a moat flow, see below). It continues to cool upwellings into downdrafts as before, since the entropy in the upflows has not changed. Thus, we expect again that bright rings will be absent around spots, but the reason is even simpler than in the diffusion model. The spot is a region at the surface where less heat is radiated away, and this is now independent of the depth of the spot below the surface (in contrast to the diffusion model, where the spot has to extend to a minimum depth of 1000 km for the explanation to work).
Still, one may wonder what happens to the amount of heat generated in the solar interior that now fails to be emitted at the surface. This part of the problem is the same as in the diffusion model: the imbalance causes a secular increase of the entropy in the entire convection zone until a new thermal equilibrium is reached. Because of the very long thermal time scale of the convection zone ( yr), the effect is negligible on observable time scales. In a steady state, when the average number of spots does not change, the convection zone does not heat up, because its mean temperature is higher than it would be without spots (Spruit and Weiss, 1986). Episodes of larger than average spot coverage cause heating, those of less than average spot coverage cause cooling on this time scale.
4.2 facular emission
The lower internal pressure in a small magnetic element (‘tube’) in the photosphere causes it to be more transparent: a surface of unit optical depth as seen from earth has a little dimple at the loaction of the small magnetic element. Its side walls radiate an additional heat flux (Spruit 1976, 1977). This heat flux is supplied to the element by convection, i.e. by the granulation surrounding it, and conversely the side wall, by the extra radiation it emits, cools the surroundings. In a simple minded diffusion model for convection, this causes a dark ring around the element, which compensates for a part of the extra emission from the element. The cooling, however, also makes the photosphere next to the tube heavier, so that a circulation is set up: down along the tube walls, and towards the element at the surface. This effect has been studied with numerical simulations by Knölker et al. (1991, see also Steiner et al. 1998), who find a very fast downflow along the tube wall (km/s) due to the excess cooling. In a diffusion model, the information of the low temperature in the downdrafts diffuses back to the surface. In reality, the cool downdraft drops below the visible surface because it is heavy, and only a negligible fraction of it finds its way back to the surface. The excess emission is therefore expected to be stronger than in the diffusion model, and not compensated by a dark ring.
4.3 thermal shadows
The thermal shadow expected from a blocking object below the surface (Spruit, 1977), which is a small effect already in the turbulent diffusion model, is likely to be even smaller in the new picture of stellar envelope convection. Since all upward flowing gas has nearly the same entropy, a blocking object below the surface has no effect on what happens above it, as long as there is enough room above it for upflows to comfortably reach the solar surface. It may interfere somewaht with downflowing gas, but this has no consequence for the surface temperature above the blocking object, since only a small fraction of the downward moving gas is carried back up to the surface. As before, this is a consequence of the non-local nature of the convective flow.
5 Helioseismological tests
In the above I have concentrated on surface effects, and argued that temperature anhancements with origins deep inside the convection zone are less likely to contribute. Such deep origins have been advocated by Kuhn et al. (1988), and Kuhn and Stein (1996) who propose that a temperature enhancement with origin at the base of the convection zone causes a temperature enhancement of 0.5K in the active latitudes.
Potentially exhausing theoretical debates for or against these models can probably be circumvented since the models make different predictions for the associated perturbations below the surface that can be tested by observation. The excess radiation from small scale magnetic fields comes about through an increased surface emissivity, associated with the increased ‘surface roughness’. This increases the average cooling rate at the surface and creates somewhat stronger and/or cooler downdrafts. It therefore causes slightly lower horizontally averaged temperatures below the surface. The two models thus predict opposite thermal effects below the surface.
The prospects for a test of these predictions are good, since helioseismological data are now quite sensitive, with the data obtained by SOHO/MDI and the GONG network (Kosovichev 1996, Kosovichev and Schou 1997, Duvall et al. 1998, Duvall and Kosovichev 1999). Changes in the p-mode frequencies related to the solar cycle were reported by e.g. by Libbrecht and Woodard (1990), Dziembowski et al. (1998), and Dziembowski (this volume). The dependence of the signal on wavenumbers shows that most of the effect is due to a change in wave propagation in a layer very close to the solar surface, at the latitudes of magnetic activity. The sense of the effect, an increase of the frequencies, is the opposite (Goldreich et al. 1991) of what would be expected if the temperature in these latitudes were higher. Though a higher temperature increases the propagation speed (increasing the frequencies), it also expands the solar envelope at these latitudes, by vertical hydrostatic balance. This lengthens the path traveled and decreases the mode frequencies. The net effect turns out to be dominated by the the second effect, the path length increase, because it is linear in , while the propagation speed increases only as .
In addition to the thermal effect, the presence of the magnetic field also has an effect, since it increases the ‘stiffness’ of the gas (in terms of propagation, the relevant speed is the fast mode speed, which is larger than the sound speed). Since the contribution of this effect scales with the ratio of magnetic to gas pressure, it is important only in a thin layer near the surface. The observed changes in mode frequency can thus be due either to a somewhat lower temperature, or the effect of the magnetic field in the atmosphere. The observation that most of the effect is localized at the surface argues for a major contribution from the magnetic stiffness effect (Goldreich et al. 1991, Woodard et al. 1991). In any case, the observed sign of the effect is incompatible with enhanced temperatures being the main change in envelope structure in the active latitudes.
A second way of measuring variations in propagation conditions below the solar surface is through time-distance seismology (Duvall et al. 1996, Kosovichev 1996, Braun et al. 1997), in which one does not measure the mode frequencies but the wave travel times between points on the surface (much like seismology is used to measure irregularities in the earth’s interior). These measurements show shorter travel times in the active regions (Duvall et al. 1998, Duvall and Kosovichev 1998, Giles et al. 1997, Bogdan et al. 1998, Goode and Dziembowski 1999), and downflows below the surface. The shorter travel times are compatible with a contribution of the magnetic field to the propagation speed.
The lower temperatures expected by enhanced surface cooling in the small scale magnetic field has further observational consequences. In the absence of rotation, the increased downward buoyancy would just cause a downdraft below active regions. Associated with it a horizontal flow converging on the active region is expected. Effects like these are beginning to be explored by time-distance seismology.
References
- [] Arendt, S.: 1992, Astrophys. J 389, 421
- [] Bahcall, J.: 1996, Astrophys. J. 467, 475
- [] Bogdan, T. J., Braun, D. C., Lites, B. W.; Thomas, J. H.: 1998 Astrophys. J. 492, 379
- [] Braun, D.C.: 1997, Astrophys. J. 487, 447
- [] Brun, A. S.; Turck-Chièze, S., Morel, P.: 1998 Astrophys. J. 506, 913
- [] Caligari, P., Schuessler, M., Moreno-Insertis, F.: 1998 Astrophys. J. 502, 481
- [] Chiang, W. H. & Foukal, P. V.: 1984, Solar Phys. 97, 9
- [] D’Silva, S. & Choudhuri, A. R., 1993: Astron. Astrophys. 272, 621
- [] D’Silva & Howard, R. A.: 1993, Solar Phys. 148, 1
- [] Duvall, T. L., JR., Kosovichev, A. G., Scherrer, P. H.; Bogart, R. S., Bush, R. I., De Forest, C., Hoeksema, J. T., Schou, J., Saba, J. L. R., Tarbell, T. D., Title, A. M., Wolfson, C. J., Milford, P. N.: 1997 Sol. Phys. 170, 63
- [] Duvall, T., JR.; Kosovichev, A. G.; Scherrer, P. H.: 1998 in Sounding solar and stellar interiors, eds. J. Provost, F.-X. Schmider (IAU symposium 181, Nice, France, September 30 - October 3), Dordrecht: Kluwer Academic Publishers
- [] Duvall, T.L., Jr., Kosovichev, A.G.: 1999:,in SOHO-9 Workshop ”Helioseismic Diagnostics of Solar Convection and Activity”, Stanford, California, July 12-15,
- [] Dziembowski, W.A., Goode, P.R., Di Mauro, M.P., Kosovichev, A.G., Schou, J., 1998 Astrophys. J. 509, 456
- [] Endal, A.S., Sofia, S. and Twigg, L.W.: 1985, Astrophys. J. 290, 748
- [] Foukal, P. V., Fowler, P., & Livshits, M.: 1983, Astrophys. J. 267, 863
- [] Foukal, P.V., Lean, J.: 1986, Astrophys. J. 302, 826
- [] Fröhlich, C. & Lean, J.: 1998, Geophys. Res. Let. 25, 4377–4380
- [] P.M. Giles, T.L. Duvall Jr., P.H. Scherrer, & R.S. Bogart, 1997, Nature 390, 52–54. 1999.
- [] Gilliland, R. L., 1988, in Solar radiative output variation, P. Foukal, ed., Cambridge Research & Instrumentation Inc., 21 Erie st. Cambridge, MA 02139, p239
- [] Goldreich, P., Murray, N., Willette, G., Kumar, P., 1991, Astrophys. J., 370, 752
- [] Goode, P.R., Kuhn, J.R., 1990, Astrophys. J. 356, 310
- [] Goode, P.R., Dziembowski, W.A.: 1999, in SOHO-9 Workshop ”Helioseismic Diagnostics of Solar Convection and Activity”, Stanford, California, July 12-15, 1999.
- [] Knölker, M., Grossmann-Doerth, U., Schüssler, M., Weisshaar, E.: 1991, Adv. Space Res. 11, 285
- [] Kosovichev, A.G.: 1996, Astrophys. J. 461, L55
- [] Kosovichev, A.G., Schou, J.: 1997, Astrophys. J. 482, L207
- [] Kuhn, J.R., Libbrecht, K.G., Dicke, R.H.: 1988, Science 242, 908
- [] Kuhn, J.R., Stein, R.F.: 1996, Astrophys. J. 463, L117
- [] Lean, J.L., Cook, J., Marquette, W., Johanneson, A.: 1998, Astrophys. J. 492, 390
- [] Libbrecht, K. G., Woodard, M. F.: 1990, Nature 345, 779
- [] Ludwig, H.-G., Freytag, B., Steffen, MA.: 1999 Astron. Astrophys. 346, 111
- [] Macris, C.J., and Roesch, J., 1983, Comptes Rendus, ser II, 296, 265
- [] Muller, R., 1986 Solar Phys., 119, 229
- [] Muller, R., Roudier, T., 1984, in The Hydromagnetics of the Sun, ESA SP ESA SP 220, p. 51
- [] Nesme-Ribes, E. (ed.), 1994, The solar engine and its influence on terrestrial atmosphere and climate, NATO ASI I25, Kluwer
- [] Nordlund, Å., 1982, Astron. Astrophys. 107, 1
- [] Nordlund, Å., 1985a, in Small scale dynamical processes in quiet stellar atmospheres ed. W. Keil, Sacramento Peak Observatory, Sunspot, NM 88349, USA
- [] Nordlund, Å., 1985b, in Progress in stellar spectral line formation theory, eds. J.E. Beckman and L. Crivellari (NATO ASI series 152), Reidel, Dordrecht, p. 215
- [] Nordlund, Å., 1986, Solar Phys., 100, 209
- [] Nordlund, Å., 1991, in Stellar atmopheres: Beyond classical models, eds. L. Crivellari, I. Hubeny and D.G. Hummer (NATO ASI series 341), Kluwer, Dordrecht, p. 61
- [] Nordlund, Å. & Dravins, D., 1990, Astron. Astrophys. 228, 155
- [] Nordlund, Å. & Stein, R.F., 1990, Comp. Phys. Comm. 59, 119
- [] Nordlund, Å. & Stein, R.F., 1991, in Stellar atmopheres: beyond classical models, eds. L. Crivellari, I. Hubeny and D.G. Hummer (NATO ASI series 341), Kluwer, Dordrecht, p. 263
- [] Nordlund, Å. & Stein, R.F., 1996, in Proceedings of the 32nd Liège Int. Astrophys. Colloquium ‘Stellar Evolution: What should be done’, eds. A. Noels et al. p.75
- [] Richard, O., Vauclair, S., Charbonnel, C., Dziembowski, W.A.: 1996 Astron. Astrophys. 312, 1000
- [] Rast, M.P., Fox, P.A., Lin, H., Lites, B.W., Meisner, R.W., White, O.R., 1999 Nature 401, 678
- [] Solanki, S.K., Unruh, Y.C.: 1998, Astron. Astrophys. 329, 747
- [] Spruit, H.C., 1976, Solar Phys. 50, 269
- [] Spruit, H.C., 1977, Solar Phys. 55, 3
- [] Spruit, H.C. 1982a, Astron. Astrophys. 108, 348
- [] Spruit, H.C. 1982b, Astron. Astrophys. 108, 356
- [] Spruit, H.C. 1991, in The Sun in Time, eds. C. Sonett, M. Giampapa & M.S. Matthews, University of Arizona Press, Tucson, p118
- [] Spruit, H.C., 1992, in Sunspots: Theory and Observations, eds. J.H. Thomas and N.O. Weiss, Cambridge: CUP, p.163
- [] Spruit, H.C., 1997, Mem. Soc. Astron. It., 68, No. 2, p. 397
- [] Spruit, H.C. & Weiss, A., 1986, Astron. Astrophys. 166, 167
- [] Steffen, M., Ludwig, H.-G., Krüss, A.: 1989 Astron. Astrophys. 213, 317
- [] Steffen, M.: 1993, in Inside the stars (IAU Coll 137), eds. W. Weiss & A. Baglin, Astron. Soc. Pac. Conference series 40, p300
- [] Stein, R.F. & Nordlund, Å, 1989, Astrophys. J. 342, L95
- [] Stein, R.F. & Nordlund, Å, 1991, in Challenges to Theories of the Structure of Moderate-Mass Stars, eds. D.O. Gough and J. Toomre, Lecture Notes in Physics 388, Springer, Berlin, p195
- [] Stein, R. F., Nordlund, Å: 1998 Astrophys. J. 499, 914
- [] Steiner, O., Grossmann-Doerth, U., Knoelker, M.; Schuessler, M.: 1998 Astrophys. J. 495, 468
- [] Topka, K.P., Tarbell, T.D., Title, A.M., 1997, Astrophys. J. 484, 479
- [] Title, A.M., Topka K.P., Tarbell T.D., Schmidt, W., Balke C., Scharmer G., 1992, Astrophys. J. 393, 782
- [] Ulrich, R.K.,in New eyes to see…., F. Deubner et al., eds. IAU Symposium 185, 59
- [] Unruh, Y.C., Solanki, S.K., Fligge, M.: 1999, Astron. Astrophys. 345, 635
- [] Friis-Christensen, E. Fröhlich, C., Haigh, J., Schüssler, M. and von Steiger, R. (eds.): 2000, Proceedings ISSI workshop Solar Variability and Climate, Space Sci. Rev., Kluwer, in press.
- [] Woodard, M. F., Libbrecht, K. G., Kuhn, J. R., Murray, N.: 1991, Astrophys. J. 373, L81