ROSAT HRI monitoring of X-ray variability in the NLS1 galaxy PKS 0558–504
Abstract
We present the results of ROSAT High Resolution Imager (HRI) observations and the survey data of the radio-loud Narrow-Line Seyfert 1 galaxy (NLS1) PKS 0558–504. We find strong and persistent X-ray variability on both short and medium time-scales. The most extreme amplitude variations require a radiative efficiency exceeding the theoretical maximum for a Schwarzschild black hole, suggesting the presence of a rotating black hole or the influence of relativistic beaming effects. The spatial analysis rules out the possibility that the high luminosity and the strong variability are related to a nearby source.
Key Words.:
Galaxies: active – Galaxies: fundamental parameters – Galaxies: ISM – Galaxies: nuclei – X-rays: galaxies1 Introduction
Narrow-line Seyfert 1 galaxies are identified by their optical emission line properties: the ratio [O III]/H is less than 3 and FWHM H is less than 2000 (Osterbrock & Pogge 1985, Goodrich 1989). Their optical spectra are also characterized by the presence of strong permitted Fe II, Ca II, O I 8446 lines (Persson 1988). NLS1 exhibit characteristic features at other wavelengths as well: they are seldom radio loud (Ulvestad et al. 1995, Siebert et al. 1999, Grupe et al. 1999, 2000) and they are usually strong infrared emitters (Moran et al. 1996). In X-rays NLS1 have been generally found to have extreme spectral and variability properties that might be related to an extreme value of a fundamental physical parameter, originating from the vicinity of a supermassive black hole (e.g. Brandt & Boller 1998).
| Satellite | Reference | ||
| EINSTEIN | Elvis et al. (1992) | ||
| EXOSAT | 2.21 | Lawson et al. (1992) | |
| GINGA‡ | Remillard et al. (1991) | ||
| ROSAT | Brinkmann et al. (1997) | ||
| ASCA | Leighly (1999b) |
† Photon index taken from the EXOSAT observations.
‡ The values refer to quiescence and peak, respectively.
PKS 0558–504 () is one of the few radio-loud NLS1 galaxies (, Siebert et al. 1999). It was optically identified on the basis of X-ray positions from the High Energy Astronomy Observatory (HEAO-1, Remillard et al. 1986). A Ginga observation (Remillard et al. 1991) showed an increase of the X-ray flux by 67% in 3 minutes, implying that the apparent luminosity must be enhanced by relativistic beaming. Further X-ray observations with different satellites have confirmed the steep X-ray spectrum and high luminosity of this source, but no more relativistic flares have been presented in the literature. It is important to search for such flares with an X-ray imaging detector to definitively rule out the possibility that the Ginga data suffered from source confusion. Tab. 1 summarizes the luminosities, observed by previous X-ray instruments, converted to the ROSAT soft X-ray band. The conversion to luminosities in the 0.2–2.4 keV energy band was performed using PIMMS, assuming Galactic absorption ( = , Dickey & Lockman 1990) and a power law spectral model with photon index ranging between 2.1 (Remillard et al. 1991) and 3.1 (Brinkmann et al. 1997). However, possible deviations from a single power law or long term spectral changes can lead to systematic uncertainties. The measured soft X-ray spectrum is rather steep and the medium energy power laws are considerably flatter, but the sparse data do not allow determination of whether the source shows spectral steepening towards lower energies or whether long term spectral changes occur during intensity variations. The luminosities were calculated by assuming a Friedman cosmology with , and isotropic emission.
In this paper we report the results of two ROSAT HRI observation campaigns taken five months apart (in November 1997 and April 1998) and the survey PSPC data (September 1990), with the purpose to check whether the strong X-ray variability is persistent and whether a nearby source contributes to the X-ray flux. In section 2 we present the observations and the spatial analysis. Section 3 deals with the variability of PKS 0558–504. Section 4 contains the main conclusions.
2 Observations and spatial analysis
PKS 0558–504 was observed with the ROSAT HRI on November 18 1997, with an effective exposure of 2.14 ksec, and eleven times between April 19–25, 1998, with exposures ranging between 860 sec to 4.4 ksec. All individual observations of April 1998 have been merged with a final total exposure of 21.52 ksec (see Table 2). The data analysis was performed using standard routines within the EXSAS environment (Zimmermann et al. 1994). The count rates (vignetting and dead time corrected) quoted in Table 2, as well as the light curves, were obtained by extracting photons from a circle with 150″ radius around the source center and subtracting a background from a source-free region. In order to reduce the uncertainties from an extrapolation of a steep power law spectrum to low energies (0.1–0.2 keV) where the Galactic absorption is important, we base our discussion on the luminosities in the 0.2–2.4 keV band. As a result the fluxes and luminosities quoted in Table 2 represent lower limits only. For completeness, we also mention in the text the values obtained for the 0.1–2.4 keV energy band, which are typically a factor of two higher. The conversion factor between HRI count rates and luminosities, ( for 0.1–2.4 keV), was calculated by assuming a power law spectral model with the best fit parameters (, = ) of the PSPC spectrum.
| Obs. date | Exp. | cts/s | ||
|---|---|---|---|---|
| [s] | [] | [] | ||
| 11/18/97 | 2145 | |||
| total 4/98 | 21516 |
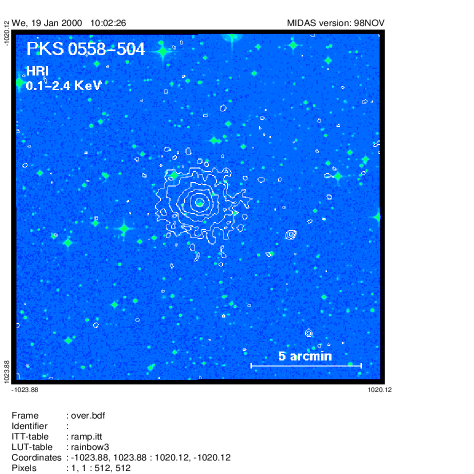
A peculiar property displayed by PKS 0558–504 is the unusually high ratio of X-ray to radio luminosity (Brinkmann et al. 1997), that might imply a contribution to the X-ray flux from a nearby source. To perform a spatial analysis we used all the April 1998 observations. A contour plot of the X-ray emission overlaid onto the optical image is shown in Fig. 1. The photons were binned in 2″2″ pixels and smoothed with a Gaussian with ″. The surface brightness profile is well fitted by the original HRI PSF-model convolved with an additional Gaussian to allow for the known smearing of the PSF by residual wobble motion, which can vary between different observations (Morse 1994). The equatorial coordinates of the centroid in the HRI image, computed from a Gaussian fit to the spatial distribution, are RA(2000)=, DEC(2000)=, in good agreement with the optical position, taking into account that the internal HRI position error is of the order of 5″. The only other X-ray source visible in the field of view is in the south-west of PKS 0558–504 at the position RA(2000)=, DEC(2000)=, with a mean count rate of 0.0021 , which corresponds to a flux of (assuming Galactic absorption and a power law spectral model with ). This object is classified as ‘Stellar’ with a magnitude of in the digitized COSMOS UKST southern sky survey. According to Maccacaro et al. (1988) its X-ray to optical flux ratio suggests that it is an AGN. This only additional X-ray source in the HRI field of view is nearly a factor 1000 fainter than PKS 0558–504, and no other strong X-ray source is found in the ROSAT survey within a radius of 2o. Therefore contributions from a previously unknown nearby source to the high luminosity and the strong variability can be ruled out.
3 X-ray variability

On the basis of the luminosities quoted in Tab. 1, no long-term X-ray variability by more than a factor of 4 has been seen from PKS 0558–504. Recent SAX and RXTE observations seem to confirm this picture (A. Comastri and K. Leighly, private communication). However, spectral variations and the extrapolation of steep power law spectrum to low energies can lead to uncertain luminosities, as pointed out by Brandt et al. (1999).
More reliable results can be obtained by comparing data from the same instrument. For instance, by comparing the mean count rates of the two HRI observations taken five months apart, we find an increase of the count rates by a factor 2.4, corresponding to a luminosity variation of ().
In Fig. 2 we show the total light curve for PKS 0558–504 during April 1998. The data points are binned into bins of 400 s, in order to avoid spurious count rate variations due to the ROSAT wobble. To characterize quantitatively the variability in the light curve, we calculated the excess variance (Nandra et al. 1997), . At first sight the most extreme count rate variation seems to occur during April 23 and 24, with , corresponding to (), calculated by performing a linear least square fit to that part of the light curve. However, if we consider the steep increase of the count rate on April 24 only, we obtain an even more extreme value of , leading to (). This value can be used to estimate the lower limit of the radiative efficiency: (Fabian 1979). Straightforward application of the limit gives ( for the 0.1–2.4 keV energy band), which exceeds the theoretical maximum for accretion onto a Schwarzschild black hole, but not onto a maximally rotating Kerr black hole. The extremely high efficiency, , derived from the Ginga 2–10 keV luminosities (Remillard et al. 1991) however, strongly indicates that some approximations used in the calculation of the efficiency limit must be relaxed, allowing uniform radiation release and relativistic effects in the vicinity of the black hole (e.g. Brandt et al. 1999).
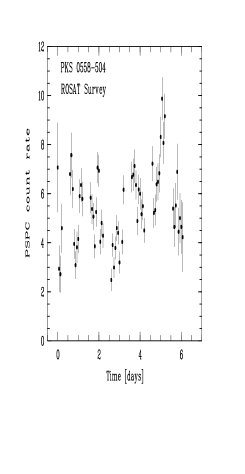
PKS 0558–504 was observed in the ROSAT All-Sky Survey between 1990 September 8 (10:58:02 UT) and 1990 September 14 (22:14:44 UT), with an effective exposure of 1036 s and an average count rate of . The light curve, shown in Fig. 3 (, exhibits variability by more than a factor of three with a maximum . From the PSPC count rates and the spectral parameters given below we obtain and , which are very similar to the values of the most extreme HRI event, but on a different time scale (the rest frame interval is h for the survey data and h for the HRI flare). As a consequence the values derived for the radiative efficiency are similar: for the 0.2–2.4 keV band and for the 0.1–2.4 keV band.
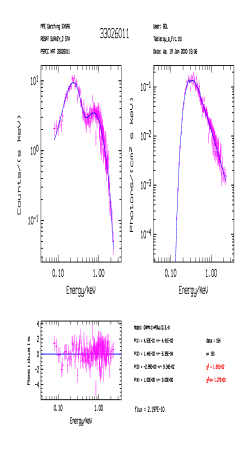
The spectrum can be fit with a single power law with photon index and free absorption of cm-2, in excellent agreement with the Galactic value. The residuals of this fit, given in Fig. 4, do not give strong evidence for deviations from a simple power law although there are indications at keV for some spectral changes. With these parameters the resulting unabsorbed fluxes during the survey observations are and , for the 0.2–2.4 keV and 0.1–2.4 keV energy bands, respectively, corresponding to and .
For several AGN, light curves with large amplitude flares have been interpreted as indication for non-linear processes (Green 1993, Boller et al. 1997, Leighly & O’Brien 1997). Given that the April 1998 light curve of PKS 0558–504 presents at least two large flares, we searched for non-Gaussianity (and possibly for non-linearity; see Leighly 1999a for a detailed discussion), by adopting the Green (1993) method: a time series is non-Gaussian if the ratio of its standard deviation to its mean is larger than unity. Using the data points in Fig. 2 we find that the unweighted mean count rate is 1.61 and the standard deviation 0.39 (). As a result we do not find evidence for non-Gaussian variability. However this method assumes that the sample mean and standard deviation used are accurate representations of the true mean and standard deviation, and this might not be true in our case, due to the limited number of observation intervals. The same conclusions were reached by Leighly (1999a) from ASCA data, using a different method based on the skewness of the flux distribution.
4 Conclusions
We have presented ROSAT HRI observations of the radio-loud NLS1 galaxy PKS 0558–504. The main results can be summarized as follows:
From the spatial analysis, no other strong X-ray sources have been detected in the neighborhood of PKS 0558–504, therefore external contributions to the high luminosity and to the strong variability from a nearby source are ruled out. By comparing the X-ray observations throughout the last decade, it is evident that the strong X-ray variability of PKS 0558–504 occurs persistently. During the ROSAT HRI observations, PKS 0558–504 shows strong variability, both on medium (months) and short (days, hours) time scales. The most extreme variation implies a radiative efficiency larger than the theoretical maximum for accretion onto a Schwarzschild black hole, and our findings generally support those of Remillard et al. (1991) where a relativistic flare was discovered. As PKS 0558–504 is a radio-loud object, beamed emission from a jet could be the cause for the brightness and variability in X-rays. However, it is worth noting that the radio-quiet NLS1 PHL 1092 has also shown a relativistic flare , and radio-quiet NLS1 more generally show enhanced X-ray variability. The soft X-ray spectrum is rather steep with a power law photon index of and shows no strong indications for spectral breaks. The obtained medium energy power laws are considerably flatter () but the sparse data and the limited energy bands of the different instruments do not allow determination of whether the source shows a spectral steepening towards lower energies or whether long term spectral changes occur during intensity variations. An answer to these vital questions can only be given by the current broad band X-ray missions like SAX, XMM-Newton or Chandra.
Acknowledgements.
The ROSAT project is supported by the Bundesministerium für Bildung, Wissenschaft, Forschung und Technologie (BMBF) and the Max-Planck-Gesellschaft. MG acknowledges support from the European Commission under contract number ERBFMRX-CT98-0195 (TMR network “Accretion onto black holes, compact stars and protostars”). WNB acknowledges support from NASA LTSA grant NAG5-8107.References
- (1) Boller Th., Brandt W.N., Fabian A.C., Fink H.H., 1997, MNRAS 289, 393
- (2) Brandt W.N., Boller Th., 1998, Astron. Nachr. 319, 7
- (3) Brandt W.N., Boller Th., Fabian A.C., Ruszwoski M., 1999, MNRAS 303, L53
- (4) Brinkmann W., Yuan W., Siebert J., 1997, A&A 319, 413
- (5) Dickey J.M., Lockman F.J., 1990, ARA&A 28, 215
- (6) Elvis M., Plummer D., Schachter J., Fabbiano G., 1992, ApJS 80, 257
- (7) Fabian A.C., 1979, Proc. R. Soc. London, Ser. A 366, 449
- (8) Goodrich R.W., 1989, ApJ 342, 224
- (9) Green A.R., 1993, PhD thesis, Univ. of Southampton
- (10) Grupe D., Beuermann K., Mannhein K., Thomas H.-C., 1999, A&A 350, 805
- (11) Grupe D., Leighly K. M., Thomas H.-C., Laurent-Muehleisen S. A., 2000 A&A in press (astro-ph/0001412)
- (12) Lawson A.J., Turner M.J.L., 1997, MNRAS 288, 920
- (13) Leighly K.M., O’Brien P.T., 1997, ApJ 481, L15
- (14) Leighly K.M., 1999a, ApJS 125, 297
- (15) Leighly K.M., 1999b, ApJS 125, 317
- (16) Maccacaro T., Gioia I.M., Wolter A., Zamorani G., Stocke J.T., 1988, ApJ 326, 680
- (17) Moran E.C., Halpern J.P., Helfand D.J., 1996, ApJS 106, 341
- (18) Morse J.A., 1994, PASP 106, 675
- (19) Nandra K., George I.M., Mushotzky R.F., Turner T.J., Yaqoob T., 1997, ApJ 476, 70
- (20) Osterbrock D.E., Pogge R.W., 1985, ApJ 297, 166
- (21) Persson S.E., 1988, ApJ 330, 751
- (22) Remillard R.A., Bradt H.V., Buckley D.A.H., Roberts W., Schwartz D.A., et al., 1986, ApJ 301, 742
- (23) Remillard R.A., Grossan B., Bradt H.V., Ohashi T., Hayashida K., et al., 1991, Nat 350, 589
- (24) Siebert J., Leighly K.M., Laurent-Muehleisen S.A. Brinkmann W., Boller Th., Matsuoka M., 1999, A&A 348, 678
- (25) Ulvestad J.S., Antonucci R.R.J. Goodrich R.W., 1995 AJ 109, 81
- (26) Zimmermann H.U., Becker W., Belloni T., et al., 1994, EXSAS User’s Guide, MPE Report 257