Gamma-loud quasars: a view with BeppoSAX
Abstract
We present SAX observations of the -ray emitting quasars 0836+710, 1510-089 and 2230+114. All the objects have been detected in the PDS up to 100 keV and have extremely flat power-law spectra above 2 keV (=0.3–0.5). 0836+710 shows absorption higher than the galactic value and marginal evidence for the presence of the redshifted 6.4 keV Iron line. 1510-089 shows a spectral break around 1 keV, with the low energy spectrum steeper (=1.6) than the high energy power-law (=0.3). The data are discussed in the light of current Inverse Compton models for the high energy emission.
KEYWORDS: quasars: individual (0836+710, 1510-089, 2230+114); radiation mechanisms: non-thermal; X-rays: galaxies
1. Introduction
Since the EGRET detection of about 60 blazars as strong -ray emitters the study of these extreme objects has received a renewed interest. The overall Spectral Energy Distribution (SED) of Blazars shows two broad components, the first one peaking at IR-up to soft X-rays, the second one in the -rays, from MeV up to TeV energies. The first peak is due to synchrotron radiation produced by relativistic electrons, while the high energy component is believed to be Inverse Compton scattered radiation. The seed photons for the IC scattering could be the synchrotron photons themselves (SSC model) or photons produced in the region external to the jet (EC model) which, especially for quasars with strong emission lines, is probably rich of optical-UV radiation. The subclass of quasar-like sources contains the most luminous sources, with apparent -ray luminosity up to erg s-1.
In the following we present the SAX observations of three gamma-loud quasars (0836+710, 2230+114 and 1510-089), detected up to 100 keV with the high energy instrument PDS, and we discuss the external Compton scenario. A full paper is in preparation (Tavecchio et al. 2000).
2. The observed objects
0836+710: this is a distant quasar (), characterized by a very flat X-ray spectrum, observed with ROSAT and ASCA. The ASCA observation showed a column density greater than the galactic value (Cappi et al. 1997).
2230+114: this source (), observed with GINGA, ROSAT and ASCA (Lawson & Turner 1997, Brinkmann et al. 1994, Kubo et al. 1998) shows a flat spectrum extending smoothly in the gamma-ray band, as indicated by OSSE observations (Mc Naron-Brown et al. 1995).
1510-089: this interesting Highly Polarized Quasar () shows a pronounced UV bump (Pian & Treves 1993). The EXOSAT observation (Singh et al. 1990) suggested the presence of a fluorescence iron line, not present in a more recent ASCA observation (Singh et al. 1997).
| d.o.f. | |||||
| keV | 1020 cm-2 | erg cm-2 s-1 | |||
| 0836+710 | |||||
| - | - | 26 | 63.47/63 | ||
| 2.98(fix) | 26 | 63.14/62 | |||
| 2230+114 | |||||
| - | - | 6.05 | 51.11/51 | ||
| 1510-089 | |||||
| - | - | 0-2.44 | 5.3 | 60.24/64 | |
| 7.8 (fix) | 5.3 | 43.06/63 | |||
| ∗: only for the broken power-law model | |||||
3. SAX Observations and results
We modelled the spectral data with either single or broken power-law models (with galactic and free absorption). Results of the spectral fits to the LECS+MECS+PDS data are shown in Table 1. In the following we discuss the results for each object.
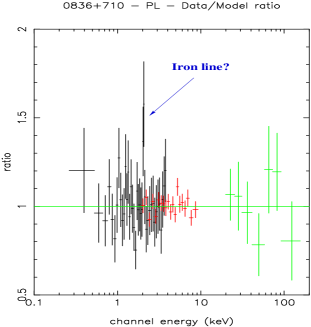
0836+710: the data are consistent both with a power-law model with intrinsicabsorption ( cm-2 in the QSO rest frame) and with a broken power-law model with fixed galactic absorption. With both models the residuals show an excess at about 2 keV, that could be interpreted as the redshifted fluorescence iron line (see Fig 1). Adding a gaussian line with energy as a free parameter the fit converges to an energy of with an intrinsic equivalent width of eV, but the significance of the improvement of the , evaluated with the F-test, is not very high ().
2230+114: A simple power-law model () with absorption consistent with the galactic value reproduces quite well the data in the whole range 0.1-100 keV.
1510-089: A simple absorbed power-law (although statistically acceptable, see Table 1) gives evident residuals at low energies. The -test confirms that a broken power-law is a better model (with a probability ). The PDS/MECS relative normalization (1.3-2.5 90% conf. level) is above the accepted range (0.77-0.93); this problem is possibly due to contamination by a source in the large FOV of PDS ( deg.). In the fit we fixed the normalization to 0.85.
| B | n | ||||||
| (cm) | (G) | (erg s-1) | (erg s-1) | (cm) | |||
| 0836+710 | |||||||
| 4 | 5.3 | 18 | 50 | 3.05 | 14.8 | 3.2 | 1.5 |
| 2230+114 | |||||||
| 4 | 3.7 | 15.5 | 130 | 3 | 0.14 | 0.4 | 1 |
| 1510-089 | |||||||
| 2 | 3.1 | 17 | 65 | 2.9 | 0.01 | 0.45 | 1. |
4. Discussion
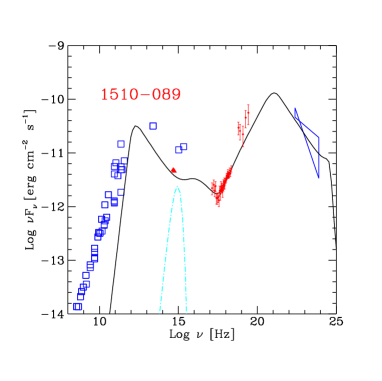
We constructed the SEDs of the observed sources using contemporaneous X-ray and optical observations and historical data taken from the literature (an example is reported in Fig.1) We have reproduced the observed spectrum using the homogeneous EC model discussed in detail in Ghisellini et al. (1998). In a spherical region with size , a power-law electron distribution (with slope and limits and ) is continuously injected with luminosity . Electrons cool through the synchrotron and IC processes and are free to escape from the source at some velocity , forming a flat () power-law below . We assume that the external radiation field is described by a black body spectrum with luminosity , diluted in a spherical region with size . The parameter values for the models are reported in Tab. 2.
It is interesting to note that the derived spectral indices in the medium to hard X-ray band are flatter than 0.5 in two out of three sources. A population of electrons cooling through synchrotron and IC forms a distribution which produce a spectrum with . Therefore some additional mechanism is required in order to produce the observed flatter spectrum, e.g. escape or injection of an intrinsically flat distribution (see e.g. Ghisellini 1996).
The excess of 1510-089 in the soft band is well understood as due to the SSC emission (see Fig.1), although another possible source is the tail of the strong UV bump.
We confirm the presence of absorption higher than the galactic one in 0836+710. The origin of this absorption is likely intrinsic to the source. The fluorescence iron line suggested by our data could be produced through reprocessing by the same material responsible for the absorption. On the other hand a broken power-law continuum with galactic absorption can reproduce the data equally well: in this case the break could be due to the incomplete comptonization of the soft external photons (see Ghisellini 1996).
REFERENCES
Brinkmann, W. & Siebert, J. 1994, A&A, 285, 812
Cappi, M., et al. 1997, ApJ, 478, 49
Ghisellini, G. 1996, IAU Symposia, 175, 413
Ghisellini, G., et al.1998, MNRAS, 301, 451
Kubo, H., et al. 1998, ApJ, 504, 693
Lawson, A. J. & Turner, M. 1997, MNRAS, 288, 920
McNaron-Brown, K., et al. 1995, ApJ, 451, 575
Pian, E. & Treves, A. 1993, ApJ, 416, 130
Singh, K. P., et al. 1990, ApJ, 365, 455
Singh, K. P., et al. 1997, ApJ, 491, 515