Detection of weak gravitational lensing distortions of distant galaxies by cosmic dark matter at large scales
∗ Bell Laboratories, Lucent Technologies, Murray Hill, NJ 07574
† Kitt Peak National Observatory, NOAO, Tucson, Arizona 85726
‡ Astronomy Department, University of Michigan, Ann Arbor, MI 48109
Most of the matter in the universe is not luminous and can be observed directly only through its gravitational effect. An emerging technique called weak gravitational lensing uses background galaxies to reveal the foreground dark matter distribution on large scales. Light from very distant galaxies travels to us through many intervening overdensities which gravitationally distort their apparent shapes. The observed ellipticity pattern of these distant galaxies thus encodes information about the large-scale structure of the universe, but attempts to measure this effect have been inconclusive due to systematic errors. We report the first detection of this “cosmic shear” using 145,000 background galaxies to reveal the dark matter distribution on angular scales up to half a degree in three separate lines of sight. The observed angular dependence of this effect is consistent with that predicted by two leading cosmological models, providing new and independent support for these models.
The large-scale distribution of dark matter depends both upon the nature of the dark matter and the global cosmological parameters that describe the universe. Information on the large scale distribution of matter is thus one of the primary goals of modern observational astronomy. To date, most of what we know about the large-scale structure of the universe comes from the observed anisotropies in the cosmic microwave background (CMB) and from the distribution of galaxies. The CMB provides the earliest sample of mass fluctuations, from a time when the universe was 100,000 times younger.[1] Different cosmological models predict different scenarios in the growth of mass structures over cosmic time, so comparison of the CMB-derived mass spectrum with that seen at later times will be a powerful test of cosmology. The large-scale mass distribution at late times has traditionally been characterized through the large-scale galaxy distribution, on the assumption that light traces mass.
The distribution of this dark mass can be investigated more directly via its gravitational effects on the appearance of background galaxies. Any foreground mass bends light rays from a distant source, moving the apparent position of the source to a new position on the sky and stretching its image tangentially, by an amount proportional to the foreground mass. This weak lensing effect has already been used to study the mass distribution within clusters of galaxies, where the large mass associated with the clusters makes the gravitationally induced ellipticity of the background galaxies easily detectable.[2, 3, 4, 5, 6, 7] In principle, weak lensing can also tell us about large-scale structure through the cumulative effect of many intervening overdensities. A deep image of a patch of the sky looks out through the three-dimensional forest of galaxies seen in projection: any two galaxies are most likely not physical neighbors and, absent lensing, their projected shapes or ellipticities are statistically uncorrelated. In the presence of foreground mass overdensities, the light rays from galaxies narrowly separated on the sky travel similar paths past intervening mass concentrations and thus undergo similar image distortions. The resulting correlation of distant galaxy ellipticities is highest at small angular separation and drops for widely separated galaxies whose light bundles travel through completely different structures (Fig. 1). Different cosmological models predict different behavior for correlations of galaxy ellipticites versus angle on the sky.
Theoretical expectations for this “cosmic shear” on 10-30 arcminute angular scales range from a few percent for standard cold dark matter to less than one percent for an open universe which would expand forever.[8, 9, 10, 11, 12, 13, 14, 15] The typical background galaxy has an intrinsic ellipticity of roughly 30%, so that many thousands of source galaxies must be averaged together to detect the small change induced by cosmic shear. In addition, a large area of sky must be covered, because mass structures should span a few arcminutes to a degree at a typical mid-path distance of redshift 0.4 (about three billion light-years). Earlier attempts to measure cosmic shear were inconclusive,[16, 17, 18, 19] with the main difficulty being control of systematic errors in galaxy shapes arising from the optical system or the process of observation. The earliest attempts with photographic plates, while covering a large field, suffered from plate-to-plate systematics as well as nonlinearity and lack of sensitivity. The sensitivity, linearity, and reproducibility problems were solved with the advent of charge-coupled devices (CCDs), but the small field size covered by early CCDs was a problem. Mosaics of large CCDs now approach the desired one-degree field size and are stimulating much activity in weak gravitational lensing.
We have imaged large areas of sky in several directions using a mosaic of CCDs on a large telescope, covering hundreds of thousands of distant galaxies at multiple wavelengths. We describe the steps taken to minimize systematic errors and to select 145,000 of the most reliable distant galaxy measurements. We find significant ellipticity correlations on angular scales of . This is the first direct probe of the aggregate mass distribution in the universe on the several billion light-year scale, and the results are consistent with two leading cosmological models.
Wide-field imaging with control of systematic shape errors
We observed three “blank” (i.e., not containing any known mass concentrations) fields at 23h48m, +00∘57′ J2000; 04h29m, -36∘18′; and 11h38m, -12∘33′ over a period of several years, using the Big Throughput Camera,[20] an array of four large, blue-sensitive CCDs at the Cerro Tololo Inter-American Observatory’s 4-m Blanco telescope. Constructed originally for weak lens observations, this camera covers a 35 arcminute field of view with 0.43 arcsecond pixels. We took multiple 500 second exposures shifted by 5-7 arcminutes and combined them to cover a 43 arcminute field. Before combining, we took several steps to reduce systematic errors arising from the optical system. First, we registered all the images onto a common linear coordinate system, free of the known radial distortion of the telescope optics. We then used the shapes of stars, which are foreground point sources free of the gravitational lensing effect, to correct any additional anisotropies in the point-spread function (the response of the optical system to point sources), such as those due to astigmatism and guiding errors. As described below, our observations covered multiple wavelengths; this enables filtering for certain types of stars and for distant galaxies.
The shape of a star or galaxy can be described by its second central moments, , , and , where is the intensity distribution above the night sky level, is a weight function, the sum is over a contiguous set of pixels defined as belonging to the galaxy, and the coordinate system has been translated so that the first moments vanish. The second moments can be combined to form a size, , and two components of a pseudo-vector ellipticity, and , which vary in the range (ellipticity in its colloquial sense is the amplitude of this pseudo-vector, with its range ). Traditional intensity-weighted moments are calculated with , but this produces ellipticity measurements with noise properties that are far from optimal or even divergent. In cases of white noise the formal optimal weight for an elliptical source is a noise-free image of that elliptical source.[21] In the absence of such an image, weak lensing measurements are generally made with circular Gaussian weights. We use an elliptical Gaussian as the weight function, which places more weight on the high-signal-to-noise inner parts of the galaxy image, and is nearly optimal for most point-spread functions and for typical exponential galaxy profiles.
The moments of the Gaussian weight ellipse are iterated (from initial values provided by unweighted moments) to match the size and shape of the object, in order to obtain the highest possible signal-to-noise and to insure that the measured ellipticity is not biased toward the shape of the weight function. This “adaptively weighted moments” scheme has been extensively tested on simulated and real data, and has been shown to be unbiased. On simulated data, the algorithm recovers a somewhat higher fraction of the artificially induced shear than does simple intensity weighting. However, our final results do not depend on this particular weighting scheme. Its real benefit lies in rejection of peculiar objects, the vast majority of which are overlapping galaxies seen in projection. If the final centroid of a galaxy differs significantly from the starting centroid, that galaxy is rejected. If the centroid does not shift, the galaxy is accepted (and probably suffers little contamination by its neighbor). Object candidates are also rejected if the centroid or the ellipticity fails to converge; if they are too near the edge of the image; if the size grows too large; or if the moments are negative. About one-third of candidates found by the detection software (which provides the initial unweighted moments, and can “detect” occasional noise peaks) are rejected. For candidates which survive, the measurement error in the final ellipticity is accurately estimated by propagating the Poisson photon noise through the moment equations.
We used foregound stars at many positions in the field of view to measure and correct for systematic ellipticity error. Stars are distinguished from galaxies by their clear separation at the bright end of a size–flux density diagram. We identified roughly 100 such stars on each exposure of each CCD and made a least-squares fit (with 3 clip) of a second-order polynomial to the spatial variation of their ellipticity components and , which would be zero at all points in an ideal observation free of point-spread function anisotropy. Fischer and Tyson[22] have shown that nonzero and can be cancelled by convolution with a small (three pixel square) flux-conserving kernel with ellipticity components equal and opposite to those of the stars. Simulations as well as weak lensing data on clusters of galaxies show that faint galaxy induced systematics are also removed in this process of circularising stars. We convolved each image with its resulting position-dependent circularising kernel, after which the stellar ellipticities show little variation as a function of position. We then combined the images by averaging with a 3 clip, and repeated the point-spread function rounding on the combined image (using roughly 1000 stars and a fourth-order polynomial in this case). Fig. 2 depicts the evolution of one of our worst raw images through this process.
Catalogues of distant galaxies
We repeated the observing and image processing for each field in three wavelength bands centered on 450 nm, 650 nm, and 850 nm,[23] and for two of the fields we also took 550 nm images. The mean exposure time at each wavelength was 3400 sec. In each field, we used standard software [24] to identify object positions and fluxes on the 650 nm image (which is the deepest image in each field), yielding roughly 150,000 objects per field. We have confirmed the robustness of the weighted intensity moments in our detected object catalogues by using different (FOCAS [25] with adaptive circular kernel [26]) detection and evaluation software. At each object’s position, we evaluated the weighted moments at each wavelength, retaining only the measurements which the iterative weighted moment algorithm did not flag as suspect. Measurements with small sizes ( or ) were also excluded as suspect. The result is a list of multiple independent ellipticity measurements (and corresponding estimated measurement errors ) for each object.
We then computed the best estimate of each galaxy’s ellipticity by averaging the remaining measurements, weighted inversely by their estimated errors. If either of the ellipticity components at any wavelength deviated from this mean by more than , that wavelength was eliminated and the process repeated. This step thus eliminates individual galaxy ellipticity measurements at wavelengths at which objects were noisy or blended, and it also reduces the systematic errors because the images at different wavelengths do not share the same residual point-spread function anisotropy. Finally we rejected objects with as likely to be blends of more than one object, and applied flux density criteria ( through the 650 nm filter, 23–26 R magnitude) to select objects likely to be distant galaxies. We use these same selection criteria in calibrating the typical redshift of the background galaxies (below). The final catalogues contain about 45,000 galaxies in each field. A visual inspection of the final catalogues indicates that they are free of spurious objects such as bits of scattered light around bright stars.
These observed ellipticities must be corrected for the overall broadening effect of the point-spread function, which makes elliptical galaxies appear more circular even if the point-spread function itself is perfectly isotropic. To calibrate this effect, we took a deep image with a very small point spread (the Hubble Deep Field South) and convolved it to the resolution of our final images, which is 1.07–1.25 arcsec as measured by the full width at half-maximum at 650 nm. (The resolution on individual exposures, or “seeing” was better, but the stellar size is larger in the final image with systematic shape errors removed from the point-spread function.) While some isolated galaxies became broader and less elliptical as predicted, most merged with their neighbors, producing many more elliptical objects than predicted and preventing the construction of a clear relationship between observed and true ellipticity for individual galaxies.
Instead we calibrated the fraction of cosmic shear recovered, as a function of resolution, from the ensemble of galaxies matching our selection criteria. We induced a known shear into the Hubble Deep Field South, convolved to the desired resolution, applied the same galaxy measurement and selection routines (at 650 nm only), and measured the mean ellipticity of the resulting sample. We averaged over repeated shears in several different directions to assess the measurement errors. The ratio of induced to recovered ellipticity was , with no clear trend as a function of resolution. The lack of such a trend would be quite surprising for isolated galaxies, but the coalescence of galaxy images appears to be the dominant effect. In the fairly small range of 1.07–1.25 arcsec resolution, this effect does not change the recovery factor by more than the measurement error of 0.5, so we adopt 4.5 as an overall ellipticity recovery factor.
Ellipticity correlations of distant galaxies
Miralda-Escudé [10] has defined two physically revealing ellipticity correlation functions. In this approach, the ellipticity components of a galaxy are calculated not with respect to the arbitrary and axes of the image, but with respect to the line joining it to another galaxy (Fig. 3). Averaging over all galaxies and separated by angle on the sky, the correlations and have a unique signature in the presence of gravitational lensing, explained in detail in Fig. 3. We recently reported the detection of a cosmic shear signal in the quadrature sum of these correlation functions.[27]
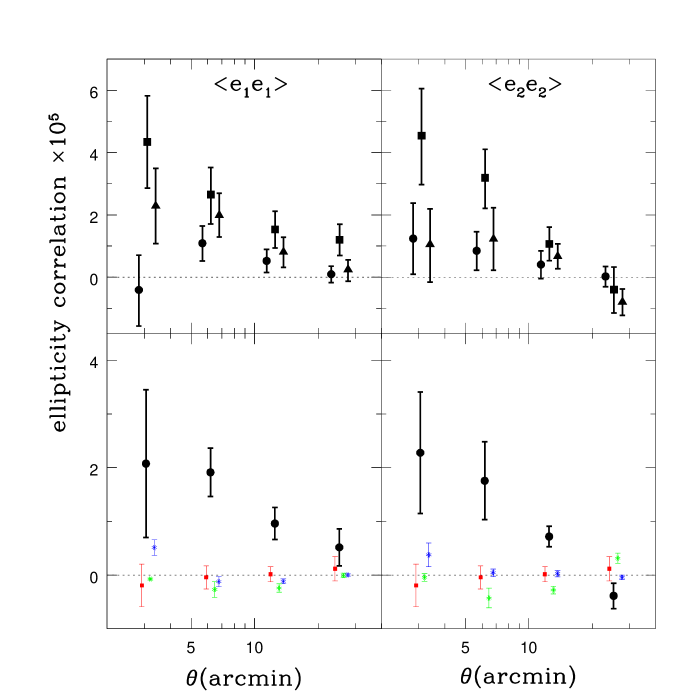
Fig. 4 shows the ellipticity correlations for each of the three fields in the angular separation range 2-36 arcmin (top panels). The plotted errors indicate 68% confidence intervals determined from 200 bootstrap-resampled realizations of the final galaxy catalogue in each field. Note that the measurements in different angular separation bins are not statistically independent, but and are independent from each other, as are the three fields. At arcmin, the confidence that is 97%, 99.5%, and 99.5% for the three fields in the order shown in Fig. 4. Similarly, the confidence that at the same angular scale is 87.5%, , and 97% respectively. Some “cosmic variance”, or real systematic differences among fields of this size, is expected,[28] but the statistical errors are too large to examine this effect. We plot the average over the three fields in the lower panels of Fig. 4, with errors in the mean derived from the variance among the fields (black points and errors). The signature of gravitational lensing by large-scale structure is evident: declines as the angular scale increases, but is positive at all scales, while matches at small scales but drops below zero at large scales. This result is robust: Similar, but lower signal-to-noise, profiles are obtained if we use unweighted moments or moments from the 650 nm images only.
We performed several tests for systematic errors. The effects of residual point-spread function anisotropy are demonstrated by plotting the correlation functions of the stars (blue in Fig. 4). These are far closer to zero than are the galaxy correlations. Only in the innermost bin has an apparently significant stellar correlation. To test the effect that this might have on the galaxy correlations, we computed the star-galaxy correlations and (green in Fig. 4). The star-galaxy correlations are extremely close to zero in this bin. There are also tests involving the galaxy sample alone. The cross correlation should vanish in the absence of systematic errors (red in Fig. 4). The result is reassuringly close to zero. The plotted errors for can also be taken as an indicator of the statistical error associated with the number and distribution of galaxies included in the catalogues (but reduced due to the averaging of two functions in ). This estimate of statistical error agrees roughly with that shown for and . Finally, the weak lensing signature disappears if we randomise the galaxy positions.
Apart from these null tests, there are also affirmative tests. One test is to take similar data centered on a cluster of galaxies of known mass. A 650-nm image of massive cluster at redshift 0.45, taken with the same camera and processed in the same way, exhibits correlation functions ( and ) of the expected angular dependence and of larger amplitude than in any of the three blank fields, despite likely contamination of the galaxy sample by cluster members. also vanishes in this field. Another test involves inverting the background galaxy ellipticity distribution to yield a map of projected mass in each “blank” field. We find occasional mass concentrations which can often be identified with likely foreground clusters, but no linear features or pileups at the edges of the image which might indicate problems in the background galaxy catalogues. Furthermore, when a mass map is made using only those galaxies likely to be behind a serendipitous cluster (based on colour information), the lensing signal from that cluster increases markedly. This corroborates the idea that the correlation functions are accumulating over many sources and many overdensities spread throughout the line of sight. All these tests indicate that we have indeed measured cosmic shear in our “blank” fields and that contamination from surviving systematic error is low. We now turn to comparisons with theoretical predictions of this effect.
Comparison with theoretical predictions
Ellipticity correlations increase strongly with background galaxy redshift, so we must first constrain the source redshift distribution . Very little is known about the redshift distribution of galaxies as faint as those used here, so we assume a simple model , and adjust to match weak gravitational lensing observations of a high-redshift galaxy cluster of known velocity dispersion (MS1054 at ).[29] We observed this cluster with the same camera and telescope and reduced the data in the same way as for the blank fields, and compared the faint galaxy ellipticities (tangential to the cluster center) to that expected for a range of . We found that was the best match.
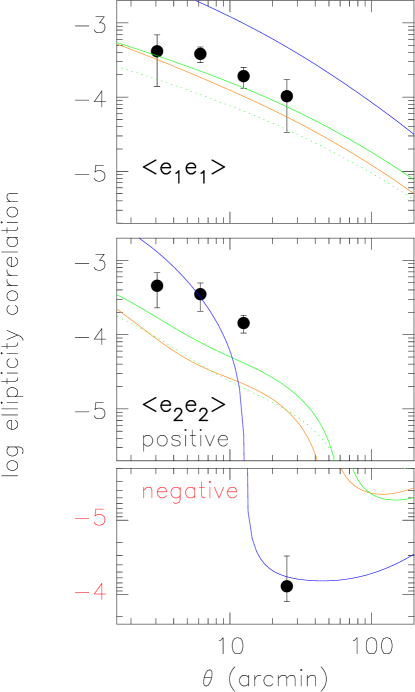
This model was used as input to a cold dark matter simulation code by W. Hu and J. Miralda-Escudé (see ref [30]), which computes the shear power spectrum and correlation function for any given cosmology, using the prescription of Hamilton et al.[31] and Peacock & Dodds[32] to calculate the mass power spectrum in the non-linear regime when the growth of gravitationally collapsed dark matter structures modified the mass spectrum. Results were obtained for three cosmological models and are plotted along with our seeing-corrected measurements on a logarithmic scale in Figure 5. Two current models were normalised to the microwave background fluctuations (COBE) at large angle and to local galaxy cluster abundance (assuming mass traces light) at small angle: an open universe with (orange in Figure 5), and a flat universe dominated by a cosmological constant (green, solid line). The agreement between the data and the two viable cosmological models is impressive for a first measurement. For comparison purposes we also show the old standard cold dark matter flat cosmology (blue), which is only COBE normalised. (A full listing of the parameters used in these models is shown in Table 1.) To illustrate the effect of varying , we also plot the -dominated cosmology with (green, dotted line). Since our model peaks at , this lowers the typical redshift from 1.0 to 0.6. Decreasing decreases the amplitude of the correlations, but has little effect on their shapes. The uncertainty in implies a factor of several uncertainty in the amplitude of the correlation, and is by far the dominant calibration error.
Despite this uncertainty, COBE-normalised standard cold dark matter is ruled out by the measured values of . While this is not surprising, it is the first cosmological constraint from wide-field weak lensing, and it agrees with several other methods which disfavor this model.[33, 34] The other two models are consistent with the data at the level. The indication of a low universe here is in agreement with a remarkable array of independent methods, including type Ia supernovae, cosmic microwave background anisotropies, cluster baryon fraction together with cluster mass (lensing) and primeval deuterium, and the age of the oldest stars coupled with the Hubble constant[35]. However, the shape of is not a good fit to either of these two model cosmologies, which are based on a single power-law mass spectrum. If confirmed by further data, this would suggest the need for a more complicated mass spectrum.
This technique can further distinguish between open and -dominated universes if extended to the somewhat larger angular scales where those cosmologies predict will cross zero as shown in Figure 5. A survey of many fields now underway will rule out one or more of these cosmologies at the level at 10 arcmin angles ( level for a differential measure of the slope of the power spectrum). Separating the background galaxies into discrete redshift bins based on multi-colour photometry will enable measurement of the ellipticity correlation (or equivalently the dark matter power spectrum) as a function of cosmic time; wide-field weak lensing surveys deep enough to identify galaxies at and measure their shapes will constrain several cosmological parameters.[30] Ultimately, the combination of all the power spectrum probes (lensing, cosmic microwave background, galaxy distributions, and peculiar velocities) will tightly constrain theories of the origins of fluctuations in the early universe and their growth into galaxies and large-scale structure.
Acknowledgements
We gratefully acknowledge help from Wayne Hu and Jordi Miralda-Escudé on theoretical predictions of several cosmological models. We thank Steven Gentile for his artwork, and the staff of CTIO for their help with the BTC project and for their upgrading and maintenance of the delivered image quality of the Blanco telescope. Cerro Tololo Inter-American Observatory is a division of National Optical Astronomy Observatory (NOAO), which is operated by the Association of Universities for Research in Astronomy, Inc., under Cooperative Agreement with the National Science Foundation. BTC construction was partially funded by the NSF.
References
- [1] L. Page and D. T. Wilkinson. The cosmic microwave background. Rev. Mod. Phys., 71:173–179, 1999.
- [2] J. A. Tyson, F. Valdes, and R. Wenk. Detection of systematic gravitational lens galaxy image alignments: mapping dark matter in galaxy clusters. Astrophys. J., 349:L1–L4, 1990.
- [3] G. Fahlman, N. Kaiser, G. Squires, and D. Woods. Dark matter in ms1224 from distortion of background galaxies. Astrophys. J., 437:56–62, 1994.
- [4] G. Squires, N. Kaiser, G. Fahlman, A. Babul, and D. Woods. A weak gravitational lensing analysis of abell 2390. Astrophys. J., 469:73–77, 1996.
- [5] D. Clowe, G. A. Luppino, N. Kaiser, J. P. Henry, and I. M. Gioia. Weak lensing by two clusters of galaxies. Astrophys. J., 497:61–64, 1998.
- [6] H. Hoekstra, M. Franx, K. Kuijken, and G. Squires. Weak lensing analysis of cl 1358+62 using hubble space telescope observations. Astrophys. J., 504:636–660, 1998.
- [7] Y. Mellier. Probing the universe with weak lensing. Annu. Rev. Astron. Astrophys., 37:127–189, 1999.
- [8] J. E. Gunn. A fundamental limitation on the accuracy of angular measurement in observational cosmology. Astrophys. J., 147:61–72, 1967.
- [9] C. Dyer and R. Roeder. Observations in locally inhomogeneous cosmological models. Astrophys. J., 189:167–175, 1974.
- [10] J. Miralda-Escudé. The correlation function of galaxy ellipticities produced by gravitational lensing. Astrophys. J., 380:1–8, 1991.
- [11] R. Blandford, A. Saust, T. Brainerd, and J. Villumsen. The distortion of distant galaxy images by large scale structure. Mon. Not. Royal Astron. Soc., 251:600–627, 1991.
- [12] N. Kaiser. Weak gravitational lensing of distant galaxies. Astrophys. J., 388:272–286, 1992.
- [13] J. Villumsen. Weak lensing by large-scale structure in open, flat and closed universes. Mon. Not. Royal Astron. Soc., 281:369–383, 1996.
- [14] B. Jain and U. Seljak. Cosmological model predictions for weak lensing. Astrophys. J., 484:560–573, 1997.
- [15] N. Kaiser. Weak lensing and cosmology. Astrophys. J., 498:26–42, 1998.
- [16] J. Kristian. On the cosmological distortion effect. Astrophys. J., 147:864–867, 1967.
- [17] F. Valdes, J. A. Tyson, and J. F. Jarvis. Alignment of faint galaxy images: cosmological distortion and rotation. Astrophys. J., 271:431–441, 1983.
- [18] J. Mould, R. Blandford, J. Villumsen, T. Brainerd, I. Smail, T. Small, and W. Kells. A search for weak distortions of distant galaxy images by large-scale structure. Mon. Not. Royal Astron. Soc., 271:31–38, 1994.
- [19] P. Schneider, L. van Waerbeke, Y. Mellier, B. Jain, S. Seitz, and B. Fort. Detection of shear due to weak lensing by large-scale structure. Astron. Astrophys., 333:767–778, 1998.
- [20] D. Wittman, J. A. Tyson, G. M. Bernstein, R. W. Lee, I. P. Dell’Antonio, P. Fischer, D. R. Smith, and M. M. Blouke. Big throughput camera: the first year. Proc. Soc. Photo-Optical Instr. Eng., 3355:626–634, 1998.
- [21] K. R. Castleman. Digital image processing. Prentice Hall, page 214, 1979.
- [22] P. Fischer and J. A. Tyson. The mass distribution of the most luminous x-ray cluster rxj1347.5-1145 from gravitational lensing. Astron. J., 114:14–24, 1997.
- [23] C. A. Gullixson, P. C. Boeshaar, J. A. Tyson, and P. Seitzer. The photometric system. Astrophys. J. Supp., 99:281–293, 1995.
- [24] E. Bertin and S. Arnouts. Sextractor: software for source extraction. Astron. Astrophys. Supp., 117:393–404, 1996.
- [25] F. Valdes. Resolution classifier. Soc. Photo-Optical Instr. Eng. (SPIE) Proceedings, 331:465–472, 1982.
- [26] J. A. Tyson. Dark matter mapping by gravitational lens tomography. AIP Conf. Proc. Dark Matter, Eds: S. Holt and C. Bennett, (AIP Press 1995):287–296, 1995.
- [27] D. Wittman and J. A. Tyson. The shear correlation function out to 20 arcminutes. Gravitational Lensing: Recent Progress and Future Goals, eds. T. G. Brainerd and C. S. Kochanek (ASP Conference Series):in press, 2000.
- [28] G. Kruse and P. Schneider. The non-gaussian tail of cosmic shear statistics. astro-ph/9904192, 1999.
- [29] K. H. Tran, D. D. Kelson, P. van Dokkum, M. Franx, G. D. Illingworth, and D. Magee. The velocity dispersion of ms1054-03: a massive galaxy cluster at high redshift. Astrophys. J., 522:39–45, 1999.
- [30] W. Hu. Power spectrum tomography with weak lensing. Astrophys. J., 522:L21–L24, 1999.
- [31] A. J. S. Hamilton, A. Matthews, P. Kumar, and E. Lu. Reconstructing the primordial spectrum of fluctuations of the universe from the observed nonlinear clustering of galaxies. Astrophys. J., 374:L1–L4, 1991.
- [32] J. A. Peacock and S. J. Dodds. Non-linear evolution of cosmological power spectra. Mon. Not. Royal Astron. Soc., 280:L19–L26, 1996.
- [33] J. P. Ostriker and P. J. Steinhardt. The observational case for a low density universe with a cosmological constant. Nature, 377:600–602, 1995.
- [34] N. A. Bahcall, J. P. Ostriker, S. Perlmutter, and P. J. Steinhardt. The cosmic triangle: revealing the state of the universe. Science, 284:1481–1488, 1999.
- [35] M. S. Turner and J. A. Tyson. Cosmology at the millennium. Rev. Mod. Phys., 71:145–164, 1999.
- [36] C. Frenk, S. D. M. White, G. Efstathiou, and M. Davis. Galaxy clusters and the amplitude of primordial fluctuations. Astrophys. J., 351:10–21, 1990.
| Table 1 Summary of cosmological models |
| Model (Fig 5 colour) | n | normalization | |||||
|---|---|---|---|---|---|---|---|
| Standard cold dark matter (blue) | 0.05 | 0.95 | 0 | 50 | 1.0 | 1.17 | COBE only |
| -dominated, flat (green) | 0.039 | 0.291 | 0.67 | 70 | 0.94 | 0.84 | COBE+clusters |
| Open universe (orange) | 0.045 | 0.405 | 0 | 65 | 1.01 | 0.71 | COBE+clusters |
These cosmological models were chosen in order to put our ellipticity correlation measurements in context. The old standard cold dark matter model in which the universe is nearly closed by cold dark matter, is also disfavored in other observations. Its rms mass contrast is normalized to that found 300,000 years after the Big Bang via the cosmic microwave background radiation fluctuations observed with the COsmic Background Explorer satellite (). The other two models agree with a wide variety of observations, but only the cosmological constant (-dominated, flat) cosmology also agrees with the recent evidence from supernova studies for accelerated expansion. is the fraction of critical density in to ordinary (baryonic) matter. is the fraction in all matter (mostly dark matter), and is the fraction in dark energy (the cosmological constant). is the Hubble constant in units of km s-1 Mpc-1. The power spectrum of mass density fluctuations is often plotted in terms of inverse size: the wave number k is inversely proportional to length. The parameter n is the slope of the primeval density power spectrum as a function of k: . For a scale-free power spectrum of density fluctuations, n = 1. The parameter is the current rms mass contrast in a random sphere of radius 8() Mpc compared with that for numbers of galaxies.[36] The choice of n=1 and normalization for standard cold dark matter results in too much mass fluctuation on galaxy cluster scales. By adjusting the slope n and current rms mass contrast , models can be forced to fit the rms mass contrast now on galaxy cluster scales as well as the normalization.
Please get fig3.jpg from astro-ph/0003014.

Please get fig3.jpg from astro-ph/0003014.