Search for molecular gas in HVCs by HCO+ absorption
Abstract
High-Velocity Clouds (HVCs) have radial velocities that cannot be explained by the global Galactic rotation; their distances remain mostly unknown, and their true nature and origin are still a mystery. Some of them could be of galactic origin, or belong to tidal streams drawn by the Milky-Way/ Magellanic Clouds interaction, or could even be intergalactic clouds infalling onto the Local Group. In the latter hypothesis, they play a major role in the hierarchical formation scenario of the Milky-Way and are connected to the Lyman-limit absorption systems. In any case, the determination of their physical state (density, temperature, internal structure, abundances, excitation) will help to discriminate between current theories on their origin and nature. A recent UV measurement (Richter et al 1999) has discovered for the first time in a HVC the molecular phase that was previously searched for, without success, through CO emission. Previous non detections could be due either to metallicity problems, or insufficient excitation (because of low density). Low-excitation molecular gas may, however, be detectable though absorption. Here we report on a sensitive search for HCO+(1-0) absorption lines in front of 27 quasars, already known to be strong millimetric continuum sources. Except for one tentative case, no detection was obtained in most HVCs, although HCO+(1-0) was clearly detected towards galactic low-velocity clouds. We discuss the implications of this result.
Key Words.:
ISM: clouds – ISM: general – ISM: structure – Galaxy: general – Galaxy: halo – Galaxy: structure1 Introduction
Since their discovery by Muller, Oort, & Raimond (1963), HI clouds moving with velocities that can not be explained by differential Galactic rotation (often exceeding it by 100 km s-1) have been the target of numerous surveys. Many of these high-velocity clouds (HVCs) are located at intermediate and high Galactic latitudes (Giovanelli, Verschuur, & Cram 1973; Mathewson, Schwarz, & Murray 1977; Wakker & van Woerden 1991) and do not appear to have any connection with the gas in the Galactic disk. HVCs are often found in large HI complexes with angular sizes 10–90∘. They cover from 10 to 37% of the sky, depending on the sensitivity of the studies (Murphy et al 1995).
The origin of HVCs is still unclear, mainly because the distances to the individual complexes are in most cases unknown. They could be cold gas corresponding to the return flow in a Galactic fountain (e.g. Houck & Bregman 1990), or gas left over from the formation of the Galaxy. Some HVCs are probably belonging to the tidal gas streams torn from the Magellanic Clouds by the Milky-Way (Mathewson et al 1974, Putman & Gibson, 1999).
Several authors have already explored the possibility that HVCs are infalling primordial gas and have associated them with the Local Group (see Wakker & van Woerden 1997 for a thorough review). Recently Blitz et al. (1999) re-examined this hypothesis, and simulating the dynamical evolution of the Local Group galaxies, used the up-to-date HI maps of HVCs to show that the HVCs are consistent with a dynamical model of infall of the ISM onto the Local group. As such, they would represent the building blocks of our galaxies in the Local group and provide fuel for star formation in the disk of the Milky Way. In their model, HVCs contain altogether 1011 M⊙ of neutral gas. From their stability analysis, they conclude that there is roughly 10 times more dark matter than luminous gas within each HVC, and that these could correspond to the mini-halos which are able to accumulate baryons, and can gather into filaments (e.g. Bond et al 1988, Babul & Rees 1992, Kepner et al 1997). HVCs would therefore be related to the hierarchical structure of the Universe (see e.g. Katz et al 1996), and to the gas seen in absorption towards quasars (Lyman- forest and Lyman-limit lines). However, Giovanelli (1981) has pointed out that the velocity distribution of HVCs does not match that of the Local Group, but does favor an association with the Magellanic Stream, the most obvious tidal feature of the interaction between the Galaxy and the Magellanic Clouds. The discrepancy with the results from Blitz et al. (1999) comes from the fact that the latter authors have not considered all observed HVCs, but only a selection of them.
Maps of the brightest HVC complexes have revealed the existence of unresolved structure at 10 arcmin resolution, which was further resolved into high-density cloud cores at 1 arcmin resolution (Giovanelli & Haynes 1977; Wakker & Schwarz 1991; Wakker & van Woerden 1991). More generally, HVCs follow the fractal structure observed in the whole interstellar medium (Vogelaar & Wakker, 1994). The HI column densities in these cores are estimated to be several times 1020 cm-2 and their temperatures are generally between 30 and 300 K. The central densities of individual clouds can reach 80 cm-3 D, where Dkpc is their distance in kpc. Depending on the actual distance, which still remains poorly determined, those conditions make the HVC cores possible sites of star formation. HVCs have in fact been considered good candidates for the source of young Population I stars at large distances from the Galactic plane (see e.g. Sasselov 1993).
Attempts to measure the spin temperature of atomic hydrogen through 21cm absorption in front of background continuum sources have often only resulted in upper limits (Colgan et al. 1990, Mebold et al. 1991). A few detections have been reported (Payne et al. 1980, Wakker et al. 1991, Akeson & Blitz, 1999), with inferred spin temperature as low as 36 K, but in general most HVCs must have spin temperatures larger than 200 K or be very clumpy.
Most of our current knowledge of the gaseous content of HVCs comes from HI observations. Efforts to search for molecular hydrogen using CO emission lines have been so far unsuccessful (Wakker et al 1997), since the sub-solar metallicity and/or low density of HVCs makes direct CO emission line detection very difficult. However, optical absorption lines have shown that HVCs are not completely devoid of heavy elements (e.g. Robertson et al 1991, Lu et al 1994, Keenan et al 1995, Wakker & van Woerden 1997). The lines detected are from SiII, CII, FeII, or CIV, but the strongest are from MgII (Savage et al. 1993, Bowen & Blades 1993, Sembach et al. 1995, 1998). Metallicity studies have been done in HVCs to determine their origin. If HVCs result from the Galactic fountain effect, their metallicity should be solar while if they were associated with the Magellanic or intergalactic Clouds, it could be even less than 0.1 solar. In fact, the determined abundances are around 0.1 solar, but with much uncertainties, because of saturated lines, or dust depletion (Sembach & Savage 1996). This average metallicity is compatible with a Local-Group infall model, since X-ray observations have revealed abundances of 0.1 solar in poor groups (Davis et al 1996), and even 0.3 solar in intra-cluster gas (Renzini 1997).
If HVCs were local analogues of Lyman-limit absorbing clouds, background QSOs could enable us to detect molecules in absorption, a task which is considerably easier to achieve. Absorption has recently been reconfirmed as a very powerful tool in the millimetric range (Lucas & Liszt 1996 hereafter LL96, Combes & Wiklind 1996). A mm molecular detection would advance our knowledge of HVCs, their physical conditions, and their possible origin. A first attempt has been made in this domain by Akeson & Blitz (1999) with only negative results, using the BIMA and OVRO interferometers.
Here we report on HCO+(1-0) absorption line observations, made in the southern sky with the single dish 15m ESO-SEST telescope, and in the northern sky with the IRAM interferometer. The choice of HCO+ is justified because, due to its large dipole moment, it is generally not excited in diffuse media (the critical density for excitation is 107 cm-3); therefore confusion with emission is not a problem, contrary to the CO(1-0) line which requires an interferometer to resolve out the emission. Furthermore, the HCO+ absorption survey carried out by Lucas & Liszt (1994, 1996) has revealed more and wider absorption lines than in CO, suggesting that it might be a better tracer. In that study, the derived abundance HCO+/H2 was surprisingly large, of the order of 610-9, and sometimes even an order of magnitude larger. The details of the observations are presented in Section 2. Section 3 summarizes the results, which are then discussed in Section 4.
2 Observations
The observations in the southern sky were carried out with the 15m antenna of ESO-SEST in La Silla (Chile), during 6-10 November 1999. We used two SIS receivers at 3 mm and 2 mm simultaneously, to observe the HCO+(1-0) and CS(3-2) lines at 89.188523 and 146.969033 GHz respectively. Although CS is less abundant, it would have been interesting to have both molecules in case of detection. The HPBW were 57” and 34” and the main-beam efficiencies were =0.75 and 0.66 respectively at the two mentioned frequencies. The backends were accousto-optic spectrometers (AOS) both at high-resolution (HRS) and low-resolution (LRS). The corresponding channel spacings (velocity resolutions) were 0.144 (0.268) and 0.087 (0.163) km s-1 at HCO+ and CS for HRS and 2.32 (4.7) and 1.4 (2.8) km s-1 respectively for LRS. The number of channels were 1000 and 1440 for high and low resolution backends respectively, so that the velocity coverage was 140 and 3352 km s-1 at high and low resolution for the HCO+ line, and 85 and 2057 km s-1 for CS respectively. Since all backends were centered of the expected HVC velocity, there was no problem detecting any galactic line around V=0 km s-1 with the low-resolution, but it was most of the time outside of the range at high-resolution. We have retrieved the HCO+ absorptions already reported by Lucas & Liszt (1996) with the IRAM interferometer. In cases where dilution in large velocity channels made detection problematic, we shifted the high-resolution backend to zero velocity to verify the detection. Pointing was corrected regularly (every 2 hours) using known SiO masers (and the 3 mm receiver retuned accordingly). The weather was clear throughout the run, and the typical system temperatures were 180 K for both the 3 and 2 mm ranges. The observing procedure was dual beam switching at high frequency (6 Hz) between same elevation positions in the sky (beam throw of 2’ 27”), to eliminate atmospheric variations. Each source was observed on average for 2 hours, reaching about 3.5 mK of rms noise in channels of 1.4 MHz (4.7 km s-1 at HCO+).
Because the width of the absorption lines may be expected to be small (even though the HCO+ absorption lines are the wider mm lines, and therefore more favorable for detection), a concern should be noted that line profiles may be diluted in the low resolution spectrograph. The technique proved to be valuable, allowing us to retrieve the HCO+(1-0) absorptions already detected by LL96 for galactic clouds, near zero velocity (see below). We also wished to check that the HCO+(1-0) absorption was not hampered by emission. In one of the sources (2251+158) we observed an offset position (with a beam throw of 12’ for the beam-switch) to check for emission. Emission was not detected at the same signal-to-noise at which the absorption was clearly present.
The observations in the northern sky were carried out with the IRAM interferometer in Plateau de Bure (France), during July, October and November 1999. The interferometer data were made with the standard D configuration (see Guilloteau et al. 1992). The array comprised 4 15–m telescopes. The receivers were 3–mm SIS, giving a typical system temperature of 150–200 K. One of the source, 3C 454.3, was used itself as a phase reference, while bandpass and amplitude calibrations were done using also sources such as 3C 273, MWC 349, 1823+568, 2145+067. The data reduction was made with the standard CLIC software. The synthesized beams are of the order of 68 arcsec. The auto-correlator was used in three overlapping configurations of bandwidth 160, 80 and 40 MHz and a respective resolution of 2.5, 0.625 and 0.156 MHz, giving a maximum velocity resolution of 0.5 km s-1. The largest bandwidth observed is 540 km s-1.
The 4 objects in the secondary list have been observed with IRAM interferometer.
| QSO | R.A. | Dec. | Long | Lat | Vlsr | HVC | F3mm | F2mm |
|---|---|---|---|---|---|---|---|---|
| (B1950) | (B1950) | (deg) | (deg) | km s-1 | complex | Jy | Jy | |
| 0208-512 | 02:08:57.1 | -51:15:08 | 276.10 | -61.78 | 180. | MS | 4.96 | 4.41 |
| 0221+06 | 02:21:49.9 | +06:45:50 | 159.72 | -49.12 | -230. | AC | 0.83 | 0.29 |
| 0234+28 | 02:34:55.5 | +28:35:12 | 149.46 | -28.53 | -140. | AC | 3.42 | 2.06 |
| 0235+16 | 02:35:52.6 | +16:24:04 | 156.77 | -39.11 | -230. | AC | 2.01 | 1.41 |
| 0302-623 | 03:02:48.4 | -62:23:06 | 280.23 | -48.67 | 200. | MS | 0.57 | 0.53 |
| 0331+321 | 03:31:40.1 | +32:08:37 | 158.70 | -18.99 | -140. | AC | 0.12 | 0.06 |
| 0420-014 | 04:20:43.5 | -01:27:28 | 195.29 | -33.14 | -180. | AC | 2.36 | 1.76 |
| 0528+134 | 05:28:06.8 | +13:29:42 | 191.37 | -11.01 | -180. | AC | 2.83 | 1.67 |
| 0607-157 | 06:07:26.0 | -15:42:03 | 222.61 | -16.18 | 110. | WC | 4.96 | 2.35 |
| 0637-75 | 06:37:23.3 | -75:13:34 | 286.37 | -27.16 | 250. | MS | 2.12 | 1.47 |
| 0646-306 | 06:46:19.6 | -30:40:54 | 240.54 | -14.11 | 190. | WC | 0.76 | 0.35 |
| 0727-115 | 07:27:58.5 | -11:34:53 | 227.77 | 3.14 | 125. | WB | 1.30 | 0.88 |
| 0805-078 | 08:05:49.6 | -07:42:23 | 229.04 | 13.16 | 125. | WB | 1.42 | 0.88 |
| 0834-201 | 08:34:24.6 | -20:06:30 | 243.57 | 12.23 | 150. | WB | 0.71 | 0.44 |
| 1034-293 | 10:34:55.9 | -29:18:28 | 270.95 | 24.84 | 120. | EP | 0.71 | 0.20 |
| 1055+018 | 10:55:55.3 | +01:50:04 | 251.51 | 52.77 | 110. | WA | 1.89 | 1.32 |
| 1057-79 | 10:57:50.3 | -79:47:39 | 298.01 | -18.28 | 250. | EP | 1.18 | – |
| 1104-445 | 11:04:50.4 | -44:32:53 | 284.17 | 14.22 | 150. | EP | 1.30 | 0.68 |
| 1908-202 | 19:08:12.5 | -20:11:55 | 16.87 | -13.22 | 1 | 2.36 | 1.76 | |
| 1923+210 | 19:23:49.8 | +21:00:23 | 55.56 | 2.26 | -200. | R?a | 2.36 | 2.00 |
| 1958-179 | 19:58:04.6 | -17:57:16 | 24.01 | -23.11 | 234. | GCP | 1.18 | 0.65 |
| 2131-02 | 21:31:35.3 | -02:06:41 | 52.39 | -36.50 | -206. | GCN | 1.06 | 0.59 |
| 2251+158 | 22:51:29.5 | +15:52:54 | 86.11 | -38.18 | -300. | MS | 6.14 | 4.12 |
| 2318+094 | 23:18:12.1 | +04:57:23 | 85.42 | -50.92 | -350. | MS | 0.47 | 0.29 |
| 3C263 | 11:37:09.3 | +66:04:27 | 134.16 | 49.74 | -185. | C | 0.06 | – |
| 3C351 | 17:04:03.5 | +60:48:31 | 90.08 | 36.38 | -180. | C | 0.02 | – |
| 3C454.3 | 22:51:29.5 | +15:52:54 | 86.11 | -38.18 | -397. | MS | 5.44 | – |
| PKS2251+113 | 22:51:40.5 | +11:20:39 | 82.78 | -41.94 | -374. | MS | 0.02 | – |
-
a
might belong instead to Cloud 274 or 283 (B. Wakker, priv. comm.)

3 Results
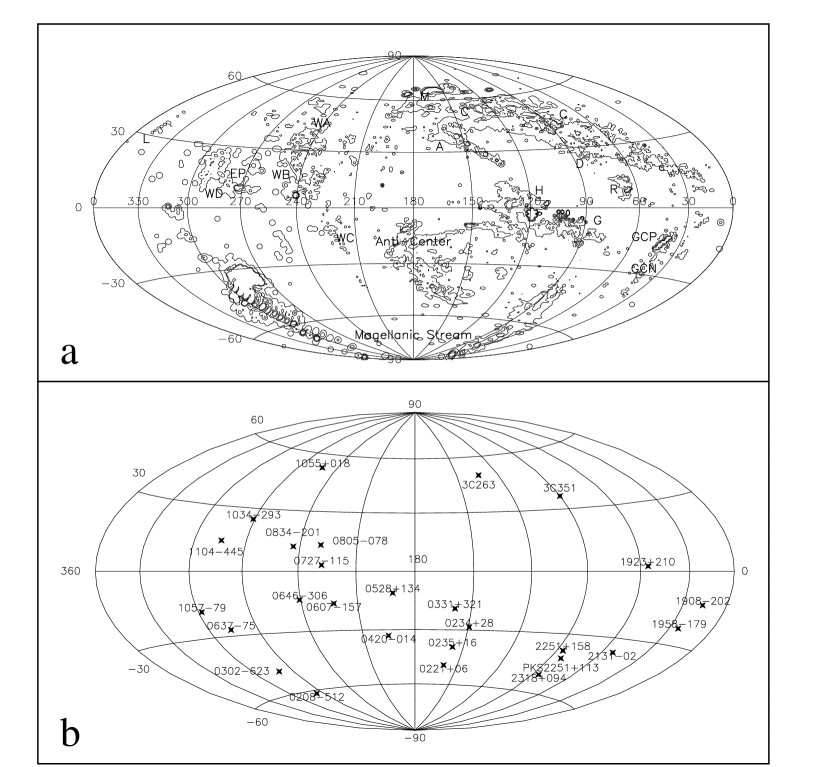
Our sources were selected from the strong millimeter quasars that were seen in projection over one of the 17 HVC complexes identified, in the Wakker & van Woerden (1991) recapitulating map. Table 1 displays the characteristics of the sources observed, the name and expected velocity of the HVCs along each line of sight, following the notation of the HVC catalogue of Wakker and van Woerden (1991), as well as the measured continuum flux in Jy at 3 and 2 mm, for all 24 sources observed at SEST at the date of observation (6–10 November 1999). The 4 sources observed with the IRAM interferometer (also in Table 1), have been selected to have MgII detected in absorption by Savage et al. (1993), at very high velocities. The HI in emission at these high velocities was measured by the NRAO-43m HI survey towards 143 quasars of Lockman & Savage (1995). The detection of MgII insures the presence of a minimum metallicity towards these lines of sight (larger than 0.32 solar, in 3C 454.3 for instance), favorable for the detection of HCO+. The positions of the observed sources are plotted in Figure 1 vis-a-vis an HI map of HVCs in Aitoff projection. Note that one source has been observed both with IRAM and SEST (3C 454.3).
The spectra were then normalized to the continuum flux, and the upper limit at 3 of the optical depth in absorption was computed in each case assuming that the surface filling factor is =1, i.e., that the absorbing molecular material covers completely the extent of the mm continuum source, in projection. If is the observed continuum antenna temperature of the background source, and the amplitude in temperature of the absorption signal, then the optical depth is:
The 3 upper limits of as measured in 0.56 km s-1 channels is listed in Table 2.
The total column density of HCO+, observed in absorption between the levels — with an optical depth at the center of an observed line of width at half-power, is:
where is the frequency of the transition, the statistical weight of the upper level (= 2 Ju+1), the Einstein coefficient of the transition (here = 310-5 s-1), the excitation temperature, and
where is the partition function. We assumed statistical equilibrium an excitation temperature, close to the cosmic background temperature, i.e. = 3 K, because of the large critical density needed to excite HCO+. We also expect a very narrow linewidth, comparable to the detected lines, and adopted = 1.1 km s-1 to derive the upper limits in Table 2. The HCO+/H2 abundance was conservatively taken as 610-9, but it must be kept in mind that it could be more than an order of magnitude higher (e.g. Lucas & Liszt 1994, Wiklind & Combes 1997), and therefore the derived H2 column densities could be correspondingly lower. However, if the metallicity is lower than solar, the corrections should go in the reverse sense.
An indicative HI column density of the high-velocity gas was also estimated using the HI surveys of Stark et al (1992) and Hartmann & Burton (1997) for the northern hemisphere, and Bajaja et al. (1985) for our 5 southernmost sources. This column density is rather uncertain since it has been smoothed over large areas (at least one half of a degree) while the material that could appear in absorption extends over milli-arcseconds, similar to the background millimeter sources. At small scales the HI column density could be much higher than the values presented.
Figure 2 shows some of the low velocity detections. All of them have already been discovered by Lucas & Liszt (1996), except the one at 1923+210 which is new. In the low-resolution backends, though, they are barely resolved and have somewhat reduced peak intensity. To check this, we have re-tuned to their central velocity, and centered the high-resolution spectrograph at V 0. In the HRS AOS, the absorptions had indeed stronger intensities and were in all cases compatible with previously reported values (the integration time though, for the retuned spectra, was not enough to obtain a high S/N).

Towards the source 1923+210, a tentative detection at the expected HVC velocity was obtained, as shown in Figure 3. It is very narrow, and was detected clearly only in the HRS back-end.
Akeson and Blitz (1999) have recently reported upper limits in CO absorption with the BIMA and OVRO interferometers towards 7 continuum sources. We have no sources in common, and therefore we increase the statistical significance of the upper limits. They also searched for HI absorption in HVCs with the VLA, and have positive results only in the gas associated to the outer arm of our Galaxy. They conclude that true HVCs are very weak HI and molecular absorbers. HI absorption in HVCs has been searched with single dish or interferometer several times, without much success (Payne et al. 1980, Colgan et al. 1990, Wakker et al. 1991). The fact that only 5% of the lines of sight towards HVCs show HI absorptions, while this frequency reaches 100% for normal galactic gas (Dickey et al. 1983), sheds some light on the physical structure of the clouds.
| QSO | N(HCO+) | N(H2) | N(HI) | ||
|---|---|---|---|---|---|
| 3 | 1011 | 1019 | 1019 | 3 | |
| cm-2 | cm-2 | cm-2 | |||
| 0208-512 | 0.08 | 1.2 | 2.0 | 1.4 | 1.4 |
| 0221+06 | 0.67 | 17.0 | 28.3 | 1.6 | 17.7 |
| 0234+28 | 0.12 | 1.9 | 3.2 | 2.2 | 1.4 |
| 0235+16 | 0.22 | 3.7 | 6.2 | 1.6 | 3.9 |
| 0302-623 | 0.53 | 11.0 | 18.3 | 2.3 | 7.9 |
| 0331+321 | 1 | – | – | 0.50 | – |
| 0420-014 | 0.24 | 4.1 | 6.8 | 0.15 | 45.3 |
| 0528+134 | 0.11 | 1.7 | 2.8 | 1.1 | 2.5 |
| 0607-157 | 0.08 | 1.2 | 2.0 | 2.0 | 1.0 |
| 0637-75 | 0.27 | 4.7 | 7.8 | 6.4 | 1.2 |
| 0646-306 | 0.53 | 11.0 | 18.3 | 2.0 | 9.1 |
| 0727-115 | 0.40 | 7.6 | 12.7 | 3.0 | 4.2 |
| 0805-078 | 0.40 | 7.6 | 12.7 | 4.7 | 2.7 |
| 0834-201 | 0.53 | 11.0 | 18.3 | 7.3 | 2.5 |
| 1034-293 | 0.92 | 38.0 | 63.3 | 4.6 | 13.8 |
| 1055+018 | 0.27 | 4.7 | 7.8 | 3.6 | 2.2 |
| 1057-79 | 0.80 | 24.0 | 40.0 | 3.9 | 10.2 |
| 1104-445 | 0.24 | 4.1 | 6.8 | 4.3 | 1.6 |
| 1908-202 | 0.20 | 3.3 | 5.5 | 3.0 | 1.8 |
| 1958-179 | 0.40 | 7.6 | 12.7 | 3.0 | 4.2 |
| 2131-02 | 0.40 | 7.6 | 12.7 | 0.18 | 70.5 |
| 2251+158 | 0.04 | 0.61 | 1.0 | 0.22 | 4.5 |
| 2318+094 | 0.92 | 38.0 | 63.3 | 2.2 | 28.8 |
| 3C263 | 0.5 | 10.4 | 17.4 | 0.2 | 87. |
| 3C351 | 0.9 | 35.0 | 58.4 | 0.9 | 65. |
| 3C454.3 | 0.007 | 0.10 | 0.17 | 0.12 | 1.4 |
| PKS2251+113 | 0.9 | 35.0 | 58.4 | 0.48 | 121. |
Tentative Detection
(with a linewidth precisely 1.1 km s-1)
| QSO | N(HCO+) | N(H2) | N(HI) | ||
|---|---|---|---|---|---|
| 1011 | 1019 | 1019 | 3 | ||
| cm-2 | cm-2 | cm-2 | |||
| 1923+210 | 0.25 | 4.3 | 7.2 | 1. | 7.2 |
-
a
in 0.56 km s-1 channels
4 Discussion and Conclusion
4.1 The diverse nature of HVCs
It is still difficult to tackle the problem of the origin of HVCs, since they may be diverse in nature, with possibly different formation histories. The first idea that they are clouds infalling towards the Milky Way (Oort, 1966) was proposed since only negative velocities clouds were discovered at this epoch. However, since differential galactic rotation makes an important contribution to those velocities and the tangential velocity of the HVCs is also unknown, it is difficult to ascertain their true three dimensional motion. Now that almost an equal number of clouds are detected with positive high velocities, and that is also true in the various reference frames (e.g. Wakker 1991), it is believed there must be other explanations for at least some of them. Some HVC complexes have been proven to be associated with the Galaxy, in being very close (less than 10 kpc) due to absorption detected in front of Galactic halo stars (e.g. Danly et al. 1993, van Woerden et al. 1999). This supported a Galactic origin for some of the HVCs and more specifically the Galactic fountain model, where gas is ejected in the halo by the star formation feedback mechanisms. The main problems with this scenario are the low metallicity observed in most lines of sight (even though it could explain why clouds have nearly solar metallicity, e.g. Richter et al 1999), and the extreme velocities sometimes reached (up to -450 km s-1 in the negative side). Alternatively, HVCs could be transient structures, now becoming bound to the Galaxy: an ensemble or complex of HVCs has been identified as tidal debris from the Magellanic Clouds (Mathewson et al. 1974), and is called the Magellanic Stream. Few of them could come from tidal debris from interactions with other dwarf galaxies but the corresponding dwarf galaxies either have not been identified yet, or they have been already dispersed (e.g. Mirabel & Cohen 1979).
A key point is to consider whether HVCs are transient structures or coherent and self-gravitating. With only their column density observed in HI, to be self-gravitating they should be at least at 1 Mpc distance, and in average at 10 Mpc, therefore outside the Local Group (Oort, 1966). This distance can be reduced by a factor 10, if the total mass of HVC is taken to be 10 times their HI mass, composed mostly of dark matter (Blitz et al. 1999). Since the specific kinetic energy is in M/R Distance, then the clouds would have to be only at about 1 Mpc, and would consequently be part of the Local Group. The main difficulty with this model of mini-haloes merging with our Galaxy, is that other high-velocity clouds should have been observed around or in between external galaxies, which is not the case (Giovanelli 1981, Zwaan et al. 1997, Banks et al. 1999). Moreover, the derived typical dimensions and mass of these systems do not correspond to any observed object or any extrapolation of mass ranges (they have dwarf masses, but are very extended in size).
Another possibility, however, could be that HVCs represent gas left over from the formation of the Galaxy: they form a system out of equilibrium, but bound to the Galaxy, and are now raining down to the Galactic disk. This would explain several observed characteristics, such as the 4-10 kpc distance determined for some complexes, and the low metallicity of many of them (e.g. Wakker et al. 1999).

4.2 How many molecular absorptions could be expected?
Given the low HI column densities reported in Table 2, it could seem hopeless to detect molecular absorption, with the present sensitivities. But this is true only if the HVC gas is homogeneous. In fact, from previous HI observations, we expect that like the gas in the galactic disk,the HVC gas is also composed of several components, with clumps of much higher column densities, only detectable at higher spatial resolution. This information can be deduced from existing HI observations in emission and absorption, towards HVCs. The optical thickness is related to the column density N(HI) (cm-2), the spin temperature Ts(K) and the FWHM velocity width (km s-1) by
Since the profile extends at least over 20 km s-1 in emission, and the spin temperature has been determined to be at least 50 K, if there was only one component, the derived optical depth would have to be very low, . Absorption and emission studies in the Galactic plane have shown though that there is indeed more than one component. If there was only one, both emission and absorption profiles would look similar, which is not what is observed. In fact, there are at least two components; a warm diffuse inter-clump component with cloudlets which are cold, narrow in velocity, and more optically thick (Garwood & Dickey 1989). If the surface filling factor of the two components are f1 and f2, for spin temperatures T1 and T2, and optical depths and , the observed ratio between the absorption depth and the antenna temperature of the emission is
In this formula, it is obvious that each component is weighted according to its mass if it is optically thin (i.e. weight ), but considerably less if . Therefore, if the cold component is optically thick, the derived spin temperature will be overestimated111In fact the mass of the cold component would be itself under-estimated, since the absorption often saturates, while the emission, dominated by the warm gas, saturates less.
Are HVC clouds of the same nature than normal low-velocity galactic clouds, and have they similar small-scale structure? For normal HI clouds, Payne et al. (1983) have determined (from absorption/emission comparisons) that the weighted average spin temperature is decreasing as the optical depth increases (cf line in Figure 4). There is only a small scatter in this relation, which means that if the cold and thick component is made of cloudlets, their size must be smaller than that of their background continuum sources, i.e. a fraction of an arcmin, and their number must be large accordingly (N 100). We do not see the situation where absorption features are deep and rare (statistically the Ts- relation will still hold, but with large scatter). The data favor a model, in which the cloudlets are quite small ( 0.1 pc) and numerous, and they are weighted according to their surface filling factor both in emission and in absorption for any line of sight. The existence of such small scale structure is also confirmed by VLBI HI absorption (Faison et al. 1998), where sizes down to 20 AU are detected. It is also very likely that the structure, apart from these smallest fragments, has no particular scale. If it is a fractal, statistically, there is a correlation between the optical depth between scales with a limited scatter. This would explain the observed correlation between emission and absorption at different scales. When the emission/absorption measurements for HVCs are considered (cf Figure 4) the lower limits on derived spin temperature are compatible with the detections on the normal low-velocity gas and their Ts- relation. The spin temperature of HVCs is a weighted mean of the warm and cold components, with the same mixtures as the one observed in normal low-velocity clouds of the galactic plane. The difficulty to find HI in absorption in HVCs corresponds then only to their low average column density, and not to a different physical structure.
As for molecular absorptions, the column densities to which a detection is possible is even larger. The corresponding scales must be smaller, and consequently the corresponding line-widths narrower. This is observed for low-velocity absorptions, where the detected line-widths are as narrow as 0.6 km s-1(LL96). The detected optical depths are larger on average, and the probability to underestimate the column density is higher, because of saturation. (One should note though that the apparent optical depth is low because of spatial and velocity dilutions.) The probability of detection of the HCO+(1-0) absorption has been estimated to be 30% as large as the 21cm absorption for galactic clouds (LL96). The presently observed low probability to find an HCO+(1-0) absorption is therefore expected. In addition, there could be a column density threshold for self-shielding against photo-dissociation, that hampers molecular observations. This threshold has been estimated for CO emission to N(H2) 41020 cm-2 (or equivalently of the order of 1012 cm-2 for HCO+). If our tentative detection is confirmed, given the low metallicity of the HVCs, this will support the existence of clumps of high column densities in this medium. The fact that molecular absorption is more frequent with respect to emission than atomic absorption is related to the excitation mechanism. Large volumic critical densities are required to excite molecules above the cosmic background, and this is in particularly true for HCO+. This makes absorption techniques the more promising to probe the molecular content of HVCs in the future.
4.3 Physical nature and distance of the gas
Since the HVCs appear to follow in projection the same fractal properties as the normal low-velocity gas (Vogelaar & Wakker 1994), it could be interesting to develop an insight in their distance from their size-linewidth relation. It is now well established that clouds in the interstellar medium (either molecular or atomic) are distributed according to a self-similar hierarchical structure, characteristic of a fractal structure (Falgarone et al. 1991; Stanimirovic et al. 1999; Westpfahl et al. 1999). Such a scaling relation between mass and size, can also lead to a relation between size and line-width, provided that the structures are virialized. In particular, various clouds at all scales obey a power-law relation between sizes and line-widths or velocity dispersion :
with between 0.35 and 0.5 (e.g. Larson 1981, Scalo 1985, Solomon et al 1987). We have plotted this latter relation, together with the sizes and line-widths of the 65 well defined isolated HVCs, catalogued by Braun & Burton (1999). This catalog is expected to be free from galactic contamination as well as from blending along the line of sight, because of the isolation criterium imposed for their selection. To compute their sizes, two distances were assumed, either 20 kpc, or 1 Mpc, and the geometrical mean between major and minor axis was calculated. At a distance of 20 kpc, the clouds fall on the relation corresponding to Giant Clouds in the Galaxy. Note that the large scatter is due to the fact that this choice of distance is only one order of magnitude, and the HVCs are certainly not all at the same distance. This set of clouds has been determined with a spatial resolution of half a degree. The clouds determined at higher spatial resolution have correspondingly narrower line-widths. In Figure 5, we have also plotted the characteristics of clouds determined with the Westerbork interferometer, at 1 arcmin resolution (Wakker & Schwarz 1991). They also fit the galactic clouds relation on average, if their distance is chosen to be 20 kpc, with large scatter since individual distances are also not known. In fact, HI observations at different spatial resolutions emphasize a particular scale of the hierarchical structure (see e.g the 10’ resolution observations by Giovanelli & Haynes 1977). This hierarchical structure is similar to what is observed for “normal” galactic clouds, in the sense that the same fraction 20-30% of the single dish flux is retrieved in the interferometer data (Wakker & Schwarz 1991).
The size-linewidth relation has been widely observed up to 100pc in size, the largest size for self-gravitating clouds in the Galaxy, but it might appear questionable to extend it to higher scales, where the gas would not be self-gravitating. At these scales, the gas is bound into largest self-gravitating structures, including stars or dark matter. However, even at these scales, the gas should trace the gravitational potential of the bound structure it is embedded in, and share the corresponding velocity dispersion; such a relation is observed for instance in the form of the Tully-Fisher relation in galaxies. The main point is that the gas should reveal velocity profiles in emission that should grow wider with the distance, if it belongs to an assumed self-gravitating remote system. The observed profile width is therefore a distance indicator.

4.4 Conclusion
We have searched for HCO+(1-0) absorption towards 27 high velocity clouds, in front of remote radio-loud quasars. The technique is efficient, since we detect the existing absorption due to low velocity galactic clouds, for our low latitude sources. Only one tentative HVC detection is reported. If confirmed, this indicates the presence of small scale cloudlets, at low excitation and high column densities, prolonging the hierarchical structure already observed in the atomic component at larger scale. When this hierarchical structure is compared to the one observed for low-velocity galactic clouds, a good fit is obtained for the self-similar relation between sizes and line-widths, if the HVCs are on average at 20 kpc distance. Since mm molecular absorptions are expected to be more frequent than emission for these low column density HVCs, this absorption technique appears promising to probe the molecular component of HVCs, already directly detected by UV H2 absorption lines (Richter et al 1999).
Acknowledgements.
We are very grateful to R. Giovanelli for useful comments on the manuscript, to B. Wakker and F. Mirabel for stimulating discussions, and an anonymous referee for constructive criticism. We also thank the SEST staff for their kind help during the observations, and Raphael Moreno and Robert Lucas for their assistance in the IRAM interferometer data reduction.References
- (1) Akeson R.L., Blitz L., 1999, ApJ 523, 163
- (2) Babul A., Rees M.J., 1992, MNRAS 255, 346
- (3) Bajaja E., Cappa de Nicolau C.E., Cersosimo J.C., et al., 1985, ApJS 58, 143
- (4) Banks G.D., Disney M.J., Knezek P.M., et al., 1999, ApJ 524, 612
- (5) Blitz L., Spergel D. N., Teuben P.J., Hartmann, D., Burton, W. B., 1999, ApJ 514, 818
- (6) Bond J.R., Szalay A.S., Silk J., 1988, ApJ 324, 627
- (7) Bowen D.V., Blades J.C., 1993, 403, L55
- (8) Braun R., Burton W.B., 1999, A&A 341, 437
- (9) Colgan S.W., Salpeter E.E., Terzian Y., 1990, ApJ 351, 503
- (10) Combes F., Wiklind T. 1996, in Cold Gas at High Redshift, eds. Bremer M., van der Werf P., Carilli, C., Kluwer, p. 215
- (11) Davis D.S., Mulchaey J.S., Mushotzky R.F., Burstein D., 1996, ApJ 460, 601
- (12) Dickey, J. M., Kulkarni, S. R., van Gorkom, J. H., Heiles, C. E., 1983, ApJS 53, 591
- (13) Faison M.D., Goss W.M., Diamond P.J., Taylor G.B., 1998, AJ 116, 2916
- (14) Falgarone E., Phillips T.G., Walker C.K.: 1991, ApJ 378, 186
- (15) Garwood R.W., Dickey J.M., 1989, ApJ 338, 841
- (16) Giovanelli R., 1981, AJ 86, 1468
- (17) Giovanelli R., Verschuur G. L., Cram T. R., 1973, A&AS 12, 209
- (18) Giovanelli R., Haynes M.P., 1977, A&A 54, 909
- (19) Guilloteau, S., Delannoy, J., Downes, D., et al. 1992, A&A 262, 624
- (20) Hartmann, D., Burton W.B., 1997, Atlas of galactic neutral hydrogen, Cambridge; New York, Cambridge University Press
- (21) Houck J., Bregman J.N., 1990, ApJ 352, 506
- (22) Katz N., Weinberg D.H., Hernquist L., Miralda-Escude J., 1996, ApJ 457, L57
- (23) Keenan F.P., Shaw C.R., Bates B., et al., 1995, MNRAS 272, 599
- (24) Kepner J., Babul A., Spergel D.N., 1997, ApJ 487, 61
- (25) Larson R.B., 1981, MNRAS 194, 809
- (26) Lockman F.J., Savage B.D.: 1995, ApJS 97, 1
- (27) Lu L., Savage B.D., Sembach K.S., 1994, ApJ 426, 563
- (28) Lucas R., Liszt H.S., 1994, A&A 282, L5
- (29) Lucas R., Liszt H.S., 1996, A&A 307, 237 (LL96)
- (30) Mathewson D. S., Cleary M.N., Murray J. D., 1974, ApJ, 190, 291
- (31) Mathewson D. S., Schwarz M. P., Murray J. D., 1977, ApJ, 217, L5
- (32) Mebold U., Greisen E.W., Wilson W., et al., 1991, A&A 251, L1
- (33) Mirabel I.F., Cohen R.J., 1979, MNRAS 188, 219
- (34) Muller C.A., Oort J.H., Raimond E., 1963, C.R. Acad. Sci. Paris, 257, 1661
- (35) Murphy E., Lockman F.J., Savage B.D., 1995, ApJ 447, 642
- (36) Oort J.H., 1966, Bull. Astr. Inst; Netherlands, 18, 421
- (37) Oort J.H., 1970, A&A 7, 381
- (38) Payne H.E., Salpeter E.E., Terzian Y., 1980, ApJ 240, 499
- (39) Payne H.E., Salpeter E.E., Terzian Y., 1983, ApJ 272, 540
- (40) Putman M.E., Gibson B.K., 1999, PASA 16, 70
- (41) Renzini A., 1997, ApJ 488, 35
- (42) Richter P., de Boer K.S., Widmann H. et al., 1999, Nature 402, 386
- (43) Robertson J.G., Schwarz U.J., van Woerden H., et al, 1991, MNRAS 248, 508
- (44) Sasselov D.D., 1993, ed of ASP Conf. Proc. 45, ”Luminous High Latitude Stars (San Francisco)
- (45) Savage B.D., Lu L., Bahcall J.N. et al. 1993, ApJ 413, 116
- (46) Scalo J.M., 1985, in Protostars and Planets II, ed. D.C. Black & M.S. Matthews, Univ. of Arizona Press, Tucson, p. 201
- (47) Sembach K.R., Savage B.D., 1996, ARA&A 34, 279
- (48) Sembach K.R., Savage B.D., Lu L., Murphy E.M. 1995, ApJ 451, 616
- (49) Sembach K.R., Savage B.D., Lu L., Murphy E.M. 1998, AAS 192, 5108
- (50) Solomon P.M., Rivolo A.R., Barrett J.W., Yahil A., 1987, ApJ 319, 730
- (51) Stanimirovic, S., Staveley-Smith, L., Dickey, J. M., Sault, R. J., Snowden, S. L.: 1999, MNRAS 302, 417
- (52) Stark A.A., Gammie C.F., Wilson R.W. et al., 1992, ApJS 79, 77
- (53) van Woerden H., Schwarz U.J., Peletier R.F., Wakker B.P., Kalberla P.M.W., 1999, Nature 400, 138
- (54) Vogelaar M.G.R., Wakker B.P., 1994, A&A 291, 557
- (55) Wakker B. P. 1991, A&A, 250, 499
- (56) Wakker B. P., Schwarz U. J., 1991, A&A, 250, 484
- (57) Wakker B. P., Vijfschaft B., Schwarz, U. J. 1991, A&A, 249, 233
- (58) Wakker B. P., van Woerden H., 1991, A&A, 250, 509
- (59) Wakker B. P., van Woerden H., 1997, ARA&A, 1997, 35
- (60) Wakker B. P., Murphy E.M., van Woerden H., Dame T.M., 1997, ApJ 488, 216
- (61) Wakker B. P., Howk J.C., Savage B.D., et al., 1999, Nature, 402, 388
- (62) Westpfahl, D. J., Coleman, P. H., Alexander, J., Tongue, T.: 1999, AJ 117, 868
- (63) Wiklind T., Combes F., 1997, A&A 328, 48
- (64) Zwaan M.A., Briggs F.H., Srayberry D., Sorar E., 1997, ApJ 490, 173