Resonant scattering of X-rays by the warm intergalactic medium
Abstract
For the low density filamentary and sheet-like structures in the warm ( to K) IGM predicted by numerical simulations the resonant line scattering of X–ray background (XRB) photons by He and H–like ions of heavy elements can exceed the “local” thermal emission by a factor of a few or more. Due to the conservative nature of scattering this resonantly scattered radiation can only be identified if a significant fraction of the XRB is resolved and removed. While the combined spectrum of the resolved sources will contain X–ray absorption features, the residual background will contain corresponding emission features with the same intensity. At the relevant densities and temperatures the lines of He and H–like oxygen at 0.57 and 0.65 keV are most promising. These lines (which have a typical width of 1–2 eV) may contain up to 50% of the total 0.5–1 keV emission of the filament. For a nearby () filament with a Thomson optical depth of XMM should detect about 200 photons in the OVII line during a s exposure if the metallicity of the gas is as large as observed in galaxy clusters. On average up to a few percent of the soft XRB could be resonantly scattered by this phase of the IGM and resonantly scattered photons should account for a significant fraction of the truly diffuse background at low energies. Close to bright X-ray sources like galaxy clusters or AGN the flux of scattered radiation will be further enhanced. Off-line blazars are the most promising illuminating sources. The scattered emission from AGN may also constrain the duration of the active phase of these objects.
keywords:
Radiation mechanisms: thermal – Line: formation – Cosmology: large scale structure of the universe – X–rays: general1 Introduction
At high redshift the majority of baryons are contained in a photoionized IGM with temperature which is responsible for the strong Ly absorption in the spectra of high redshift objects (see Rauch 1998 and Weinberg 1999 for reviews). At low redshift, however, there are little observational constraints on the thermal state and baryon content of the IGM (e.g. Barcons, Fabian & Rees 1991). Numerical simulations predict that a considerable fraction of all baryons is still contained in a warm IGM which traces the filamentary and sheet-like distribution of the dark matter (e.g. Ostriker & Cen, 1996, Cen & Ostriker 1999). This phase of the IGM should have densities of a few up to a few tens times the mean baryonic density. The temperatures should range between a “ photoionization temperature” at low densities () and the virial temperature of sheets and filaments ( ). These temperatures might be enhanced due to the energy input by star formation and AGN and it has been argued that such an energy input is necessary to explain the X-ray luminosity temperature relation of galaxy clusters (Kaiser 1991; Ponman, Cannon & Navarro 1999; Pen 1999). This “warm” phase of the IGM is of special interest as it will contain a record of the energy and metals expelled from galaxies. The typical surface brightness of filaments due to local thermal emission of the diffuse gas is, however, a factor 100 or more smaller than that of the X-ray background. This local thermal emission will be detectable with XMM only for especially strong filaments (Pierre, Bryan & Gastaud 1999) but see Scharf et al. (1999) for a claimed detection of such a filament with ROSAT. It was also suggested that the warm IGM produces measurable absorption in the resonant transitions of heavy elements such as oxygen or iron if there is a bright quasar behind the gas (Shapiro and Bahcall 1980, Aldcroft et al., 1994, Hellsten, Gnedin, Miralda–Escude 1998, Perna and Loeb, 1998, Markevitch, 1999). This seems a promising method to study the warm IGM, especially as long as high energy resolution is only possible for bright sources (i.e. using gratings). It will, however, only give information along the line-of-sight to point sources. We explore here the possibility to investigate the warm IGM by its emission due to resonant scattering of X-ray background photons by He and H–like ions of heavy elements. While for the high density and temperatures in galaxy clusters the local thermal emission clearly dominates over resonant scattering the opposite is true for the more moderate densities and temperatures expected in the sheet-like and filamentary structures of the warm phase of the IGM.
In section 2 we discuss the importance of resonant scattering relative to the local thermal emission due to collisional excitation and ionization for the temperatures and densities prevalent in the warm IGM. Section 3 discusses the detectability of filamentary structures with upcoming satellite missions. In section 4 we discuss the illumination of filamentary structures by individual bright sources and section 5 contains our conclusions.
A Hubble constant of and an Einstein-de-Sitter Universe was assumed throughout the paper. For the baryon density we take (, Burles et al., 1999). The abundances of heavy elements were assumed to be a constant fraction of solar abundances as given by Feldman (1992). For the local XRB spectrum we use the simple approximation for energies and a power law with a photon index of 2 below 1 keV, where (e.g. Barcons & Fabian 1992, Miyaji et al. 1998).
2 Photoionization balance and emissivity of the warm gas
2.1 Typical densities and temperatures
We discuss here the emission from typical sheet-like and filamentary structures in the warm intergalactic medium taking into account the resonant scattering of X-ray background photons. The characteristic sheets and filaments seen in numerical simulations are the result of the non-linear collapse of density perturbation imprinted onto the matter distribution in the early Universe. Sheets form from perturbations which collapse along one axis (Zeldovich 1970) while filaments have collapsed along two axis. This results in typical overdensities of a few in sheets and a few tens in filaments. The typical Thomson optical depth scales linearly with the length scale of the density perturbation and will be about for sheets and filaments, respectively. Note that is approximately the scale on which the present-day density field has gone non-linear. The space density of structures larger than this decreases exponentially. Typical temperatures in the warm IGM are somewhat uncertain but will be strongly correlated with density. In the absence of energy input from star formation and AGN the temperatures at low densities are set by the balance of photoheating and adiabatic cooling and lie in the range 3000 -10000 K (e.g. Hui & Gnedin 1997). At higher densities the gas will be shock-heated. In virialized regions the temperatures will be set by the virial temperature of sheets and filaments and should be about . The energy input from star formation and AGN will raise this temperatures especially at low densities. Ponman, Cannon & Navarro (1999) e.g. suggest a minimum “entropy” of to explain the X-ray luminosity temperature relation of galaxy clusters at the faint end.
In the discussion below we consider two examples: emission from regions with an overdensity of (5,30), corresponding to a electron density of (,), a temperature of (,), and a metallicity of (10%,30%) solar which may resemble a typical sheet and filament, respectively. For a size of 8 Mpc a sheet and filament will have a Thomson optical depth of respectively. The emission spectra are calculated below for zero redshift.
2.2 Thermal emission of the gas in collisional equilibrium
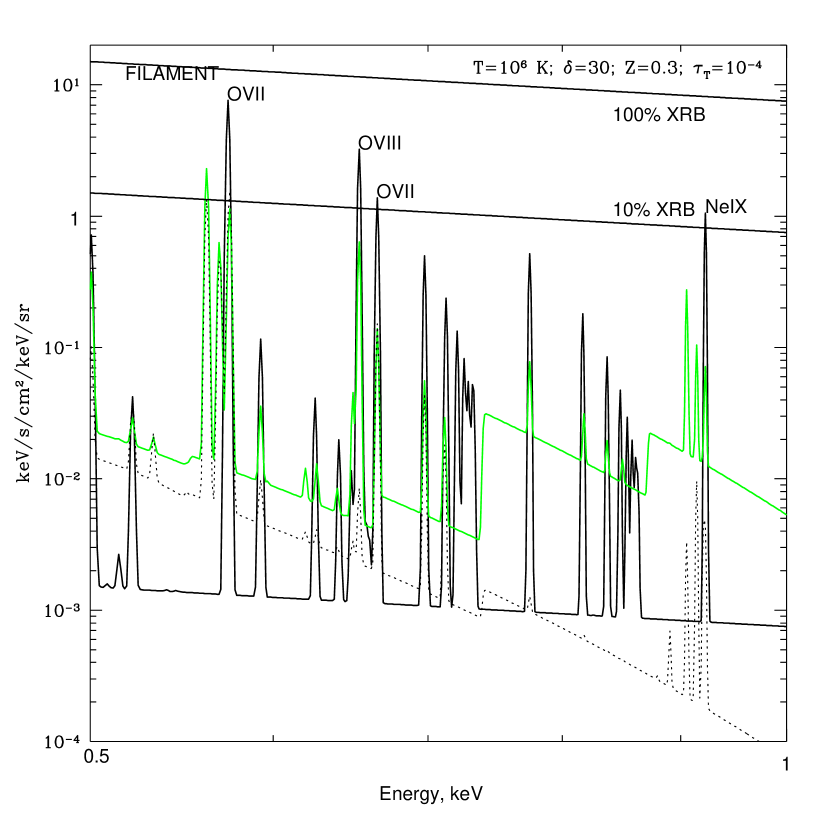
For gas with given density and temperature in pure collisional equilibrium (coronal approximation) the following processes contribute to the X–ray emission: continuum emission (free-free and bound-free), recombination lines and emission lines excited by electron collisions. In the following we call these emission mechanisms collectively “thermal” emission. We used the code MEKA [Mewe, Gronenschild & van den Oord 1985, Mewe, Lemen & van den Oord 1985, Kaastra 1992] as implemented in the software package XSPEC v10 [Arnaud 1996] to calculate this thermal emission. For our adopted parameters the X–ray emissivity of the gas in filaments and sheets is extremely low (due to both the low temperature and the low density of the gas). Detecting these structures requires very high sensitivity. The thermal emission from a typical filament in the 0.5–1 keV energy band (in units of to facilitate comparison with the XRB surface brightness) is shown in Fig. 1 by the dotted curve. For comparison the intensity of the XRB is shown by the solid line. For our canonical sheet the emissivity is several orders of magnitude lower and well below the limits of the plot.
The intrinsic width of the lines should be dominated by the Hubble flow, peculiar and turbulent velocities rather than thermal broadening. In the considered energy range of 0.5–1 keV the velocity dispersion of 500-1000 implies a width of –2 eV. The spectra shown in all figures are convolved with a Gaussian with a FWHM of 2 eV. We note here that this kind of resolution may be achieved by projected X-ray missions like Constellation-X or XEUS.
2.3 Influence of the XRB on the thermal emission
The IGM is exposed to XRB photons. These photons change the ionization balance of the IGM, producing ions at higher ionization stage than expected for pure collisional ionization at a given temperature. The importance of photoionization depends on the temperature and density of the gas. The total ionization rate of a given ion is
| (1) |
where is the electron density, and is the collisional ionization rate (in ) which is a function of temperature. The second term in eq.(1) accounts for photoionization, where is the background intensity () and is the photoionization cross section. We used the approximations for photoionization cross sections given by Verner & Yakovlev (1995) and Verner et al. (1996). For simplicity we neglected ejection of multiple electrons which may follow innershell ionization. For the other processes affecting the ionization balance (i.e. collisional ionization and photo and dielectronic recombinations) we used the values adopted in the MEKA code. The characteristic time for photoionization of oxygen ions by XRB photons, is for OVII and for OVIII. This is somewhat shorter than the Hubble time and ionization equilibrium is approximately established111For the high abundances of OVII and OVIII in which we are interested here the recombinations time scales are of the same order.. At the densities and temperatures typical for the warm IGM the oxygen is mainly in the form of He and H–like ions, as shown in Fig.3. The symbols (dots for OVIII and circles for OVII ions respectively) show the areas on the temperature/overdensity plot where the fraction of He and H–like ions of oxygen is larger than 30%. OVII and OVIII more or less trace the density temperature relation of the warm IGM. A fraction larger than 30% is expected for practically the whole range of densities and temperatures prevalent in the warm IGM (see also Hellsten et al. 1998).
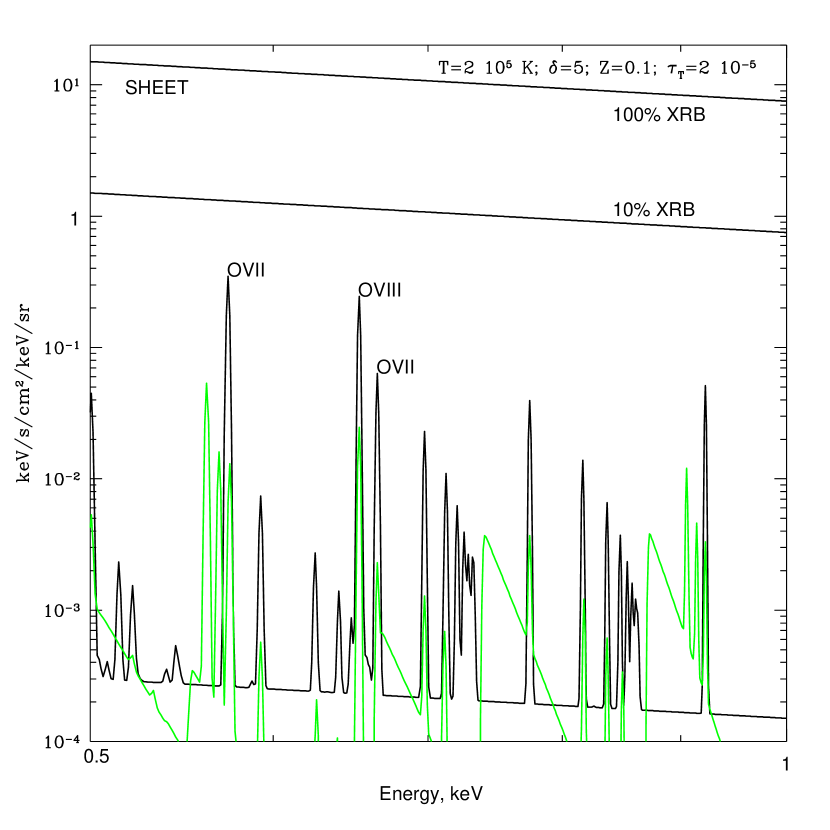
The change of the ionization balance due to photoionization affects the bound-free radiation, recombination lines and strength of the lines excited by electron collisions. The free-free emission does not change compared to the gas at the same temperature in collisional equilibrium. The corresponding thermal emission spectra (i.e. the sum of the free-free, bound-free continuums, recombination and collisionally excited lines) are shown by the grey lines in Fig.1,2 for our canonical filament and sheet, respectively. The change of the ionization state due to photoionization strongly enhances the X–ray emissivity of the gas. Photoabsorbed XRB photons are effectively converted into recombination radiation (in the form of bound-free radiation and recombination lines). The effect is especially strong when the temperature of the gas is low, e.g. around . In this case the gas does hardly emit any X–rays if photoionization is neglected.


2.4 Resonant scattering vs local thermal emission
Resonant scattering of XRB photons is even more important than the enhancement of the thermal emission of the gas due to photoionization. The emissivity of resonantly scattered radiation () can be written as,
| (2) |
where is the line energy and is number density of a given ion. Hereby , where is the oscillator strength, is the electron charge, is the electron mass, is the speed of light, and is the conversion factor from Hz to keV. The number density of a given ion is
| (3) |
where is the hydrogen density in the warm IGM, is the solar abundance of a given element relative to hydrogen, is the abundance of the element relative to solar abundance and is the fraction of atoms in a given ionization state.
The resonantly scattered flux in a given line is proportional to the number density of the ion. It is convenient to express its intensity in terms of the intensity of the Thomson scattered continuum, which is proportional to the density of the electrons. The emissivity of the Thomson scattered continuum is given by,
| (4) |
where is the electron density and is the Thomson cross section. The total scattered spectrum (i.e. the sum of resonantly and Thomson scattered radiation) is shown in Fig.1,2 by the thick solid curves222Here we use the list of the strong resonant lines compiled by Verner ()..
| Ion | Abundance () | Energy (keV) | (keV) |
|---|---|---|---|
| CV | 3.98E-04 | 0.31 | 46.6 |
| CVI | 0.37 | 27.5 | |
| NVI | 1.00E-04 | 0.43 | 11.7 |
| NVII | 0.50 | 6.9 | |
| OVII | 8.51E-04 | 0.57 | 99.6 |
| OVIII | 0.65 | 58.9 | |
| NeIX | 1.29E-04 | 0.92 | 15.1 |
| NeX | 1.02 | 8.9 | |
| MgXI | 3.80E-05 | 1.34 | 4.4 |
| MgXII | 1.47 | 2.6 | |
| SiXIII | 3.55E-05 | 1.85 | 4.1 |
| SiXIV | 2.00 | 2.4 | |
| SXV | 1.62E-05 | 2.45 | 1.9 |
| SXVI | 2.62 | 1.1 | |
| FeXXV | 3.24E-05 | 6.67 | 3.8 |
| FeXXVI | 6.97 | 2.2 |
The ratio of resonantly and Thomson scattered emissivity (i.e. the equivalent width) is,
| (5) |
This expression is of course only valid for an optically thin medium. The equivalent widths for He and H–like ions are given in Table 1 assuming unity for the fraction of the ionization state and solar abundances. Along an isoelectronic sequence (e.g. for He–like ions of heavy elements) the oscillator strength for a given transition is approximately constant. Not surprisingly the resonant transitions of H and He-like oxygen (OVII and OVIII) are particularly strong due to the high oxygen abundance.333For neutral gas an analogous relation exists between the Thomson scattered continuum and intensity of the fluorescent lines (e.g. Vainshtein, Sunyaev 1980). Resonant scattering and photoionization have a comparable effective cross sections, but an additional branching ratio (radiative decay vs autoionization – Auger effect) enters the expression for the equivalent width in the case of fluorescent lines. This branching ratio is small for light elements (e.g. 0.005 for the oxygen 1s-2p transition) and reaches 0.3 for iron. Because of this the equivalent width of the fluorescent lines from neutral gas is always much lower (except for the iron line at 6.4 keV) than in the case of resonant scattering for H- and He-like ions.
We now compare the emissivity of the gas due to scattering and that due to thermal emission (taking into account photoionization by XRB). The ratio depends strongly on the temperature and density of the gas as shown in Fig.4. Both scattered and thermal emission were integrated over the energy range 0.5–1 keV. At low densities and low temperatures the ratio is about 3–4. For these parameters photoionization strongly dominates over collisional ionization. As a result the ratio of the scattered and thermal emission (the latter being dominated by recombination radiation) is proportional to the factor , where the summation in the denominator is over all ions and in the numerator over all ions and lines. For strong individual lines this ratio is about 3–4. For our canonical filament the 0.5–1 keV emissivity of the gas due to resonant scattering exceeds the thermal emission of the photoionized gas by a factor of about 2. In Fig.5 we compare the emissivity (including scattered radiation) of the gas photoionized by the XRB to the pure thermal emission of the gas if it were in collisional ionization equilibrium. The ratio of the emissivities (integrated over the 0.5–1 keV energy band) is shown as a contour plot. For our canonical filament this ratio is about 5–10 while for the sheet it is more than . We conclude that estimates for the detectability of the warm IGM which neglect either scattering of the soft X-ray background and/or photoionization of the IGM by the soft X-ray background are overly pessimistic.
Finally, we compare the emissivity due to resonant scattering in the OVII line which is likely to be the strongest line at the relevant temperature and densities, to the total integrated emissivity in the energy range 0.5–1 keV (Figure 6). For a typical filament about 30 percent of the total flux is emitted in the resonant line of OVII .
2.5 The contribution of resonant scattering to the diffuse X-ray background
The intensity of a background scattered by a medium with uniform density is given by a formula similar to the Gunn-Peterson relation (Gunn and Peterson, 1965, Shapiro and Bahcall 1980, Aldcroft et al., 1994). In an Einstein-de-Sitter Universe this takes the form,
| (6) |
Here is the intensity of the scattered background at the observed energy (). Equation (6) assumes that temperature, abundance and ionization state of the gas do not evolve with redshift and that the XRB is due to distant sources. For the – transition of He–like oxygen the above gives approximately,
| (7) |
The exact contribution of resonantly scattered photons to the XRB is difficult to assess and will depend on the detailed density, temperature and metal distribution of the IGM. From equation (7) we can, however, infer that the contribution should be at the percent level for energies below the strong resonance lines of oxygen.
From equation (7) we can also see that the warm IGM is optically thin in the strong OVII resonance line up to an overdensity of at least 30 even if the metallicity is high and the OVII fraction is large. For other lines the optical depth will be generally smaller.


3 Detectability of filamentary structures in the warm IGM
3.1 Detecting resonance scattering from diffuse gas in emission
Note that neither the number nor the energy of photons change during resonant scattering. Resonant scattering would not change the XRB flux if the XRB were completely homogeneous and isotropic444 To a smaller extent this is also true for the photoabsorbed photons of the XRB which are reemitted as recombination photons.. However, the XRB is emitted by discrete sources and resonance scattering converts photons emitted by compact sources into a diffuse background.
The resonantly scattered emission will be detectable in images in which discrete sources making up a significant fraction of the total background have been removed. This is demonstrated in Fig.7 which shows the spectrum of our canonical filament (taking into account the XRB) and the case were 90 percent of the background has been removed. ROSAT has e.g. resolved 70-80% of the XRB in the energy range 0.5–2 keV (Hasinger et al., 1998). At the lower end of this range the situation is somewhat unclear mainly due to the emission of our own Galaxy.
The spectral resolution of X-ray instruments is dramatically increasing. XMM and Chandra will have the first instruments with high spectral resolution (using gratings) but only for bright compact sources. With projected missions like Constellation-X and XEUS imaging with a spectral resolution of about 2 eV will become possible. The large ratio of resonantly scattered emission to the Thomson scattered continuum and the local thermal emission makes the search for the spectral feature of resonantly scattered radiation very worthwhile. Detecting the warm IGM by photons scattered in the OVII or OVIII resonant transitions has another big advantage. Filaments and sheets contain a large number of faint galaxy clusters and galaxy groups. The emission from the dense hot gas in these clusters and groups generally dominates the thermal emission from filaments. However, in this dense and hot gas oxygen is generally completely stripped from electrons and no resonant scattering will occur in these regions. The resonantly scattered radiation will thus be a good tracer of the diffuse gas in filaments. The only contamination should be due to resonant oxygen scattering by the warm gas which may be contained in the galaxies within the filaments.
The highest signal to noise ratio can be achived if OVII or OVIII absorption lines are observed in the spectrum of a very bright compact source located behind the filament as first suggested by Shapiro and Bahcall (1980). The longest exposures (deep surveys) however are usually collected for fields without strong X–ray sources. For such fields the detection of OVII or OVIII resonant lines in emission in the residual background is favorable compared to the detection of these lines in absorption using the combined spectrum of all resolved background sources in the field. The number of line photons in the residual background is approximately equal to the number of line photons absorbed from the spectra of all resolved sources. The intensity of the residual background is, however, lower if most of the background is resolved. This results in a higher signal-to-noise ratio for the residual background. It means that in order for such a method to be useful the particle and other “non cosmological” detector backgrounds have to be low compared to the combined intensity of the resolved sources in the field.
3.2 Detecting filaments with upcoming satellite missions
| XMM (EPIC pn) | Chandra | XEUS | Constellation-X | |
|---|---|---|---|---|
| Area@0.5 keV, | 1300 | 260 | 30000 | 5000 |
| FOV, | (;) | |||
| , eV | 60 | 100 | (1;50) | 2eV |
| (;) | ||||
| (;) |
In an Einstein de Sitter Universe our canonical filament of comoving size ( has angular extent at , respectively. In the case of a filament, completely filling the FOV the expected number of counts in the oxygen line is proportional to the product of the effective area and the FOV (solid angle) of the telescope. This value is largest for XMM and is comparable for the Wide field imager of XEUS. Estimates of the effective area, FOV and energy resolution are summarized in Table 2. For a nearby () filament with Thomson optical depth of XMM (EPIC pn detector) will detect about 200 counts in the OVII line in a s exposure. For Chandra the expected number of counts is about an order of magnitude lower.
The total particle background in a 60 eV band pass (the resolution of XMM at 0.5 keV) will be at the level of 50–60 counts for a s exposure. The residual unresolved extragalactic background (assuming that 90% will be resolved) will produce 1000 counts. The biggest problem is probably Galactic emission. Galactic emission is usually modeled as a combination of two thermal (i.e. thermal emission of optically thin plasma) components with temperatures 0.15 and 0.05 keV respectively (e.g. Miyaji et al., 1998). A redshift of 0.1 should, however, be sufficient to distinguish oxygen lines produced by a filament from oxygen lines produced in the Galaxy. Galactic emission will produce several thousand counts in a 60 eV wide band pass. For a second XMM exposure the signal-to-noise ratio will thus be of order a few. Similar signal-to-noise ratios can be achieved for the OVIII line at 0.65 keV. Such signal-to-noise ratios should be sufficient for a meaningful cross-correlation with the redshift distribution of galaxies in the same field. Longer exposure times, filaments with larger Thomson optical depth, mapping of larger areas of sky or illumination by a nearby bright X-ray source as described in the next section will be necessary to increase the signal-to-noise ratio.
The anticipated FOV of Constellation X and of the Narrow field imager of XEUS is rather small (see Table 2). The total number of photons detected in the OVII and OVIII lines for a filament filling the whole FOV will therefore be an order of magnitude lower for these missions than for XMM for a similar exposure time(except for the Wide field imager of XEUS, which will detect a similar number of photons). The signal-to-noise ratio (assuming pure statistical errors due to residual unresolved extragalatic and Galactic background within the band pass set by the energy resolution of the telescope) will nevertheless be similar due to the better energy resolution of XEUS and Constellation X. For an efficient study of the diffuse emission of filaments a larger FOV would be very important. If it were possible to increase the FOV to e.g. (below 1 keV) for high energy resolution detectors like those of Constellation X and XEUS then these missions should be able to detect resonantly scattered emission of filaments along any line of sight during a 50ks exposure.
4 Illumination by a nearby bright source
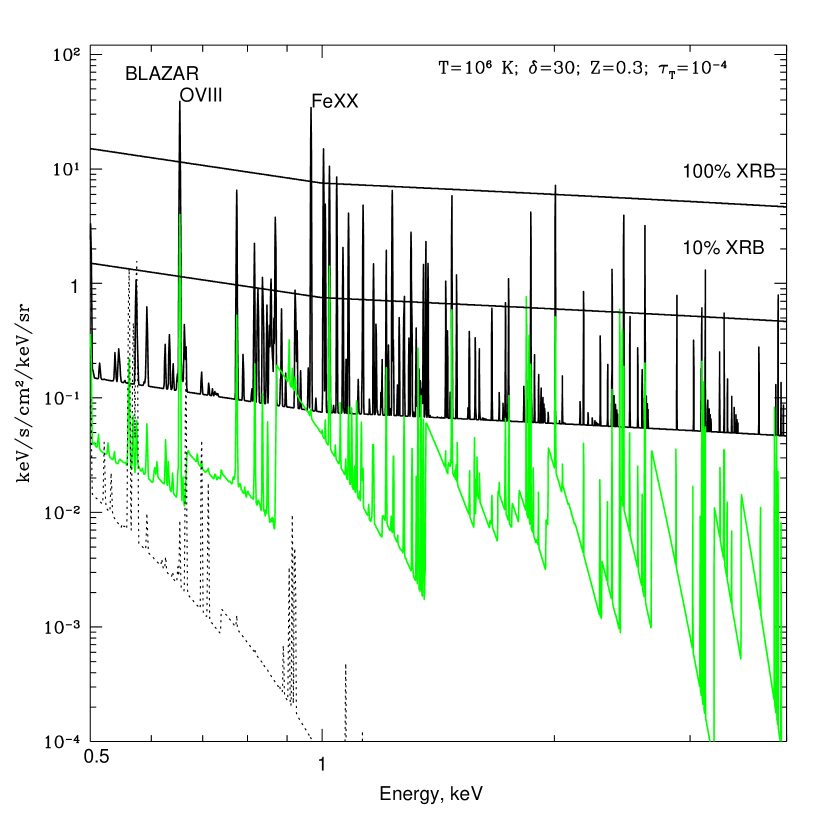
Close to a bright source the emission due to resonant scattering is obviously enhanced both relative to the local emission and relative to the background. Bright sources may have soft X-ray luminosities of or larger and exceed the soft X-ray background by a factor out to a radius and the signal-to-noise ratio will be enhanced by the same factor. Particular interesting is the illumination of strong filaments close to rich galaxy clusters by either the X-ray emission from the core of the cluster or by a bright AGN contained in the cluster. This is illustrated in Fig.8, where we show the intrinsic and scattered emission for the same parameters as in Fig. 1, but with a factor 100 larger intensity of the illuminating continuum. For simplicity we assumed the same shape for the quasar spectrum as for the XRB. The increased X-ray flux also affects the ionization state of the gas. The relevant quantity is the ionization parameter which is proportional to the ionizing flux. The regions in Fig.3 will e.g. shift linearly to the right with increasing flux (at least approximately for the moderate densities and temperatures where collisional ionization is not important). This shifts the dominant ionization state from OVII to OVIII. The strongest line in Fig.8 is indeed that of OVIII at 0.65 keV. The local thermal emission is also strongly enhanced (compare the dotted to the grey and thick solid curves in Fig.8). Very close to bright sources oxygen may be even completely stripped due to photoionization. The fraction of H–like ions is then inversely proportional to the blazar flux while the number of scattered photons (e.g. in the H-like 1s-2p transition) is proportional to the blazar flux and the density of H-like ions. The resonantly scattered flux will then not depend on the illuminating flux anymore and will instead be proportional to the recombination rate. The number of resonantly scattered photons will still be larger than the number of recombination line photons by a factor of few. On the other hand the Thomson scattered flux is simply proportional to the intensity of illuminating radiation. The relative importance of the Thomson scattered continuum is thus strongly enhanced close to a strong ionizing source.
The number of bright AGN which are available for an illumination of filaments is much larger than naively inferred from the AGN luminosity function. A considerable fraction of bright AGN are blazars with strongly beamed radiation. If these typically have an opening angle of 5 degrees there will be about 2000 objects which point away of us for any observed blazar.
Note that in the case of illumination by individual bright sources the assumption of an isotropic phase function for the resonant scattering which we made so far is not valid. The phase function will depend on the particular transition. For the – transitions of He–like ions the phase function will e.g. be the familiar dipole (see e.g. Chandrasekhar 1960) and the scattered radiation will be polarized.
The illumination of filaments by an AGN may also constrain the lifetime of these objects. If the active phase of AGN lasts for about years then the observed size of the illuminated region will be of the order of 3 Mpc (depending on the angle of the beam to the line of sight). Of course the observed flux in the scattered lines depends on a number of factors (density, temperature, blazar flux, heavy elements abundance etc.). Various structures in the surface brightness which may appear as a result of scattering of beamed radiation are considered by Gilfanov, Sunyaev & Churazov (1987) and Wise & Sarazin 1990.
The time, needed to establish photoionization equilibrium is inversely proportional to the photoionization rate and is equal to . Thus if the blazar was active for a shorter period of time or the beam direction varies (e.g. due to precession of the jet) then the influence of the photoionization by the blazar emission will be lower accordingly. The analysis of gas illuminated by a nearby sources is therefore not straightforward. It will, however, be easier to interpret for beamed sources than for isotropic sources.
5 Conclusions
We have demonstrated that for the temperatures and densities prevalent in the the filamentary and sheet-like structures of the warm intergalactic medium illumination by XRB photons significantly increases the X–ray emissivity of the medium. The strongest contribution to the X–ray emissivity is due to resonant scattering of XRB photons. This resonantly scattered emission can be detected in images from which a significant fraction of the XRB due to compact sources has been removed.
Resonant lines of He and H-like oxygen are most promising for detecting filamentary structures in the warm IGM. The fraction of oxygen in the ionization states OVII or OVIII is larger than 30 percent practically for the whole range of densities and temperatures expected in the warm IGM.
Estimates for the detectability of filaments in the warm IGM which take only local thermal emission into account may have been overly pessimistic. XMM should be able to detect the radiation resonantly scattered by diffuse gas in a filament with Thomson optical depth of and metallicity 0.3 solar at with signal-to-noise of a few.
For filaments close to massive cluster the signal will be enhanced due to illumination from the cluster core and/or AGN contained in the cluster. The most promising sources emitting high X-ray intensities are beamed blazars which should have a high space density. For AGN and especially blazars constraints on the duration of the active phase may also be obtainable.
6 Acknowledgements
We thank the referee K. Yamashita for helpful comments. MH gratefully acknowledges the hospitality of the Institute for Theoretical Physics Santa Barbara where this research was completed. This research was supported in part by the National Science Foundation under Grant No. Phy94-07194.
References
- [Arnaud 1996] Arnaud K.A. 1996, Astronomical Data Analysis Software and Systems V, eds. Jacoby G. and Barnes J., ASP Conf. Series volume 101, 17
- [Aldcroft et al. 1994] Aldcroft T., Elvis M., McDowell J., Fiore F. 1994, ApJ, 437, 584
- [Barcons and Fabian 1992] Barcons X., Fabian A.C. 1992 , ARA&A, 30, 429
- [Barcons et al 1991] Barcons X., Fabian A.C., Rees M.J., 1991, Nature, 350, 685
- [Burles , Nolett , Truran ,Turner 1999 ] Burles S., Nolett K.M., Truran J.N., Turner M.S. 1999, Phys.Rev.Lett,82
- [Cen and Ostriker 1999] Cen R., Ostriker J.P. 1999, ApJ, 514, 1
- [Chandrasekhar 1960] Chandrasekhar S. 1960, Radiation Transfer, Dover, New York
- [Feldman 1992] Feldman U. 1992 , Physica Scripta , 46 , 202
- [Gilfanov , Sunyaev , Churazov 1987] Gilfanov M., Sunyaev R., Churazov E. 1987, Sov. Astron. Letters, 13, 233
- [Gunn and Peterson 1965] Gunn J.E., Peterson B.A. 1965, ApJ, 142, 1633
- [Hasinger et al. 1998] Hasinger G., Burg R., Giacconi R., Schmidt M., Truemper J., Zamorani G. 1998, A&A, 329, 482
- [Hellsten, Gnedin and Miralda-Escudé (1998)] Hellsten, U., Gnedin, N. Y. and Miralda-Escudé, J. 1998, ApJ, 509, 56
- [Hui and Gnedin 1997] Hui L., Gnedin N.Y., 1997, MNRAS, 292, 27
- [Kaastra 1992] Kaastra J.S.,1992. Internal SRON-Leiden report, version 2.0
- [Kaiser 1984] Kaiser N., 1991, ApJ, 383, 104
- [Markevitch (1999)] Markevitch, M. 1999, ApJ, 522, L13
- [Mewe, Gronenschild & van den Oord 1985] Mewe R., Gronenschild E.H.B.M., van den Oord G.H.J., 1985. A&AS, 62, 197
- [Mewe, Lemen & van den Oord 1985] Mewe R., Lemen J.R., van den Oord G.H.J., 1986. A&AS, 65, 511
- [Miyaji et al. 1998] Miyaji T., Ishisaki Y., Ogasaka Y., Ueda Y., Freyberg M.J., Hasinger G., Tanaka Y. 1998, A&A, 334, 13L.
- [Ostriker and Cen 1996] Ostriker J.P., Cen R. 1996, ApJ, 464, 270
- [Pen 1999] Pen U. 1999, ApJ, 510, 1
- [Perna and Loeb 1998 ] Perna R., Loeb A. 1998, ApJ, 503, 135
- [Pierre, Bryan & Gastaud 1999 ] Pierre M., Bryan G., Gastaud R. 1999, A&A, submitted (astro-ph/9910446)
- [Ponman et al 1999] Ponman T.J., Cannon D.B., Navarro J.F., 1999, Nature 397, 135
- [Rauch 1998] Rauch M., 1998, ARAA, 36, 267
- [Shapiro and Bahcall 1980] Shapiro P.R., Bahcall J.N. 1980, ApJ, 241, 1
- [Scharf et al 1999] Scharf C., Donahue M., Voit G.M., Rosat P., Postman M., 1999, preprint, astro-ph/9911277
- [Vainshtein & Sunyaev 1980] Vainshtein L., Sunyaev R., 1980, Soviet Ast. Letters, 6, 673
- [Verner & Yakovlev 1995 ] Verner D.A., Yakovlev D.G. 1995, A&AS, 109, 125
- [Verner et al. 1996 ] Verner D.A., Ferland G.J., Korista K. T., Yakovlev D.G. 1996, ApJ,465, 487
- [Weinberg 1999] Weinberg D.H, 1999, in: “Evolution of large scale structure: From Recombination to Garching”, ”Proceedings of the MPA- ESO cosmology conference, Garching, Germany, 1998”, eds. A.J. Banday, R.K. Sheth, L. N. da Costa, 346
- [Wise and Sarazin 1990] Wise M.W., Sarazin C.L. 1990, ApJ, 363, 344
- [Zeldovich 1970] Zeldovich Ya.B. 1970 A&A, 5, 84