A deep search for the optical counterpart to the anomalous X-ray pulsar 1E 2259+58.6
Abstract
We present Keck R and I band images of the field of the anomalous X-ray pulsar 1E 2259+58.6. We derive an improved X-ray position from archival ROSAT HRI observations by correcting for systematic (boresight) errors. Within the corresponding error circle, no object is found on the Keck images, down to limiting magnitudes and . We discuss the constraints imposed by these limits, and conclude that it is unlikely that 1E 2259+58.6 is powered by accretion from a disk, irrespective of whether it is in a binary or not, unless the binary is extremely compact.
Key Words.:
pulsars: individual: 1E 2259+58.6 – accretion, accretion disks – Stars: neutron – X-rays: stars1 Introduction
There is a growing number of X-ray pulsars for which it is not clear why they emit X-rays. Their rotational energy loss appears insufficient to power the X-ray luminosity and there is no sign of a companion from which they could accrete matter. These pulsars are called the “anomalous X-ray pulsars” (AXP).
The AXP differ from other X-ray pulsars in the following properties (Hellier (1994), Mereghetti & Stella (1995), van Paradijs et al. (1995)): (i) their spin periods are within a small range, between 5 and 9 seconds, and their spin-down rates are nearly constant; (ii) timing analysis gives no evidence of orbital motion; (iii) their X-ray spectra are rather soft; (iv) their X-ray light curves show less variability; (v) their inferred X-ray luminosities are rather low (); (vi) they are located close to the Galactic plane; (vii) some appear associated with supernova remnants.
Members of the group of AXP include 4U 0142+61, 1E 2259+58.6, 1E 1048.1$-$5937 and RX J1838.4$-$0301 (Mereghetti & Stella (1995) and references therein). Recently, three X-ray pulsars with similar properties were discovered: 1RXS J170849.0$-$400910 (Sugizaki et al. (1997)); 1E 1841$-$045 in the supernova remnant Kes 73 (Vasisht & Gotthelf (1997)); and AX J1845.0$-$0300 (Torii et al. (1998); Gotthelf & Vasisht (1998)) in the supernova remnant G29.6+0.1 (Gaensler et al. (1999)). Indeed, perhaps even the progeny of these systems has been identified, in RX J0720.4$-$3125 (Haberl et al. (1997)). The latter object is the only one for which the optical counterpart has been identified (Motch & Haberl (1998); Kulkarni & van Kerkwijk (1998)).
A variety of models for AXPs has been put forward, using both accretion and intrinsic mechanisms to explain the X-ray luminosity. For the accretion scenarios, the source of matter has been suggested to be a very low mass companion (Mereghetti & Stella (1995)) or a circumstellar disk composed of debris, either from a common envelope phase of a high mass X-ray binary (van Paradijs et al. (1995); Ghosh et al. (1997)) or from a supernova explosion (Corbet et al. (1995); Chatterjee et al. (1999)). In scenarios in which the X-ray emission is intrinsic, the sources are either hot, massive, rapidly spinning white dwarfs, formed in the merger of a double white-dwarf binary (Paczyński (1990)), or so-called “magnetars,” isolated neutron stars with very high magnetic field strengths (; Thompson & Duncan (1996)). In the latter case, AXP might be related to soft gamma-ray repeaters111The proposed X-ray counterparts to SGRs also have spin periods in the 5–9 s range (Kouveliotou et al. (1998), Kouveliotou et al. (1999))..
In this paper, we present a deep search for the optical counterpart to the AXP 1E 2259+58.6. In Sect. 2, we briefly review what is known about this source. We derive a refined position for 1E 2259+58.6 in Sect. 3, and in Sect. 4 we present our optical observations. We discuss the results in Sect. 5.
2 1E 2259+58.6
1E 2259+58.6 is located inside the supernova remnant CTB 109 (G109.1$-$1.0). This remnant is semi-circular, with neither X-ray nor radio emission from its western side (see, e.g., Rho & Petre (1997)), which may be related to the presence of a molecular cloud. A lobe of enhanced X-ray emission (‘jetlike’ feature) is present in between the eastern shell and the pulsar, but likely this does not reflect physical interaction.
1E 2259+58.6 is an X-ray pulsar with a period of 6.98 s. It is observed to be spinning down with a period derivative of . Baykal & Swank (Baykal & Swank (1996)) found small but significant deviations from constant spin-down and concluded that accretion must be the source of energy (but see Melatos Melatos (1999) for a different explanation). An upper limit lt-s has recently been obtained with the RXTE (Mereghetti et al. (1998)). Assuming a Roche-lobe filling companion and an orbital inclination , this restricts the companion mass to for a main-sequence star, and to for a helium-burning star. No constraint can be set for a white-dwarf companion.
1E 2259+58.6 has a very soft X-ray spectrum, best described by a combination of a power-law with photon index and a blackbody with , absorbed by a column density (Rho & Petre (1997) using ASCA, BBXRT and ROSAT PSPC data; see also Corbet et al. (1995)). A possible problem is contamination of the spectrum by extended emission around the pulsar (Rho & Petre (1997)). Parmar et al. (Parmar et al. (1998)) tried to account for this by subtracting the observed spectrum of the supernova remnant multiplied with a scale factor. They find that the residual spectrum can be fitted with a simple power law with an absorption column density of . It should be noted, however, that the BeppoSAX LECS and MECS instruments used by these authors have rather poor spatial resolution. Furthermore, Rho & Petre (Rho & Petre (1997)) found that the spectral shape of the extended emission near 1E 2259+58.6 differs from that of the remnant.
No radio counterpart to 1E 2259+58.6 has been found down to an upper limit of (Coe et al. (1994)). So far, no counterpart at optical and infrared wavelengths could be identified (Davies & Coe (1991); Coe & Pightling (1998)). These authors obtained limiting magnitudes of B , V , R , I , H , J and K , although they could not exclude several candidates due to the fact that the X-ray position of 1E 2259+58.6 was not known accurately enough. Note that their astrometry differs from ours and that of Fahlman et al. (Fahlman et al. (1982)) (see Sect. 3 and Davies & Coe Davies & Coe (1991)).
2.1 Distance and reddening to 1E 2259+58.6
All distance estimates to 1E 2259+58.6 use distances to either CTB 109 or the molecular cloud, i.e., it is assumed that the pulsar is at the same distance as CTB 109 and that the molecular cloud is either at the same distance as well or in front (and causes the absence of emission from the western part of the CTB 109). The distance to CTB 109 was estimated using the surface brightness diameter relation by Sofue et al. (Sofue et al. (1983)) and Hughes et al. (Hughes et al. (1984)), at 4.1 and 5.6 kpc, respectively. A lower limit to the distance of was obtained by Strom (priv.comm) from hydrogen 21-cm line absorption measurements towards the remnant (Braun & Strom (1986)).
For the molecular cloud, a kinematic distance of can be derived from the molecular line measurements of Kahane et al. (Kahane et al. (1985)) (here, we used the linear fit to the galactic rotation curve of Fich et al. Fich et al. (1989), with rotation constants and ). Distance estimates have also been made for several H ii regions associated with the molecular cloud. Spectrophotometric parallaxes for the exciting stars were obtained by Crampton et al. (Crampton et al. (1978)), leading to distances of 5.5, 5.6, 3.6 and 4.0 kpc for the H ii regions S148, S149, S152 and S153, respectively. Furthermore, a lower limit of towards S152 was obtained by Strom (priv.comm) using hydrogen 21-cm line absorption. From the above, assuming that the fractional errors in the spectrophotometric parallaxes are about 25% (corresponding to uncertainties of about 0.5 mag in the absolute magnitudes inferred from the spectral types), we conclude that a distance to the molecular cloud of is most likely, and, therefore, that 1E 2259+58.6 is at .
The reddening to 1E 2259+58.6 can be estimated from the X-ray hydrogen column density using the relation , where is the visual extinction in magnitudes (Predehl & Schmitt (1995)). From the fits to the X-ray spectrum of Rho & Petre (Rho & Petre (1997)), values of between 0.8 and are found, with a best fit value of . Thus, one infers to mag, with a best-fit value of 4.7 mag. For , as found by Parmar et al. (Parmar et al. (1998)), one would infer mag. As noted above, however, we feel this measurement is rather uncertain.
The reddening can be estimated indirectly using CTB 109. Fesen & Hurford (Fesen & Hurford (1995)) measured H and H relative line intensities in optical spectra of 5 filaments, and found to mag, with substantial variations across the remnant. These values appear somewhat lower than those derived above from the X-ray absorption for 1E 2259+58.6, and thus one may wonder about the association, or about possible intrinsic absorption around 1E 2259+58.6. Since the reddening to the remnant is seen to vary, however, a somewhat higher value for 1E 2259+58.6 does not seem unlikely. Furthermore, from the X-ray emission of CTB 109, column densities corresponding more closely to that of 1E 2259+58.6 are inferred (Rho & Petre (1997)).
In the following, we will adopt a reddening of mag and a distance of 6 kpc, unless noted otherwise.
3 Improved X-ray position
1E 2259+58.6 has been in the field of view of two observations with the ROSAT high resolution imager (HRI; David et al. 1999). The first was in 1992 from January 8, 07:16 UT, to January 10, 18:59 UT, and was centered on 1E 2259+58.6. The second was pointed at the lobe to the East of the pulsar and was from June 25, 07:46 UT, to June 27, 08:26 UT. In both observations, the semicircular shell, the lobe, the pulsar and the extended emission in its immediate surroundings, as well as three other point sources can be seen. We identify the latter with sources 1, 2 and 3 in Table 4 of Rho & Petre (Rho & Petre (1997)), and will refer to these as RP1, RP2 and RP3 hereafter.
The data were analysed using the EXSAS software package (1998 April version) in the following way. First, we corrected for the small error in HRI plate scale found by Hasinger et al. (Hasinger et al. (1998)), by multiplying all detector positions (relative to the detector centre) with a factor 0.9972. Next, we ran the standard source detection program, which creates a preliminary source list using a sliding cell algorithm. This source list is fed into a maximum likelyhood detection algorithm (Cruddace et al. (1988)), which yields precise positions (see Zimmermann et al. (1998)). In order to prevent trouble with the extended emission from the remnant, we used two masks, one to the East of CTB 109 containing RP3 and one to the West containing RP1, RP2 and 1E 2259+58.6. Our final positions are listed in table 1; the 1- errors are internal, i.e., they do not yet include pointing uncertainties. We verified that different choices of mask images gave consistent results.
Comparing the positions derived for the two observations (Table 1), it is clear that they are not consistent. This reflects the uncertainties in the attitude solutions used to transform detector positions to sky positions (see, e.g., David et al. (1999)). One can correct for this if one has independent positions for some of the sources, for instance from optical counterparts. Below, we will try to do this.
| Source | |||
|---|---|---|---|
| RP1 – HRI | |||
| January 1992 | 23 00 32.85 | 58 52 51.9 | 0.9 |
| June 1992 | 23 00 33.98 | 58 52 49.5 | 2.3 |
| RP1 – counterpart | |||
| 1425-14436845b | 23 00 33.396 | 58 52 47.16 | 0.2 |
| DSS1 1953.830 | 23 00 33.393 | 58 52 47.22 | 0.2 |
| DSS2 1991.671 | 23 00 33.377 | 58 52 47.07 | 0.2 |
| RP3 – HRI | |||
| January 1992 | 23 03 19.41 | 58 45 33.9 | 1.3 |
| June 1992 | 23 03 20.30 | 58 45 26.4 | 1.5 |
| RP3 – counterpart | |||
| 1425-14515707b | 23 03 19.472 | 58 45 28.95 | 0.2 |
| DSS1 1953.830 | 23 03 19.471 | 58 45 28.43 | 0.2 |
| DSS2 1991.671 | 23 03 19.578 | 58 45 28.68 | 0.2 |
| 1E 2259+58.6 – HRI | |||
| January 1992 | 23 01 08.09 | 58 52 48.3 | 0.1 |
| June 1992 | 23 01 08.99 | 58 52 45.3 | 0.1 |
| 1E 2259+58.6– corrected | |||
| Using RP1 and RP3 | 23 01 08.44 | 58 52 44.1 | 0.9 |
| Using RP1 only | 23 01 08.62 | 58 52 43.5 | 1.3 |
a Uncertainty in each coordinate (in arcsec).
b USNO-A2 identifier; mean epoch 1953.830.
Many X-ray sources can be identified with bright stars; for instance, Motch et al. (Motch et al. (1998)) find that 85% of the sources in a galactic plane region are bright stars. Therefore, we searched the USNO-A2.0 catalogue (Monet et al. (1998)) for bright stars () near the positions of RP1, RP2 and RP3. We tentatively identify RP1 and RP3 with stars USNO-A2 1425-14436845 and USNO-A2 1425-14515707, respectively. No bright star was found within of the position of RP2. We derived proper motions for the two stars by measuring positions on first and second generation images from the digitized sky survey, using astrometry relative to the USNO-A2.0 catalogue222Note that both DSS1 and USNO-A2.0 positions were derived from the same plate and the results should therefore agree. The slight discrepancy in declination for RP3 is probably due to a second (fainter) star close to the proposed counterpart. This does however not affect our results. (Table 1). For USNO-A2 1425-14515707, we found a significant proper motion of at position angle .
The refined position for 1E 2259+58.6 was derived as follows. First, the HRI positions were shifted to a common reference using the positions of 1E 2259+58.6. Next, we determined weighted average offsets in right ascension and declination between the HRI and optical positions (including proper motion). For this purpose, we weigh the four individual offsets in right ascension and declination (RP1 and RP3; two HRI observations) using the uncertainties given by the source detection algorithm (the errors in the optical positions are much smaller, ).
The differences with the weighted average correspond to for 6 degrees of freedom. This is not a good fit and suggests the presence of additional systematic errors. Following Hasinger et al. (Hasinger et al. (1998)), we added an error in quadrature to the individual measurement errors such that . For this purpose, we require . Including this additional uncertainty, we infer that our corrected position of 1E 2259+58.6, listed in Table 1, has an uncertainty of 09 in each coordinate. This corresponds to a 95% confidence error radius of 22.
The value of we find is twice the value used by Hasinger et al. (Hasinger et al. (1998)). While these authors also included an uncertainty in optical positions, we wondered whether the somewhat large required value might be related to the rather large offset from the center of RP3. To get a feeling for the uncertainty, we also determined a corrected position using RP1 only. The position is shifted slightly and has a slightly larger uncertainty of 13 in each coordinate (see Table 1). The 95% confidence error circle for this case has a radius of 33.
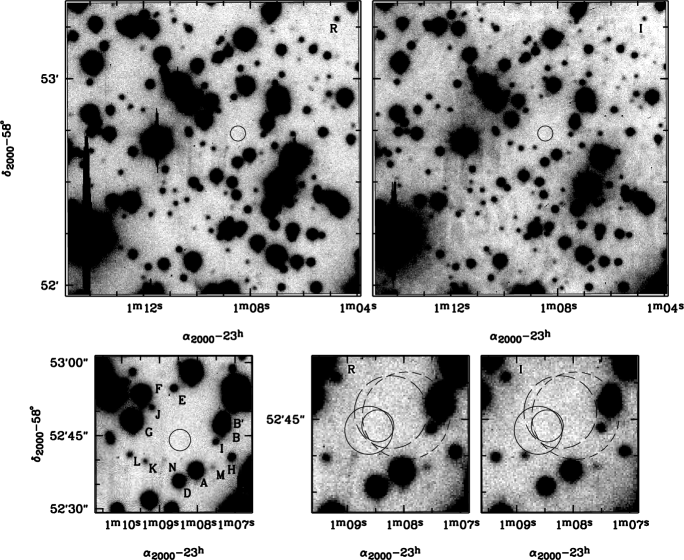
We show both error circles superposed on Keck images in Fig. 1. Also indicated are the positions determined previously by Fahlman et al. (Fahlman et al. (1982); short dashed) and Hanson et al. (Hanson et al. (1988); long dashed). Note that all these positions differ significantly from that of Coe & Pighting (Coe & Pightling (1998)). We do not understand the reason for this discrepancy.
4 Keck Observations
Optical (R and I band) images of the field around 1E 2259+58.6 were obtained on 1994 October 30/31 and 1997 January 7 using the Low-Resolution Imaging Spectrometer (LRIS, Oke et al. (1995)) at the Cassegrain focus of the Keck I (1994) and Keck II (1997) telescopes. The 1994 observations were plagued by clouds and high cirrus; the seeing was 11. All 1994 images have a large gradient in the sky background. As a result, all but one of these images are useless. In 1997, the weather was photometric, but the seeing mediocre at 12. All images were bias subtracted and flat fielded using dome flats. Unfortunately, it turned out that in the 1997 R-band images the position of 1E 2259+58.6 was very close to a region of lower sensitivity in the CCD, which did not flat-field out. The resulting “smear” is just over stars K and N in two of the three images; it can also be seen in Fig. 1).
| Star | |||
|---|---|---|---|
| A | |||
| B | |||
| B’ | |||
| D | |||
| E | |||
| F | |||
| H | |||
| I | |||
| J | |||
| K | |||
| L | |||
| M | |||
| N |
a In addition to the listed uncertainties, there is a 0.1 mag uncertainty in the zero point; see text.
Astrometry was done using a short (300 s) R band image from 1997. We identified objects with stars in the USNO-A2.0 catalogue and obtain centroids for objects that were not saturated and appeared stellar (i.e., had a sufficiently small diameter). Next, we applied a bi-cubic distortion correction (J. Cohen, 1997, private comm.), and solved for zero-point position, scale, and position angle by comparison with the USNO-A2.0 positions. After rejecting six outliers (probably misidentifications or large proper motion objects), the remaining 134 objects gave a good solution. The root-mean-square displacement from the catalogued positions is 0.26″ in right ascension and 0.25″ in declination.
For the photometry, we used the DAOPHOT II software package (Stetson (1987)). Instrumental magnitudes were obtained from two R band images (one from 1994 and one from 1997, 1000s exposure each) and the average of two I band images (300s each, 1997 only). We calibrated the photometry using the magnitudes determined by Davies & Coe (Davies & Coe (1991)). The apparent magnitudes of selected objects as determined from the 1997 observations are listed in Table LABEL:tab01. The values derived for the 1994 R-band image are consistent with these, but have lower accuracy. Note that the uncertainties listed in the table are the formal fitting errors. In addition to these, there are systematic uncertainties related to the zero point. Since Davies & Coe (Davies & Coe (1991)) found a discrepancy by about 0.15 mag in magnitudes obtained from two different exposures, the zero-point uncertainty is probably of the order of 0.1 mag.
No object is found inside either of the HRI error circles derived above. We derived lower limits with the help of simulations. For these, we took the mean of the three 1997 R band images and selected the inner region of the image that is void of stars. Next, we placed an artificial star with magnitude at a random spot in this region and determined its magnitude in the same way as for the real objects (this also allowed us to verify the errors quoted in the table). This was done ten times for a number of values of , within a range 25.0–26.9 for R and 23.7–25.7 mag for I. We define the detection threshold to be that magnitude for which the standard deviation equals 0.3 mag. Taking account of the fact that we need about 3 trials to cover the error circle, the derived limits are and (for the error circle derived using RP1 only we need 7.5 trials and obtain and ).
5 Discussion
We now examine the limits on the optical emission imposed by the various models proposed for 1E 2259+58.6. Contributions to the optical flux can come from the object itself, an accretion disk and a companion star. We will discuss these, in the context of the proposed models, in the following subsections.
5.1 An isolated object
Paczyński (Paczyński (1990)) proposed that 1E 2259+58.6 is a rapidly rotating, hot, massive, hot white dwarf, formed in the merger of two normal white dwarfs. Such a rapidly rotating white dwarf can have sufficient rotational energy loss () to power the observed X-ray flux. Using blackbody emission and a white dwarf radius of , our optical limits correspond to a maximum temperature keV. Since the Eddington condition gives a maximum temperature of keV (Paczyński (1990)), our data can thus not exclude this model.
Similarly, our limits do not allow us to constrain the magnetar model. (A very crude estimate gives for a keV blackbody at kpc and reddened by .)
5.2 An isolated NS accreting from a disk
We will make an estimate for the optical emission of an accretion disk using two simple models. In the first, we use the relation expected for an accretion disk dominated by irradiation (labeled V90 hereafter; Vrtilek et al. (1990)). An important assumption in obtaining this relation is that the disk is isothermal in the vertical direction, due to the irradiation. The second model we use is a Shakura-Sunyaev disk (labeled SS; Shakura & Sunyaev (1973)), in which the energy generated by the disk itself is taken into account but irradiation is neglected. For both models, we assume the disk emits like a blackbody. We believe the first model should be the more reasonable approximation (at least for radii larger than a few cm; for smaller radii, this model underestimates the emission; see Fig. 2), while the second model should give a conservative limit.
Fig. 2 shows predicted R-band fluxes as a function of disk radius for a disk inclined by 60° relative to the line of sight, located at a distance of 6 kpc, and either irradiated by a central X-ray source with (V90), or not irradiated (SS). Also shown is the contribution to the total flux from each radius (at constant ). There is no significant contribution to the flux for radii larger than cm (V90) and cm (SS), because the temperature becomes too low. For a large disk around an isolated neutron star, we find for the V90 disk (cm; ), and for the SS disk (cm; ). Here, for both estimates we used an R-band extinction , which corresponds to (see Sect. 2.1).
From the above limits, we conclude that it is unlikely that 1E 2259+58.6 is an isolated NS accreting from a disk. Only if we underestimated the reddening considerably or if the disk inclination were very unfavourable, a (large) accretion disk could have escaped detection. Increasing the distance to the source is not an option, since the optical emission of the disk is proportional to the X-ray emission. (for the SS disk model at 10 kpc, we still expect ).

5.3 A very low mass binary
The optical emission of low mass X-ray binaries is dominated by the emission from the accretion disk surrounding the compact object. An empirical relationship, , was found by van Paradijs & McClintock (van Paradijs & McClintock (1994)). Assuming , according to this relationship a putative binary must have s in order to remain below our detection limit . This would rule out all but a white dwarf counterpart. There is considerable scatter around the relation, however, and period estimates will be off by a factor of 5 for a change of 1 mag. Furthermore, it is far from clear one can extrapolate their result to such short periods.
Given the above, it is perhaps more relevant to compare our limits with the emission from the compact low-mass X-ray binary 4U 1626$-$67 (Chakrabarty (1998)). Indeed, this source has a number of the properties of AXP (Mereghetti & Stella (1995); cf. van Paradijs et al. (1995)). Under the assumption that 4U 1626$-$67 and 1E 2259+58.6 have the same ratio, the expected magnitude would be . Here, we have taken account of the difference in X-ray flux of about a factor ten (compare, e.g., Orlandini et al. (1998) and Parmar et al. (1998)), as well as the difference in reddening towards the two sources. Even if the X-ray flux of 1E 2259+58.6 were only one twentieth that of 4U 1626$-$67, we would still expect to have detected the optical counterpart at . Thus, we conclude that most likely even such a compact binary would have been detected.
What would our limits imply if there were no accretion disk present and the optical emission was dominated by the companion star? This seems unlikely, but might perhaps be the case if accretion is from a (irradiation-induced) stellar wind. We will discuss two possible companions below: (i) a main-sequence star; (ii) a He-burning star. From Sect. 5.1) above, it will be clear that we can put no meaningful constraints for the case the only source of optical emission is a white-dwarf companion.
Based on the colors derived from model spectra by Bessell et al. (Bessell et al. (1998)) (overshoot models, their Table 1, for ), we find that a main-sequence companion to 1E 2259+58.6 would have to be of type K or later to escape detection.
To start helium burning, a star’s mass must exceed . From Savonije et al. (Savonije et al. (1986)), we find that a helium burning star has K and . Using Table 3 of Bessell et al. (Bessell et al. (1998)), we infer a bolometric correction of and for a 20000 K star (note that this table does not extend to , but since the variation with is small, our extrapolation should be safe). For these values, the star would have and , which is just below our detection limit. More massive stars would be brighter, and, thus, if the companion is a star burning helium it must have a mass close to the limit of .
6 Conclusions
We have shown that the tight limits we derive on the optical emission of 1E 2259+58.6 are a serious problem for scenarios involving accretion by way of an accretion disk. This is irrespective of whether the source is in a binary, except if the binary is extremely compact. Therefore, we conclude that, most likely, 1E 2259+58.6 is an isolated object, and that its emission is not powered by accretion. We note that the same conclusion was indepently drawn by Kaspi et al. (Kaspi et al. (1999)) on the basis of the extreme rotational stability of 1E 2259+58.6.
Acknowledgements.
We would like to thank Richard Strom for discussions about the distance to 1E 2259+58.6. We have made use of the ROSAT Data Archive of the Max-Planck-Institut für extraterrestrische Physik (MPE) at Garching, Germany, of the SIMBAD database operated at CDS, Strasbourg, France, and of the Digitized Sky Surveys, which were produced at the Space Telescope Science Institute from photographic data obtained using the Oschin Schmidt Telescope on Palomar Mountain. We acknowledge support of a fellowship of the Royal Netherlands Academy of Arts and Sciences (MHvK) and grants from NASA and NSF (SRK).References
- Baykal & Swank (1996) Baykal A., Swank J., 1996, ApJ 460, 470
- Bessell et al. (1998) Bessell M.S., Castelli F., Plez B., 1998, A&A 333, 231
- Braun & Strom (1986) Braun R., Strom R.G., 1986, A&AS 63, 345
- Coe & Pightling (1998) Coe M.J., Pightling S.L., 1998, MNRAS 299, 223
- Coe et al. (1994) Coe M.J., Jones L.R., Lehto H., 1994, MNRAS 270, 178
- Corbet et al. (1995) Corbet R.H.D., Smale A.P., Ozaki M., et al., 1995, ApJ 443, 786
- Chakrabarty (1998) Chakrabarty D., 1998, ApJ 492, 342
- Chatterjee et al. (1999) Chatterjee P., Hernquist L., Narayan R., 1999, astro-ph/9912137
- Crampton et al. (1978) Crampton D., Georgelin Y.M., Georgelin Y.P., 1978, A&A 66, 1
- Cruddace et al. (1988) Cruddace R.G., Hasinger G.R., Schmitt J.H., 1988, in Astronomy from Large Databases: Scientific objectives and methodological approaches;Proceedings of the Conference, Garching, Federal Republic of Germany, Oct. 12-14, 1987 (A89-27176 10-82). ESO conf. proceedings 28, p. 177
- David et al. (1999) David L.P. Harnden F.R., Kearns K.E., et al., 1999, US ROSAT Science Data Center/SAO (http://hea–www.harvard.edu/rosat/rsdc_www/hricalrep.html)
- Davies & Coe (1991) Davies S. R., Coe M. J., 1991, MNRAS 249, 313
- Fahlman et al. (1982) Fahlman G.G., Hickson P., Richer H.B., et al., 1982, ApJ 261, L1
- Fesen & Hurford (1995) Fesen R.A., Hurford A.P., 1995, AJ 110, 747
- Fich et al. (1989) Fich M., Blitz L., Starke A.A., 1989, ApJ 342, 272
- Gaensler et al. (1999) Gaensler B.M., Gotthelf E.V., Vasisht G., 1999, ApJ 526, L37
- Ghosh et al. (1997) Ghosh P., Angelini L., White N.E., 1997, ApJ 478, 713
- Gotthelf & Vasisht (1998) Gotthelf E.V., Vasisht G., 1998, NA 3, 293
- Haberl et al. (1997) Haberl F., Motch C., Buckley D.A.H., et al., 1997, A&A 326, 662
- Hanson et al. (1988) Hanson C.G., Dennerl K., Coe M.J., et al., 1988, A&A 195, 114
- Hasinger et al. (1998) Hasinger G., Burg R., Giacconi R., et al., 1998, A&A 329, 482
- Hellier (1994) Hellier C., 1994, MNRAS 271, L21
- Hughes et al. (1984) Hughes V.A., Harten R.H., Costain C.H., et al., 1984, ApJ 283, 147
- Kahane et al. (1985) Kahane C., Guilloteau S., Lucas R., 1985, A&A 146, 325
- Kaspi et al. (1999) Kaspi V.M., Chakrabarty D., Steinberger J., 1999, ApJ 525, L33
- Kouveliotou et al. (1998) Kouveliotou S., Dieters S., Strohmayer T., et al., 1998, Nat 393, 235
- Kouveliotou et al. (1999) Kouveliotou S., Strohmayer T., Hurley K., et al., 1999, ApJ 510, L115
- Kulkarni & van Kerkwijk (1998) Kulkarni S.R., van Kerkwijk M.H., 1998, ApJ 507, L49
- Melatos (1999) Melatos A., 1999, ApJ 519, L77
- Mereghetti & Stella (1995) Mereghetti S., Stella L., 1995, ApJ 442, L17
- Mereghetti et al. (1998) Mereghetti S., Israel G.L., Stella L., 1998, MNRAS 296, 689
- Monet et al. (1998) Monet D., Bird A., Canzian B., et al., 1998, USNO-A2.0 (Washington D.C.: US Naval Observatory)
- Motch & Haberl (1998) Motch C., Haberl F., 1998, A&A 333, L59
- Motch et al. (1998) Motch C., Guillot P., Haberl F., et al., 1998, A&A 318, 111
- Oke et al. (1995) Oke J.B., Cohen J.G., Carr M., et al., 1995, PASP 107, 375
- Orlandini et al. (1998) Orlandini M., Dal Fiume D., Frontera F., et al., 1998, ApJ 500, L163
- Paczyński (1990) Paczyński B., 1990, ApJ 365, L9
- van Paradijs & McClintock (1994) van Paradijs J., McClintock J.E., 1994, A&A 290, 133
- van Paradijs et al. (1995) van Paradijs J., Taam R.E., van den Heuvel E.P.J., 1995, A&A 299, L41
- Parmar et al. (1998) Parmar A.N., Oosterbroek T., Favata F., et al., 1998, A&A 330, 175
- Predehl & Schmitt (1995) Predehl P., Schmitt J.H.M.M., 1995, A&A 293, 889
- Rho & Petre (1997) Rho J., Petre R., 1997, ApJ 484, 828
- Savonije et al. (1986) Savonije G.J., de Kool M., van den Heuvel E.P.J., 1986, A&A 155, 51
- Shakura & Sunyaev (1973) Shakura N.I., Sunyaev R.A., 1973, A&A 24, 337
- Sofue et al. (1983) Sofue Y., Takahara F., Hirabayashi H., 1983, PASJ 35, 447
- Stetson (1987) Stetson P.B., 1987, PASP 99, 191
- Sugizaki et al. (1997) Sugizaki M., Nagase F., Torii K., et al., 1997, PASJ 49, L25
- Thompson & Duncan (1996) Thompson C., Duncan R.C., 1996, ApJ 473, 322
- Torii et al. (1998) Torii K., Kinugasa K., Katayama K., et al., 1998, ApJ 503, 843
- Vasisht & Gotthelf (1997) Vasisht G., Gotthelf E.V., 1997, ApJ 486, L129
- Vrtilek et al. (1990) Vrtilek S.D., Raymond J.C., Garcia M.R., et al., 1990, A&A 235, 162
- Zimmermann et al. (1998) Zimmermann U., Boese G., Becker W., et al., 1998, MPE Report, ROSAT Scientific Data Center (http://wave.xray.mpe.mpg.de/exsas/users-guide)